
Footnotes & Flashbacks: State of Yields 1-3-25
The UST moves start the year quietly as the market gets fresh payrolls this week before the “Day 1” actions on tariffs later this month.


Time for the test. 2025 is here…
The month will bring a major test to the debt and equity markets with “Day 1” policy color ahead. Investors need to handicap critical issues such as tariffs, mass deportation, and “one bill or two” on the legislative agenda.
The past week saw Trump call for one massive bill instead of two bills as the handicapping of how to qualify his master budget plan for reconciliation (i.e., only a majority vote needed in the Senate).
One legislative wildcard (in a stack of wildcards) is to what extent Trump will need to pump up assumed tariff revenue to get to where he wants to be in his budget, including the tax plan and deportation cost estimates.
This week brings important jobs data (JOLTS, payroll) and the start of 4Q24 earnings and guidance season. The following week brings CPI, Retail Sales, Industrial Production, and Housing Starts as the rise in UST and recent 7% area mortgage rates undermine growth assumptions.
Note: As indicated in our year end reviews this past week (see links), we chose the 12-31-24 date for our weekly Footnotes publication on Asset Returns (see Footnotes & Flashbacks: Asset Returns for 2024 1-2-25) and for Credit Markets (see Footnotes & Flashbacks: Credit Markets 2024 1-3-25 ). We will be back in our normal Footnotes cycle next week.

The above chart updates historical UST curves across some important cyclical and market transition dates. We start with the Carter inversion of 1978 and then into the start of stagflation double dip period to end 1980 as Volcker fought his inflation war. The chart then moves on across the 1989 credit cycle peak (bridge loans, the broker bailouts and collapses dead ahead).
Then we see the 2000 TMT cycle peak (NASDAQ peak March 2000) as the TMT bubble was bursting and the default cycle was underway (Greenspan rapid-fire easing during 2001). Then comes the 2006 housing bubble peak and structured credit excess on the way to the late 2007 recession start and systemic crisis of 2008 that brought the world of protracted ZIRP and major bank/broker consolidation.
We intentionally leave out the post-crisis ZIRP and QE UST curves to help frame the UST’s current period against cycles less colored by hyper-easing monetary policies (ZIRP, QE, partial normalization, then COVID ZIRP). We plot the UST from the peak date for the 10Y UST (10-19-23) as the last UST curve posted before this past Friday. We include the actual yields in the box as well as plot the curve for a visual.
Those who tend to focus on the period back to the crisis of late 2008 and later with the COVID UST curves often neglect the fact that the current UST curve is extraordinarily low in multicycle context. Just scanning the current 3M and 10Y in the boxes above tells a story.
With the 2024 easing, even the 3M UST is down at the low end vs. pre-crisis cycles presented above. Those may not be the lowest rates thinking back to the early 2000s (e.g., 1% fed funds in early 2004 ahead of the tightening cycle) but they are in a different zip code than the 1990s and 1980s (note the 9% handle 3M UST in 1989).

The above chart updates the shifting UST curves and related deltas from the 10-19-23 peak and from 12-31-23 through this past Friday. The shifts and reshaping were extraordinary given how forecasts were evolving across that time period. We see the material downward shift driven by the FOMC on the short end and move lower by the market on the longer end since the 2023 peak.
The upward shift and steepening beyond 2Y in 2024 was not the consensus to start the year, but here we are again with the short end materially lower and the discussion ongoing around how many times and how soon the FOMC will act again. There are some tectonic moving parts as we head toward outsized policy moves in tariffs and deportation that makes life even more complicated. Tariff costs and labor market distortions, potential retaliatory tariffs, and export disarray of the sort seen in 2018-2019 (only worse) plus currency questions make for a complex recipe.
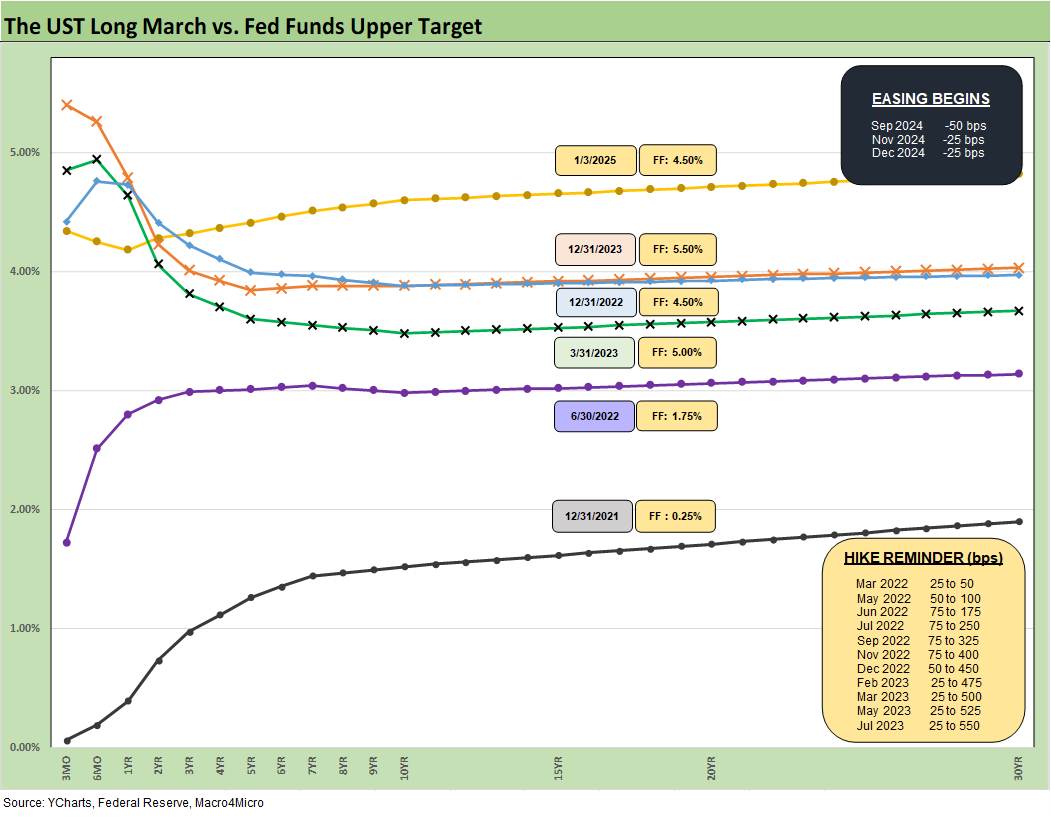
We update the timeline of the UST curve moves from 12-31-21 and then across some key dates as the UST curve shifted higher on the longer end and more recently the front end was pushed lower by the FOMC. We saw the convergence of the 10Y UST of 12-31-22 and 12-31-23 despite the 100 bps differential in fed funds.
We now have another 100 bps differential in fed funds over 1 year for the current UST curve vs. 12-31-23. This time, we see a materially different higher 10Y UST with fed funds lower. The tendency of many to assume the longer end will follow the short end has been revisited over the tightening cycle and now the easing cycle.

We already looked at the 1-week delta impacts in Mini Market Lookback: Mixed Start, Deep Breaths (1-5-25). A lot of action lies ahead in reading how the UST curve action will play out with unprecedented tariff and deportation disruptions being considered with the reactions of trading partners and the Fed anything but certain. The same uncertainty lurks in private sector hiring and capital budgeting, and supplier chain planning. Policy actions could derail some of the economic assumptions built into current multiyear projects that cannot be changed without material damage.

The above bar chart updates the running UST deltas from 12-31-23. We see the bear steepening beyond 2Y and the favorable easing and bull steepening on the short end inside 2Y UST.

The running UST deltas from the peak UST 10Y date (10-19-23) tells a very different story as we have covered regularly and as detailed in the earlier curve chart. The monster rally of Nov-Dec 2023 was a rare period with stocks, spreads, and UST all driving solid returns.

The above chart updates the Freddie Mac 30Y benchmark (horizontal lines) as of the end of 2005 after the peak year for homebuilding, for mid-2006 as RMBS asset risk was under a cloud, and for this past week (the Freddie Mac benchmark gets posted at noon on Thursdays). We also post the UST curve for each date. The current Freddie Mac 30Y rate is the highest of the three but with a UST curve well below mid-2006. Divergences such as that keep optimists in the game for lower mortgage rates.

The above chart updates the 3M to 5Y UST slope as the 3M to 5Y segment becomes the latest to get back to upward sloping (barely). The +7 bps slope is positive and still well short of the long-term median from 1984 of +109 bps.

We get a more granular view of the shifting 3M to 5Y UST slope by starting the timeline in early 2021. The peak slope reached +221 bps in May 2022 before plunging into an inversion of -197 bps in May 2023. The slope ratcheted toward positive in the climb back across the easing cycle and with the steepening out beyond 2Y UST.
The “normal” slope reflected in the median of +109 bps makes for a hard sell on the 5Y to 10Y part of the UST curve getting much lower without some catalysts for lower rates all along the curve. Such a catalyst is usually not good news for macro trends. Add in tariffs and labor noise, and the case for flattening from the long end is shaky.

We wrap with the usual chart that frames the running UST deltas since March 1, 2022 in the month that marked the end of ZIRP (effective 3-17-22). We also include the 12-31-20 UST curve and 10-19-23 peak UST as frames of reference. The +402 bps delta on the 3M and +288 bps running delta on the 10Y UST highlight the need for more movement on the short and less on the long end to get back closer to a more normalized slope.
See also:
Mini Market Lookback: Mixed Start, Deep Breaths 1-5-25
Footnotes & Flashbacks: Credit Markets 2024 1-3-25
Footnotes & Flashbacks: Asset Returns for 2024 1-2-25
HY and IG Returns since 1997 Final Score for 2024 1-2-25
Spread Walk 2024 Final Score 1-2-25
Credit Returns: 2024 Monthly Return Quilt Final Score 1-2-25
Annual and Monthly Asset Return Quilt 2024 Final Score 1-2-25
HY and IG Returns since 1997: Four Bubbles and Too Many Funerals 12-31-24
Footnotes & Flashbacks: State of Yields 12-29-24
Mini Market Lookback: Last American Hero? Who wins? 12-29-24
Spread Walk: Pace vs. Direction 12-28-24
Annual and Monthly Asset Return Quilt 12-27-24
Credit Returns: 2024 Monthly Return Quilt 12-26-24
New Home Sales: Thanksgiving Delivered, What About Christmas? 12-23-24
Mini Market Lookback: Wild Finish to the Trading Year 12-21-24
Trump Tariffs 2025: Hey EU, Guess What? 12-20-24
PCE, Income & Outlays Nov 2024: No Surprise, Little Relief 12-20-24
Existing Home Sales Nov 2024: Mortgage Vice Tightens Again 12-19-24
GDP 3Q24: Final Number at +3.1% 12-19-24
Fed Day: Now That’s a Knife 12-18-24
Credit Crib Note: Iron Mountain 12-18-24
Housing Starts Nov 2024: YoY Fade in Single Family, Solid Sequentially 12-18-24
Industrial Production: Nov 2024 Capacity Utilization 12-17-24
Retail Sales Nov24: Gift of No Surprises 12-17-24
Inflation: The Grocery Price Thing vs. Energy 12-16-24
Toll Brothers: Rich Get Richer 12-12-24
CPI Nov 2024: Steady, Not Helpful 12-11-24
Mini Market Lookback: Decoupling at Bat, Entropy on Deck? 12-7-24
Credit Crib Note: Herc Rentals (HRI) 12-6-24
Payroll Nov 2024: So Much for the Depression 12-6-24
Trade: Oct 2024 Flows, Tariff Countdown 12-5-24
JOLTS Oct 2024: Strong Starting Point for New Team in Job Openings 12-3-24
Select Histories:
Mexico: Tariffs as the Economic Alamo 11-26-24
Tariff: Target Updates – Canada 11-26-24
Tariffs: The EU Meets the New World…Again…Maybe 10-29-24
Trump, Trade, and Tariffs: Northern Exposure, Canada Risk 10-25-24
Trump at Economic Club of Chicago: Thoughts on Autos 10-17-24
HY OAS Lows Memory Lane: 2024, 2007, and 1997 10-8-24
Credit Returns: Sept YTD and Rolling Months 10-1-24
HY Industry Mix: Damage Report 8-7-24
Volatility and the VIX Vapors: A Lookback from 1997 8-6-24
HY Pain: A 2018 Lookback to Ponder 8-3-24
Presidential GDP Dance Off: Clinton vs. Trump 7-27-24
Presidential GDP Dance Off: Reagan vs. Trump 7-27-24
The B vs. CCC Battle: Tough Neighborhood, Rough Players 7-7-24
HY Spreads: Celebrating Tumultuous Times at a Credit Peak 6-13-24
Credit Markets Across the Decades 4-8-24
Credit Cycles: Historical Lightning Round 4-8-24
Histories: Asset Return Journey from 2016 to 2023 1-21-24
Credit Performance: Excess Return Differentials in 2023 1-1-24
Return Quilts: Resilience from the Bottom Up 12-30-23
HY vs. IG Excess and Total Returns Across Cycles: The UST Kicker 12-11-23
HY Multicycle Spreads, Excess Returns, Total Returns 12-5-23
US Debt % GDP: Raiders of the Lost Treasury 5-29-23
Wild Transition Year: The Chaos of 2007 11-1-22
Greenspan’s Last Hurrah: His Wild Finish Before the Crisis 10-30-22