
Footnotes & Flashbacks: Credit Markets 2024
We wrap a favorable year in credit as it faces a serious test ahead after 2024 had more in common with past credit cycle peaks.


So, if I try to kill it with tariffs and labor shortages, it will only grow stronger?
We put a timestamp on some final credit stats for a year when good times brought tight spreads but kept duration under pressure with a UST curve that was supposed to be flatter and lower turned into steeper and higher beyond 2Y UST out to 30Y (see Credit Returns: 2024 Monthly Return Quilt 12-26-24)
“This time is different” depends on where you sit. For those mired in credit markets over the years, we know the times are in fact “all different” and it is a matter of “How different?”(see HY and IG Returns since 1997: Four Bubbles and Too Many Funerals 12-31-24, Annual and Monthly Asset Return Quilt 12-27-24.)
Very tight spreads in a post-inflation easing cycle with back-to back 3.0% handle GDP quarters, low unemployment, and a recent slew of stock market records will now (based on stated policy goals) see a radical change in trade and labor policies ahead (i.e., immigrant labor supply). The bullish performance streak in credit in 2023-2024 will be very hard to sustain (see Credit Returns: 2024 Monthly Return Quilt 12-26-24).
We enter 2025 with HY OAS under the +300 bps line, IG OAS in double digits, and a low UST curve in the context of pre-crisis, pre-ZIRP years (see Footnotes & Flashbacks: State of Yields 12-29-24).
“Good times” seen in many economic indicators and favorable risky asset markets for investors can get tricky when so many are busy calling the current economy “bad times.” The reality of objectively measured macro metrics will be the real test since policy makers cannot control market reactions.
Note to readers: With the changeover in the calendar, we focus on the 12-31-24 numbers for this commentary. We will return to a normal weekly cycle in our full range of Footnotes publications the weekend of Jan 11-12. We will provide the Mini Lookback and State of Yields this weekend then back on the normal routine a week later.

As we wrap up the last of the 2024 lookbacks, this commentary covers the Credit Markets piece of our weekly Footnotes. We timestamp it at 12-31-24. We are coming off a two-year stretch we will not see again soon. After all, it takes a material widening of spreads to get two years that are this strong in credit (see HY and IG Returns since 1997: Four Bubbles and Too Many Funerals 12-31-24).
The market would prefer to leave behind the first inflation spike and inflation fighting tightening cycle in over 4 decades. That sent spread spiraling wider in 2022. One cannot rule out more tightening and inflation ahead until some of these tariff and deportation theories get tested. At peak valuations in equity and credit, such policy aggression might not go well. That will keep UST bulls and credit market fans hoping that the more extreme policy paths are not taken.
We have already looked at the multi-asset return profiles for 2024 as noted in the links at the bottom. We did some of the commentary during the holiday week using late Dec 2024 marks and then updated the charts after the final prints.
For the above chart covering returns across the credit tiers, the main themes are once again the total return headwinds from the longer-dated bear steepening on duration for IG returns. We see the value of shorter duration and credit risk maximization for lower credit tiers. This unfolded in a year of very bullish risk appetites in equities and credit optimism fueled by easing (expected and actual), a solid consumer sector, improved inflation, and GDP growth that ended the year with rare (in the new millennium) back-to-back 3% handle quarters in GDP growth.

We already have given excess returns on the year a close look and how they frame up across the credit cycles. The excess return for HY was positive in 2024 but below the long term median (28 years from 1997) as it came off a very strong 2023. As covered during the holiday season commentaries, three good years of excess returns in a row is a big ask across history and notably with such a low starting point in HY OAS.

The relative toss-up battle of excess returns between BBB and BB as noted above was a feature of 2024. The convergence of excess returns is consistent with the blurring of the lines in the BB and BBB tier as investors position themselves for improving credits from the BB tier or simply buying rock-solid BB names that bring some diversity of industry and issuer mix.
While the general theme in credit tiers was “a tightening year” some major IG sectors had more muted rallies with some underlying industry groups narrowing less in IG (notably Capital Goods, Autos) where issuers were feeling pressure.
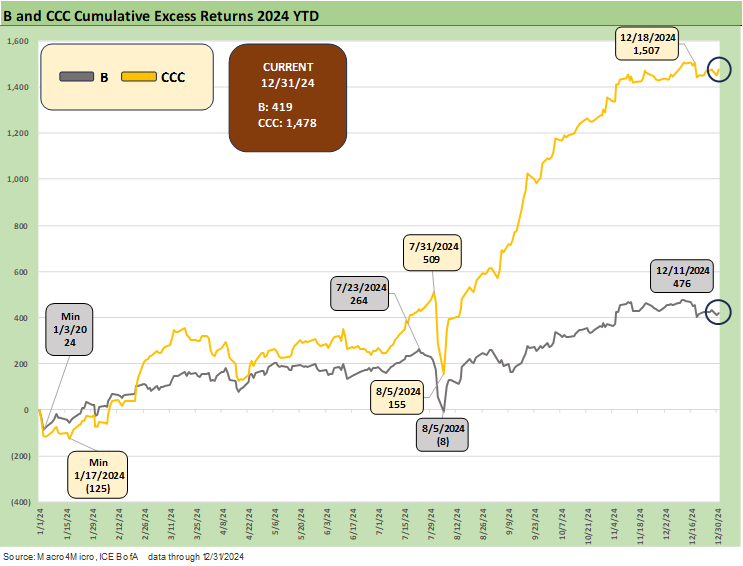
The CCC tier was a big winner in 2024 in the broader risk rally but also on the usual array of constituent developments (exits on default, distressed exchanges, etc.) that moved the needle. The CCC tier is always one to look at from the bottom up at issuer level stories in a tier that is around 12% of HY market value (see The B vs. CCC Battle: Tough Neighborhood, Rough Players 7-7-24).
A look at spreads….

The long-term median from the start of 1997 for IG spreads is +131 bps with typical cyclical lows in IG OAS in the post-crisis years in the double-digit range. An exception was the June 2014 low of +106 bps.
We see the timeline low of +53 bps back in Oct 1997, and those seen in 1997 and in 2005 (+79 bps) offer some support for the current 80s range for IG optimists. History has shown that IG OAS can hang around OAS levels below 100 bps for protracted stretches of time as highlighted in the +99 bps median of March 2001 to Dec 2007 with the healthiest slice of that timeline from 1H04 to 1H07. We also saw a long stretch in double digits across 1997-1998.
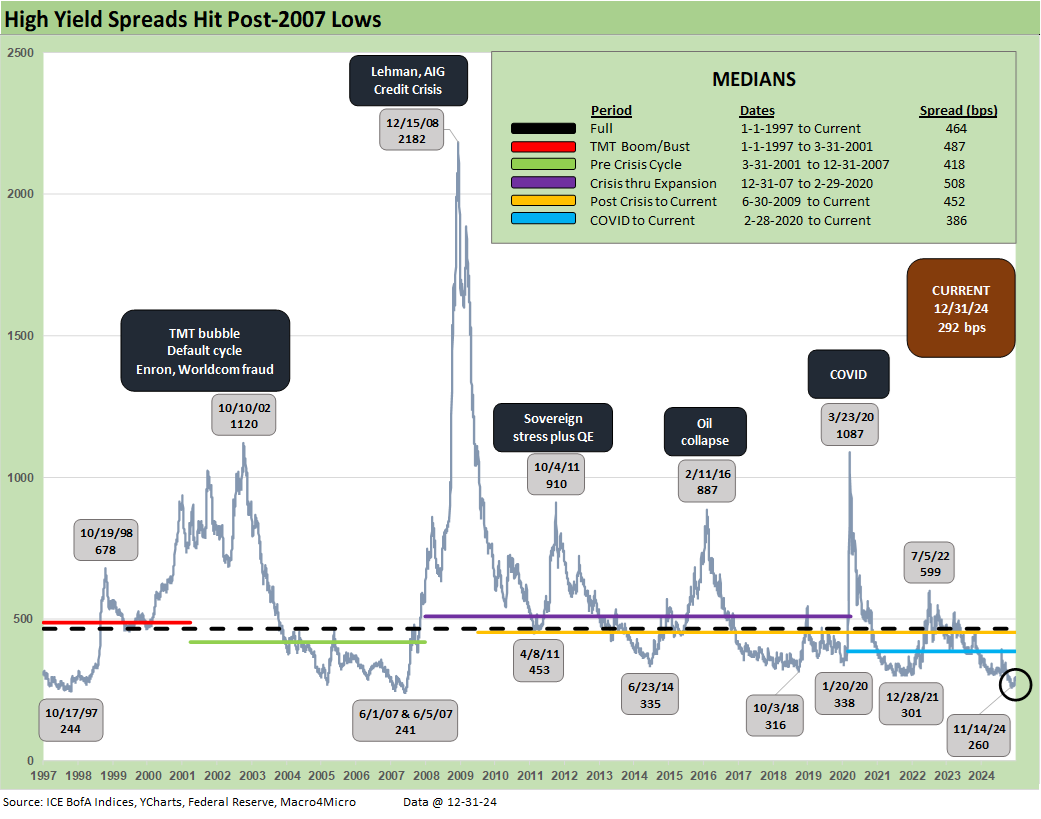
HY OAS trends can prove to be an adventure as captured in the above chart. The highest risk end of the HY bond spectrum morphs into the equivalent of high-risk equities rather than “bond risk” with the usual debates over recovery rates and impaired secondary liquidity.
While it was before daily OAS was available, the credit problems showing up in the spring of 1989 came well before the recession onset in the summer of 1990. What followed mid-1989 was especially ugly and included numerous bailouts of brokerage houses and Drexel’s Chapter 11 (see UST Moves: 1988-1989 Credit Cycle Swoon 10-20-23, UST Moves: The 1990-1991 Risk Factor Pig Pile 10-24-23). A recurring theme is the challenge of framing economic cycles with credit cycles and monetary cycles. There is always too much going on to oversimplify the causes.
The history of HY OAS above offers a reminder of the material spread wave that can unfold within an economic expansion with low interest rates such as we saw in Oct 2011, Feb 2016, and way back in the fall of 1998.
There are checklists for what unfolded in those periods, but they tend to get overshadowed by periods such as the TMT bubble bursting (2000-2002), the systemic mayhem of the housing sector and structure credit meltdown (2007-2008), and the COVID market panic where the regulatory and fiscal response was remarkably and immediately successful.

The above chart updates the “HY OAS minus IG OAS” quality spread differential. At +210 bps to end the year, that is well inside the collection of medians posted in the chart with the long-term median at +327 bps and the current post-COVID median the lowest of the mix at +282 bps.
Excluding the systemic crisis of late 2008 (as close to the end of the world in global banking as you can get without mushroom clouds), it is interesting that the TMT peak differential materially exceeded the COVID spike. There was a big difference between the 2020 and the TMT Bubble default cycle. The monetary policy action (and demand from income and yield desperation in 2020), the depth of the investor base in 2020, the breadth and diversity of HY issuers and the investor base (including reduced exposure to HY fund redemption risk), the rapid deployment of Fed/UST and fiscal support actions (even if just jawboning), and a healthier bank system (less gunslinging brokers than 2000-2002, less bank interconnectedness risk) made a big difference in 2020.
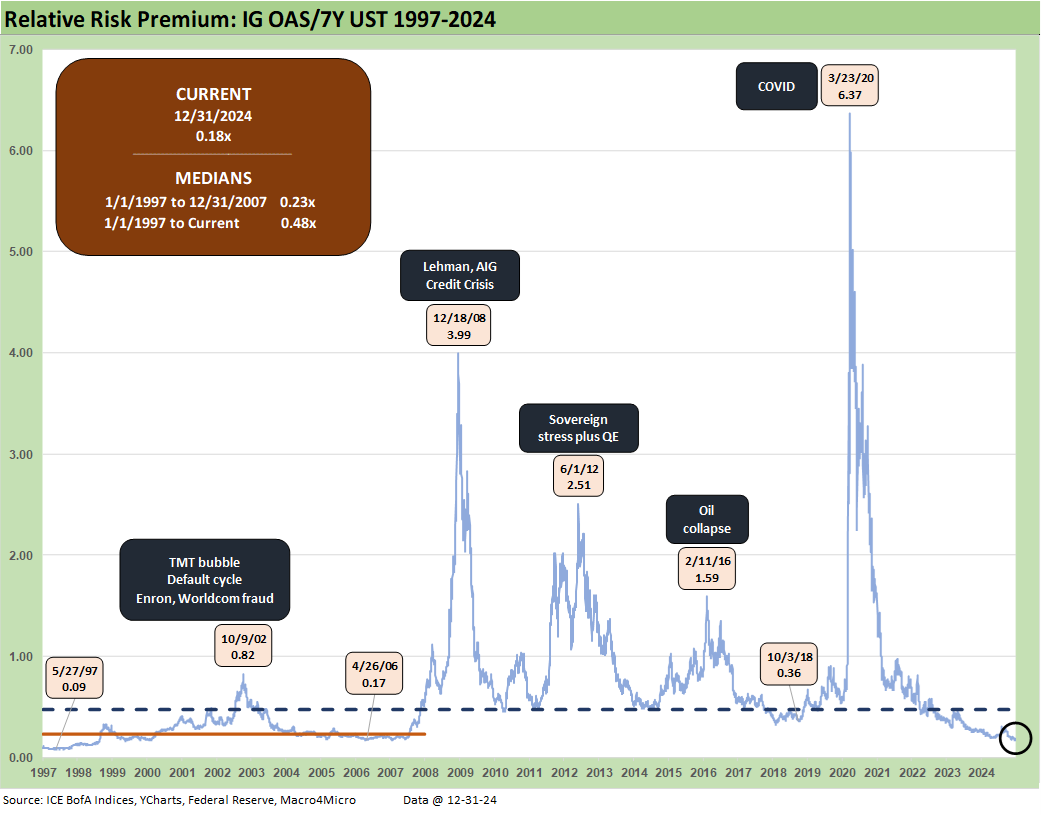
We have not updated the OAS/UST chart for a while since they don’t change the narrative much, but the ratio is meant to capture the proportionate risk premium of the credit spreads vs. a relevant US Treasury (in the duration neighborhood of the index). For IG OAS, we use the 7Y UST. IG OAS /7Y UST of 0.18x or inside the long-term median of 0.23x. We see 0.36x at the cyclical low of early Oct 2018 and 0.17x back in the spring of 2006.
The ZIRP, QE and not-quite normalization years distorted the relationships along the way. That backdrop would send investors in credit back to the tradeoff of “minimum yield for the risk” vs. “relative yield and income needs.” That is when you get into the discussion of “reach for yield” vs. relative value and income opportunities.
With the market now well past ZIRP (ended March 2022) and in an easing cycle after the inflation battle, there are many more asset classes and income alternatives beyond IG and HY. The market is seeing more ways for institutions and retail investors to play credit risk and cash income alternatives in loans, private credit, energy MLPs, BDC equities (or bonds, prefs, common), and CLOs among many others. There are also more than a few ETFs cited in the trade press that are in the process of extending the range of retail opportunities into private credit.
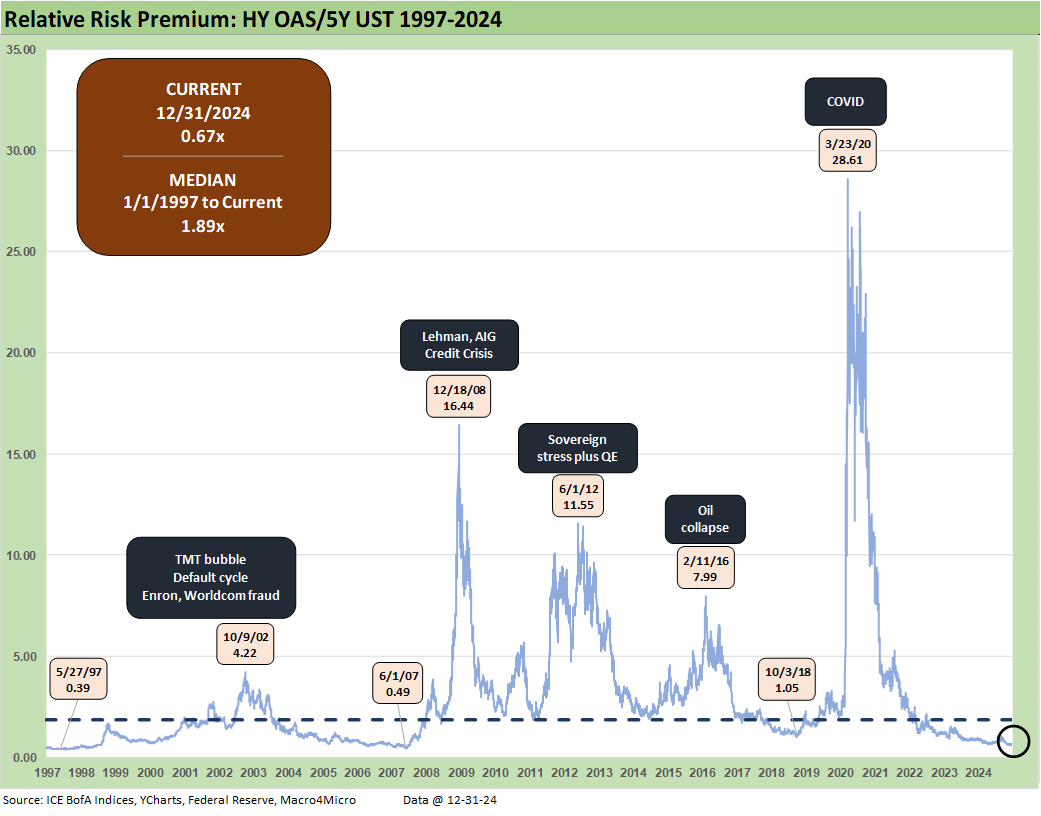
We do the same proportionate risk premium drill above that we did for IG except we use the 5Y UST as the frame of reference. The current ratio of 0.67x is well inside the long-term median of 1.89x. We see 1.05x at the 10-3-18 cyclical low in the pre-COVID cycle and 0.49x at the June 2007 HY OAS lows. Going back to spring 1997 we see 0.39x.
No matter how you look at it, the credit compensation is low vs. the risk-free alternative. That is hardly a late-breaking news item, but the ratio gives some additional objective context in the concept of getting paid for credit risk across the cycles.

The above time series updates the “BB OAS minus BBB OAS” quality spread differential for year end 2024. The long-term median of +135 bps tells a story vs. the 12-31-24 close of +84 bps. We have seen the differential climb from the cyclical lows of +55 bps in July 2024. That July low was more in line with the lows of Dec 2019, Oct 2018, June 2007, and June 2005. For now, some cushion is built into the additional compensation after a 2022 peak of +214 bps as inflation was peaking.

The BB tier OAS is holding in under the rarely crossed +200 bps line with a current BB OAS of +186 bps to end the year. We last saw sub-200 bps in early 2020 as the BB tier and HY market were in par-plus range with many BB tier names trading above call prices before COVID kicked into gear in March.
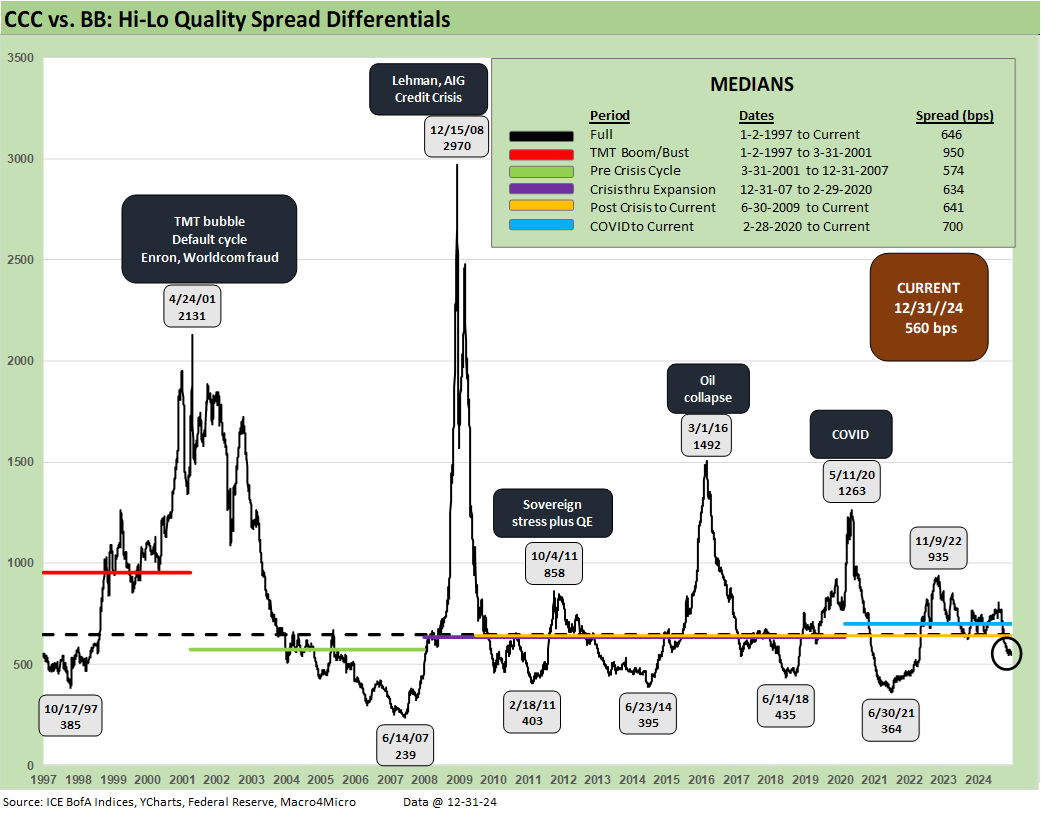
We have not updated these often, but we occasionally like to frame what we call the “Hi-Lo” range within the HY credit tiers where we frame the BB tier OAS vs. the CCC tier OAS. We start the timeline in this version in 1997. The “CCC OAS minus BB OAS” Hi-Lo quality spread differential can swing around as we see in the TMT implosion of 2000-2002 and during the credit crisis of late 2008. We see the lows broken out in the chart with the highs more erratic in magnitude.
The oil sector collapse was notable in early 2016 given the hideous recovery rates coming out of the first wave of defaults and the fact that so many of the distressed situations were driven by the same variables (oil and gas prices).
The Oct 2011 systemic flashback moment saw sovereign stress raise anxiety again around the banks, but it faded quickly as UST rallied. The March 2020 spike did not drive a major default cycle or downturn with rates favorable, fiscal support rapid, and the reality that crashing oil was like a big tax cut for the consumer sector.

The above version of the Hi-Lo BB vs. CCC quality spread differential shortens up the timeline to just before the end of ZIRP and tightening cycle. At +560 bps to end the year, the Hi-Lo is well inside the peak of +935 bps in Nov 2022 and inside the +646 bps long-term median.

The B tier OAS compression was a major driver in 2023 as B tier OAS tightened by -174 bps before seeing the B tier OAS tighten by another -45 bps in 2024 to +296 bps. The long-term median of +468 bps is a long journey from current levels. The tightest median in the mix broken out above was the +397 bps from March 2001 (cyclical peak ahead of a brief 2001 recession) through the 12-31-2007 start of the post-housing recession.
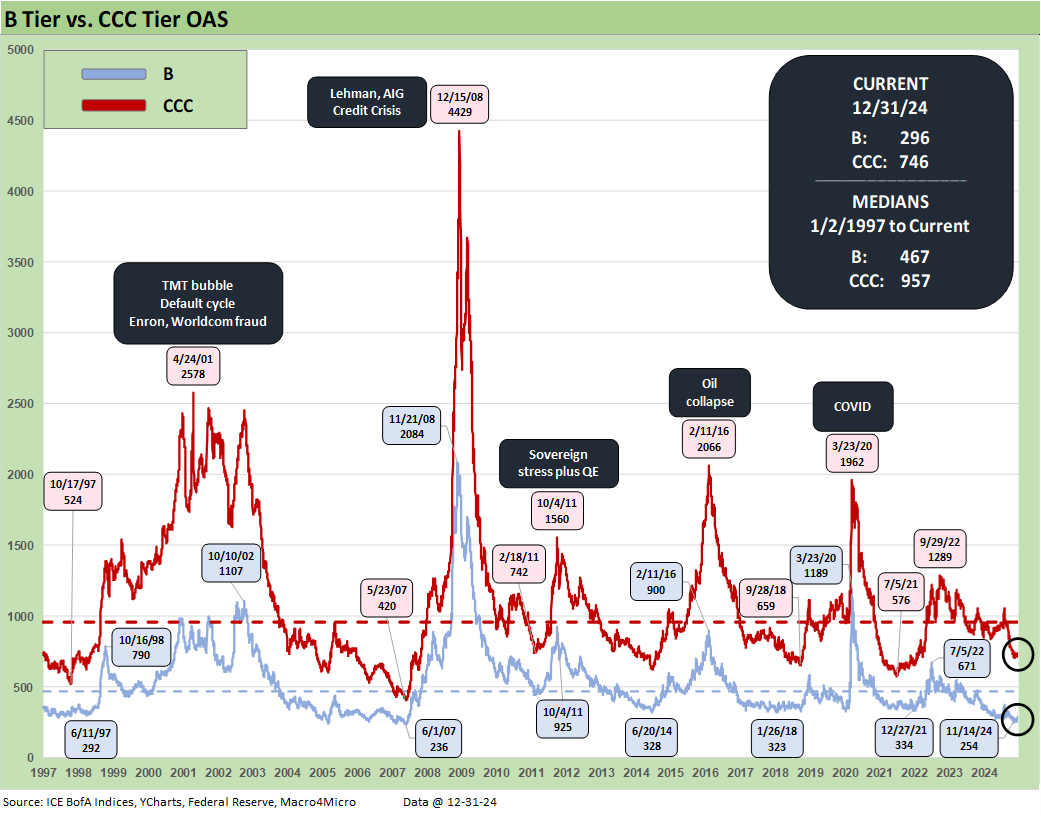
The above time series plots the B tier vs. the CCC tier for a wide-angle view on when CCCs diverged from the B tier. The TMT default cycle and credit crisis of 2008 saw the B and CCC tiers diverge the most while the early 2016 upstream energy meltdown was modestly ahead of the COVID meltdown.

We shorten up the timeline again in the above chart for a more granular view of the Fed tightening cycle swings and ensuing rally later in 2023 and into 2024.

The above plots the “CCC minus B OAS” quality spread differential, and the gap is still materially wide to the pre-tightening differential of +315 bps (Jan 2022) that subsequently peaked at +741 bps in Nov 2022.
A look at yields…

The above chart frames the YTW history for HY and IG across the cycles that we update each week. This shows where the year closed out at 5.36% for IG and 7.48% for HY. The long-term median of 4.7% IG and +8.0% HY covers the timeline from 1997 to 2024. The post-crisis period from 9-1-08 to 3-1-22 posted a median of 3.3% IG and 6.4% HY. That period has an excess of ZIRP in the mix.
We make the case that the pre-crisis median (using pre-Sept 2008) makes the most sense as a “comp” given the intrinsic distortion of ZIRP, QE, and some limited and brief attempts at normalization after the end of ZIRP in Dec 2015 and the second end of ZIRP in March 2022.
That means the frame of reference of 6.1% in IG and 9.3% in HY is a good focal point across time. Right now, the low UST curve and tight spreads make for a challenging all-in yield comparison depending on how you view forward risks.

The above chart updates the year end 2024 closing yield for IG vs. the peak credit cycles of June 2007 and late 1997. The horizontal lines capture the IG index yields for each date. We also include the UST curves for each date.
We see a materially higher UST curve to end 1997 vs. the 12-31-24 close with the June 2007 UST much closer to the recent UST curve. The UST always drives the bus for IG yields in a compressed IG spread backdrop.

We do the same drill for HY index yields for 12-31-24 vs. 12-31-97 and 6-30-07. The HY OAS compression will still allow for a steady, ongoing climb in par weighted coupons in 2025 as refinancing and extension continues. That will keep investor interest high in the search for income in what is still a low yield environment in fixed income when framed across the “normal” cycles before ZIRP. The mid 7% handle HY index yield reflects a B tier weighted average HY index.
See also:
Footnotes & Flashbacks: Asset Returns for 2024 1-2-25
Spread Walk 2024 Final Score 1-2-25
Annual and Monthly Asset Return Quilt 2024 Final Score 1-2-25
HY and IG Returns since 1997 Final Score for 2024 1-2-25
HY and IG Returns since 1997: Four Bubbles and Too Many Funerals 12-31-24
Footnotes & Flashbacks: State of Yields 12-29-24
Mini Market Lookback: Last American Hero? Who wins? 12-29-24
Spread Walk: Pace vs. Direction 12-28-24
Annual and Monthly Asset Return Quilt 12-27-24
Credit Returns: 2024 Monthly Return Quilt 12-26-24
New Home Sales: Thanksgiving Delivered, What About Christmas? 12-23-24
Mini Market Lookback: Wild Finish to the Trading Year 12-21-24
Trump Tariffs 2025: Hey EU, Guess What? 12-20-24
PCE, Income & Outlays Nov 2024: No Surprise, Little Relief 12-20-24
Existing Home Sales Nov 2024: Mortgage Vice Tightens Again 12-19-24
GDP 3Q24: Final Number at +3.1% 12-19-24
Fed Day: Now That’s a Knife 12-18-24
Credit Crib Note: Iron Mountain 12-18-24
Housing Starts Nov 2024: YoY Fade in Single Family, Solid Sequentially 12-18-24
Industrial Production: Nov 2024 Capacity Utilization 12-17-24
Retail Sales Nov24: Gift of No Surprises 12-17-24
Inflation: The Grocery Price Thing vs. Energy 12-16-24
Toll Brothers: Rich Get Richer 12-12-24
CPI Nov 2024: Steady, Not Helpful 12-11-24
Mini Market Lookback: Decoupling at Bat, Entropy on Deck? 12-7-24
Credit Crib Note: Herc Rentals (HRI) 12-6-24
Payroll Nov 2024: So Much for the Depression 12-6-24
Trade: Oct 2024 Flows, Tariff Countdown 12-5-24
JOLTS Oct 2024: Strong Starting Point for New Team in Job Openings 12-3-24
Select Histories:
Mexico: Tariffs as the Economic Alamo 11-26-24
Tariff: Target Updates – Canada 11-26-24
Tariffs: The EU Meets the New World…Again…Maybe 10-29-24
Trump, Trade, and Tariffs: Northern Exposure, Canada Risk 10-25-24
Trump at Economic Club of Chicago: Thoughts on Autos 10-17-24
HY OAS Lows Memory Lane: 2024, 2007, and 1997 10-8-24
Credit Returns: Sept YTD and Rolling Months 10-1-24
HY Industry Mix: Damage Report 8-7-24
Volatility and the VIX Vapors: A Lookback from 1997 8-6-24
HY Pain: A 2018 Lookback to Ponder 8-3-24
Presidential GDP Dance Off: Clinton vs. Trump 7-27-24
Presidential GDP Dance Off: Reagan vs. Trump 7-27-24
The B vs. CCC Battle: Tough Neighborhood, Rough Players 7-7-24
HY Spreads: Celebrating Tumultuous Times at a Credit Peak 6-13-24
Credit Markets Across the Decades 4-8-24
Credit Cycles: Historical Lightning Round 4-8-24
Histories: Asset Return Journey from 2016 to 2023 1-21-24
Credit Performance: Excess Return Differentials in 2023 1-1-24
Return Quilts: Resilience from the Bottom Up 12-30-23
HY vs. IG Excess and Total Returns Across Cycles: The UST Kicker 12-11-23
HY Multicycle Spreads, Excess Returns, Total Returns 12-5-23
US Debt % GDP: Raiders of the Lost Treasury 5-29-23
Wild Transition Year: The Chaos of 2007 11-1-22
Greenspan’s Last Hurrah: His Wild Finish Before the Crisis 10-30-22