
Mini Market Lookback: Mixed Start, Deep Breaths
The market is gearing up for an important earnings and guidance season but also a sense of tariffs and trade plans on Day 1.


A calm but favorable week for the UST supported duration and left 6 of 7 bond ETFs in positive return range in the second quartile after all 7 generated negative returns in the final quarter of 2024 (see Footnotes & Flashbacks: Credit Markets 2024 1-3-25).
Equities were more mixed with the broader range of energy names making a comeback on the week with the top 3 performers being E&P (XOP), Energy (XLE), and Midstream (AMLP) with small caps wedged into the top quartile. NASDAQ and the S&P 500 were in the bottom quartile for the week among the 32 benchmarks and ETFs we track.
This week kicks off earnings and guidance season along with JOLTS and payroll numbers, but the real action will come after inauguration when the tariff specifics will be either be immediate (in line with bears) or take on the form of continued negotiation posturing (in line with risk bulls).
One of our recurring questions on tariffs will be how much of room exists in the legislative strategies for “reconciliation” and the ability to pitch a budget story that navigates around the filibuster. Tensions will be exacerbated by nominee hearings and the cast of characters involved.
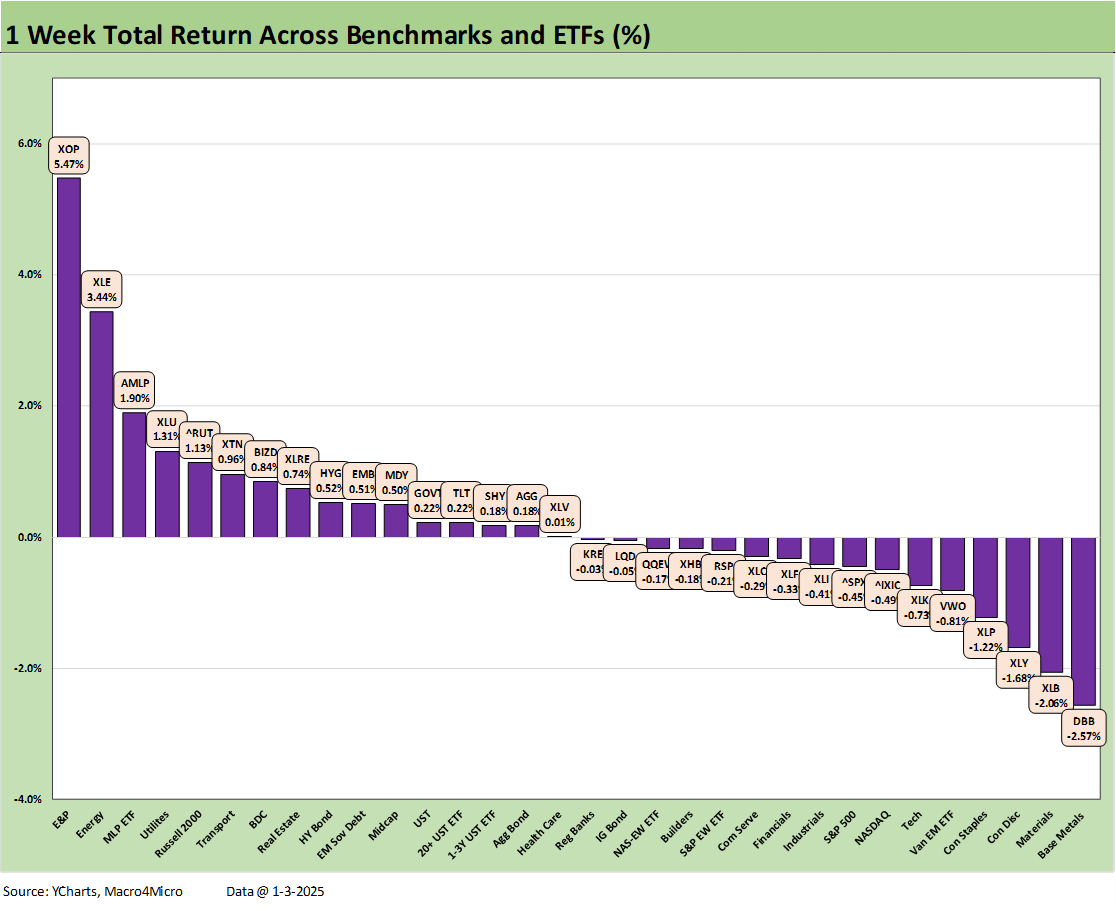
The 1-week asset returns show a dead heat of 16-16 in positive vs. negative. The winners on the week include the ever-volatile E&P (XOP) and Energy (XLE) ETFs with the less volatile and income heavy midstream ETF (AMLP) at #3. Bond ETFs had a solid week with 6 of 7 in positive range but IG Corporates (LQD) slightly negative.
The top quartile shows some relief for the Russell 2000 (RUT) after a fairly abysmal final month of 2024, but the Utilities ETF (XLU) was back in the top 5 after a rough 4Q24 in a year when XLU placed in the top quartile for the full year.
The bottom tier for the week includes some EM and China exposure setbacks including Base Metals (DBB) and EM Equities (VWO) with Materials (XLB) along with Consumer Discretionary (XLY) struggling with a bad week for its Tesla concentration. NASDAQ and S&P 500 had an off week in the bottom quartile as well.

The above table lists the tech bellwethers in descending order of total returns for the week. We see over a 10-point differential from the high-to-low return for the week. Both the high and low lines were in the Mag 7 with NVDA at +5.44% and TSLA at -4.92%. We see 4 of the Mag 7 in the red joined by NASDAQ, the S&P 500, the Equal Weight S&P 500 (RSP), and the Equal Weight NASDAQ 100 ETF (QQEW).

The above chart updates the UST curve deltas for the week in what is a net positive move for bond ETFs as noted earlier even if the move was a small one in the context of the pre-holiday action.

We update the running Freddie Mac 30Y benchmark since Jan 2021 back in the days of ZIRP before those ended in March 2022. The challenges to the housing sector that relate to the curve and mortgage rates have been covered in our housing sector work (see links at bottom). We get the next housing starts release later next week (Jan 17).
Lennar, the #2 homebuilder, reported recently (11-30 fiscal year). We got a lot of color on the price vs. pace dynamics, the direction of incentives in light of adverse mortgage rate moves, and the working capital management challenges (balancing starts with sales).
The challenges to homebuilding profit margins have been evident given incentive costs and the strategy of some builders to “meet buyers where they are” and focus on efficiency and inventory turns. That translates into weaker profit margins but high free cash flow numbers for buybacks for the best-positioned, large homebuilders. The cash flow resilience of builders supports credit quality, but there is no fighting the tape on equity valuation for building after the Homebuilders ETF (XHB) was leading the asset pack into Sept. We framed those trends in recent asset return commentaries.
The existing home sales market is still in somewhat of a state of disarray even as inventory is well off the lows. The price factor (sellers not lowering prices quickly enough) is still undermining transaction volumes in historical context even if the bigger X factor is the refinancing costs (low mortgage locked in for current home, golden handcuffs, etc.). Slower existing sales volumes reduce the rate of “move up” transactions in the new home market as well.

HY spreads have hung in very well in all the UST noise and equity setbacks of late as detailed in the links at the bottom (see Footnotes & Flashbacks: Credit Markets 2024 1-3-25, Spread Walk: Pace vs. Direction 12-28-24). The past week saw another small spread compression of -3 bps to +281 bps as the HY OAS remains below the 300 line and well into the June 2007 and late 1997 zone (see HY OAS Lows Memory Lane: 2024, 2007, and 1997 10-8-24).

The “HY OAS minus IG OAS” quality spread differential narrowed by -5 bps this week with HY slightly tighter and IG slightly wider. You don’t see sub-200 bps differentials much across the cycles as we cover in the Credit Market Footnotes commentary. The risk appetites remain high in HY bonds. The most aggressive yield chasing is over in private credit in this cycle and not the HY bond markets relative to past underwriting cycles.

The “BB OAS minus BBB OAS” quality spread differential tightened by -6 bps on the week to +74 bps or well inside the long-term median of +135 bps. We are off the Nov 2024 lows of +57 bps.
See also:
Footnotes & Flashbacks: Credit Markets 2024 1-3-25
Footnotes & Flashbacks: Asset Returns for 2024 1-2-25
HY and IG Returns since 1997 Final Score for 2024 1-2-25
Spread Walk 2024 Final Score 1-2-25
Credit Returns: 2024 Monthly Return Quilt Final Score 1-2-25
Annual and Monthly Asset Return Quilt 2024 Final Score 1-2-25
HY and IG Returns since 1997: Four Bubbles and Too Many Funerals 12-31-24
Footnotes & Flashbacks: State of Yields 12-29-24
Mini Market Lookback: Last American Hero? Who wins? 12-29-24
Spread Walk: Pace vs. Direction 12-28-24
Annual and Monthly Asset Return Quilt 12-27-24
Credit Returns: 2024 Monthly Return Quilt 12-26-24
New Home Sales: Thanksgiving Delivered, What About Christmas? 12-23-24
Mini Market Lookback: Wild Finish to the Trading Year 12-21-24
Trump Tariffs 2025: Hey EU, Guess What? 12-20-24
PCE, Income & Outlays Nov 2024: No Surprise, Little Relief 12-20-24
Existing Home Sales Nov 2024: Mortgage Vice Tightens Again 12-19-24
GDP 3Q24: Final Number at +3.1% 12-19-24
Fed Day: Now That’s a Knife 12-18-24
Credit Crib Note: Iron Mountain 12-18-24
Housing Starts Nov 2024: YoY Fade in Single Family, Solid Sequentially 12-18-24
Industrial Production: Nov 2024 Capacity Utilization 12-17-24
Retail Sales Nov24: Gift of No Surprises 12-17-24
Inflation: The Grocery Price Thing vs. Energy 12-16-24
Toll Brothers: Rich Get Richer 12-12-24
CPI Nov 2024: Steady, Not Helpful 12-11-24
Mini Market Lookback: Decoupling at Bat, Entropy on Deck? 12-7-24
Credit Crib Note: Herc Rentals (HRI) 12-6-24
Payroll Nov 2024: So Much for the Depression 12-6-24
Trade: Oct 2024 Flows, Tariff Countdown 12-5-24
JOLTS Oct 2024: Strong Starting Point for New Team in Job Openings 12-3-24
Select Histories:
Mexico: Tariffs as the Economic Alamo 11-26-24
Tariff: Target Updates – Canada 11-26-24
Tariffs: The EU Meets the New World…Again…Maybe 10-29-24
Trump, Trade, and Tariffs: Northern Exposure, Canada Risk 10-25-24
Trump at Economic Club of Chicago: Thoughts on Autos 10-17-24
HY OAS Lows Memory Lane: 2024, 2007, and 1997 10-8-24
Credit Returns: Sept YTD and Rolling Months 10-1-24
HY Industry Mix: Damage Report 8-7-24
Volatility and the VIX Vapors: A Lookback from 1997 8-6-24
HY Pain: A 2018 Lookback to Ponder 8-3-24
Presidential GDP Dance Off: Clinton vs. Trump 7-27-24
Presidential GDP Dance Off: Reagan vs. Trump 7-27-24
The B vs. CCC Battle: Tough Neighborhood, Rough Players 7-7-24
HY Spreads: Celebrating Tumultuous Times at a Credit Peak 6-13-24
Credit Markets Across the Decades 4-8-24
Credit Cycles: Historical Lightning Round 4-8-24
Histories: Asset Return Journey from 2016 to 2023 1-21-24
Credit Performance: Excess Return Differentials in 2023 1-1-24
Return Quilts: Resilience from the Bottom Up 12-30-23
HY vs. IG Excess and Total Returns Across Cycles: The UST Kicker 12-11-23
HY Multicycle Spreads, Excess Returns, Total Returns 12-5-23
US Debt % GDP: Raiders of the Lost Treasury 5-29-23
Wild Transition Year: The Chaos of 2007 11-1-22
Greenspan’s Last Hurrah: His Wild Finish Before the Crisis 10-30-22