
New Home Sales March 2025: A Good News Sighting?
The rise in new home sales is constructive with a strong move in the South, but consumer moods and mortgages are still an issue.


Heads I buy, tails I wait.
With all of the fear around tariff fallout, inflation, and uncertainty around where mortgage rates will migrate, more transaction triggers are getting pulled with the spring selling season underway.
Total new home sales rose by +7.4% MoM and +6.0% YoY with median prices dropping from $411.5K to $403.6K.
The South region, which jumped up to 67% of total for the month, posted a sequential rise of +13.6% and YoY increase of +22.3%.
Houses for sale (SAAR basis) hit a 12-month high as did completed homes for sale with houses under construction for sale (not seasonally adjusted) easing off to near a 12-month low.

The above chart updates the new single family home sales time series from 1963, and the current 724K is the highest since Sept 2024 when rates were easing and the curve had shifted materially lower to push 30Y mortgages near 6.0% (see Footnotes & Flashbacks: State of Yields 4-20-25). The mortgage rates last night were just under 7.0% using the Mortgage News Daily survey, so this is not a friendly market as we head further into the spring.
The tariff noise is staying high and confusion around what is next is anything but clear despite a few people jawboning this week to shape sentiment from the White House. The tariff issue is a double-edged sword. Some might say “move now before rates rise” and some others will think “I better sit tight. This could get ugly, and I lose my job.”
The reality of what has been stated this week is mostly spin. The “assurance” from Trump that he is not looking to fire Powell helps risky assets and might ease UST panic. Ironically, then UST rates might move lower on economic fears. That can help the stock market, but mortgages will need some good news from PCE inflation and payroll next week to move the UST curve needle more.
While Trump and Bessent are trying to reassure on the China trade war, their color was that they need Xi to respond first. “His move” seems to ignore the fact that the UST just slapped port fees on China last week (see Ships, Fees, Freight & Logistics Pain: More Inflation? 4-18-25) and launched a trade war against Chinese shipbuilding and shipping services that cannot be won. The US has a hard enough time adding a single new icebreaker let alone a fleet of container ships.
The meeting of major retailers with Trump this week emphasized that shelves would start to go bare, and Boeing confirmed that more planes are being returned. So, the real effects are getting clear. After all the aggressive action from the US on China tariffs and retaliation by China, the claim that it is “in China’s court” does not seem like a winner. China has not even kept pace on retaliation. The higher inflation worries and empty shelves threat seem to make China’s next move more about taking its time. Tariffs are paid by the buyer (Trump’s views to the contrary), so time is not on the US side in avoiding the fallout as transactions start registering.
The supplier chain issue in housing has not been a major factor this building season based on the color on the earnings calls, but the concerns of consumers in getting past their cyclical worries and to the point of a transaction will not ease if they see bare shelves, prices rising, and more layoffs and escalation on multiple trade war fronts. The pause is not just US tariffs. It is also a pause on trade partner retaliation (especially in the case of the EU). The clock is ticking. Trade partners see Trump in a bind. They do not need to rush during the pause. Japan is the test case for negotiation and it does not seem to be moving. That was supposed to be the “easy” one.
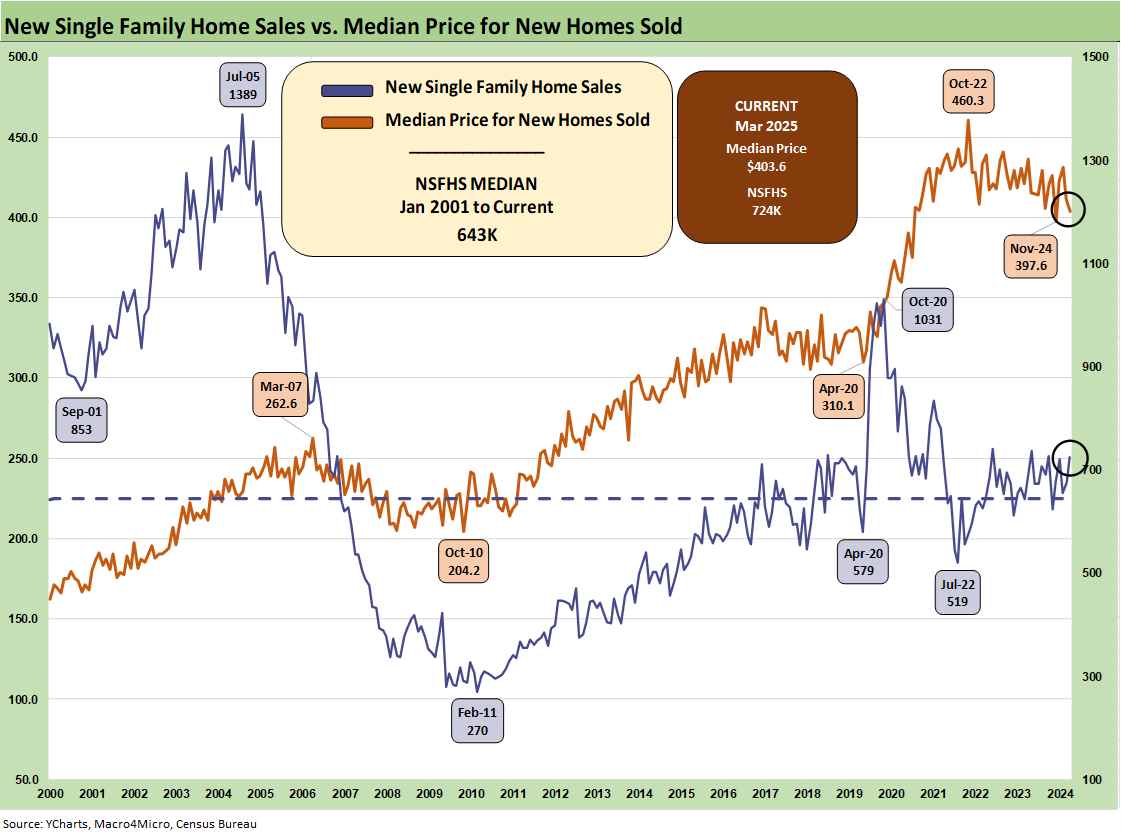
The above two-sided chart shows the sales pattern for the new home sales line since 2000 vs. the median prices. The fact that prices had trended higher is not a new topic, but the sensitivity of monthly payments is married to mortgage rates, which remain the primary driver of weaker volume in the lower price tiers in both new and existing sales.
The current $403.6K price ticked down sequentially from 411.5K in Feb 2025 and $431.4K in Jan 2025. While prices always come with a very big asterisk of regional mix and product tier shifts, we are starting to get more color from builders on the mixed challenges of cost creep and the sustained need to discount prices or offer incentives. That means margin squeeze. We are seeing numerous major builders post declining orders and lower backlogs in earnings reports. The “pace vs. price” topic has been hot again.
We also hear more often that the mortgage buydowns don’t work as well as they used to even when the market was seeing higher mortgage rates. Consumers are doing more than monthly payment math as sentiment weighs in.

The decline of the median home price last month to $403.6K is starting to look like a trend, but the South’s increased share is also a reason. Builder fears of higher materials and supplier chain costs are not going to do much to relieve homebuilders in their pricing strategies with gross margins softening in 2025. That said, most are still above pre-COVID levels even if down from peaks in 2022.
The builders need to frame how they can get into a gross margin zone that works, and they know that the expectation of costs can get wagged meaningfully by tariffs. The NAHB has put out some numbers for the average home cost from recent tariffs (over $9K per average home). We have commented on the NAHB view on tariff distortions in the past. They will be very busy in the coming months sorting out what is next subject to “the pause” and what comes out the other side.
Lumber is in the Section 232 process with duties already quite high. When the Canadian election is over (April 28, early voting underway), the policy actions will get interesting as Canada follows up on the brutal tariffs it has been hit with. The same for Mexico on its tariffs and, more narrowly, the building-related supplies such as gypsum. The NAHB published an updated commentary on tariffs last month (see NAHB: How Tariffs Impact the Home Building Industry March 2025).

The above chart gives a different visual angle on the median home prices from early 2022. That is a lot of $400K handles with one outlier in Nov 2024. The current $403.6K is now in the lower range of the timeline.
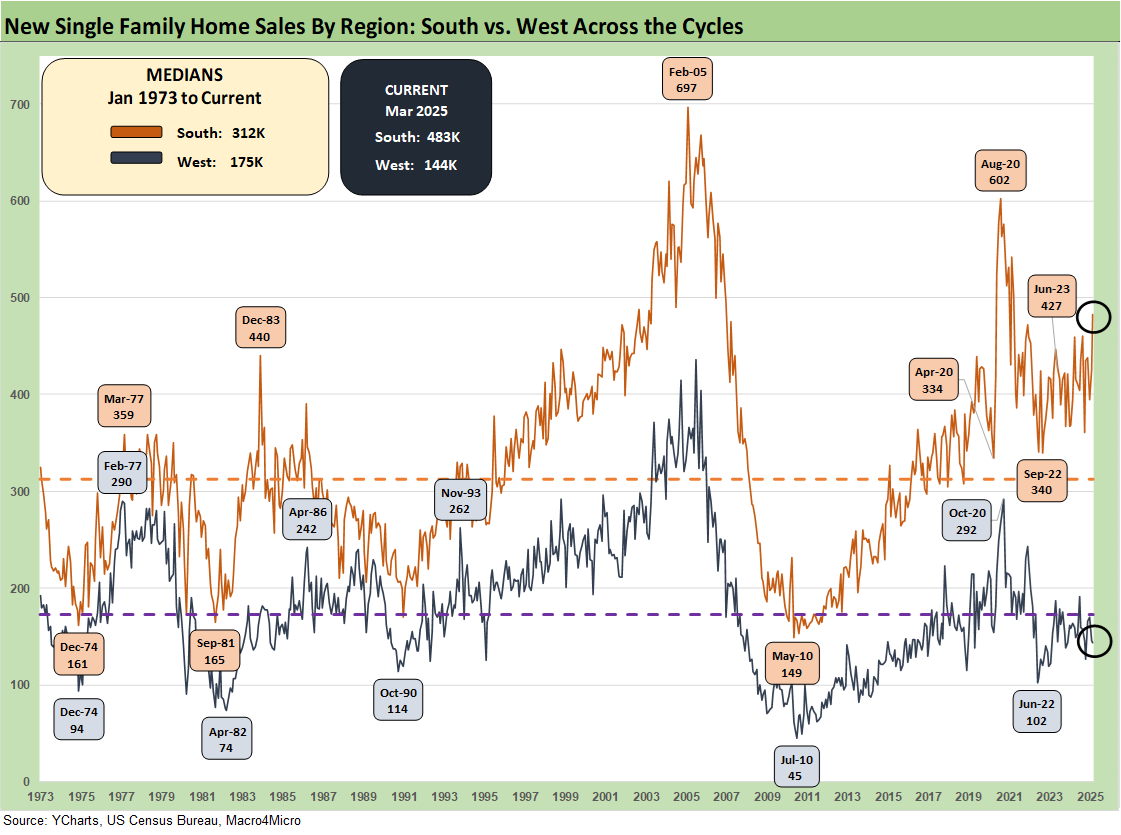
The time series above updates the new single family home sales across the cycles since 1973 for the #1 and #2 regions of the South and the West. The 483K for the South is around 67% of the total of all single family new home sales (SAAR) while the West at 144K is 20% of the total. For the month, the South was +13.6% sequentially and +22.3% YoY. The West was -1.4% sequentially and -12.2% YoY.
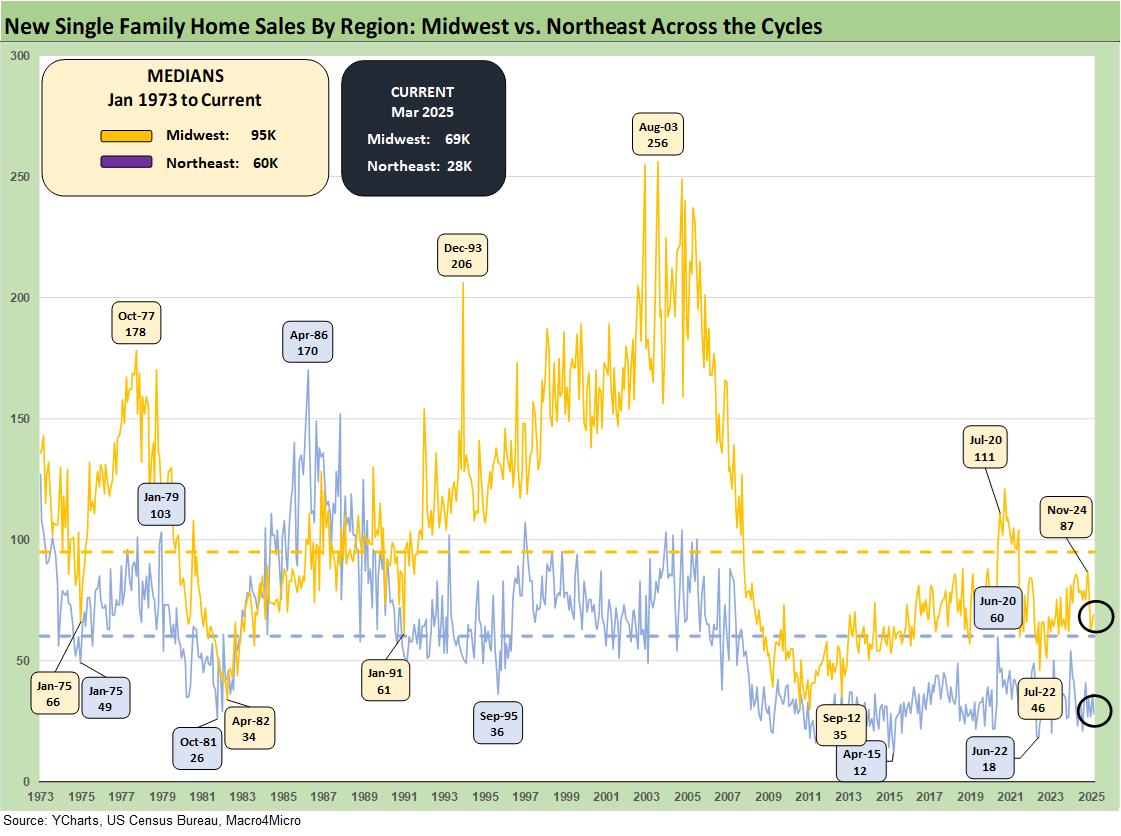
The timeline for new home sales for the smaller Midwest and much smaller Northeast market is detailed above. The Midwest (9% of total) was +3.0% sequentially and -15.9% YoY. The Northeast market (4% of total) was -22.2% sequentially and -33.3% YoY.
See also:
Footnotes & Flashbacks: Credit Markets 4-21-25
Footnotes & Flashbacks: State of Yields 4-20-25
Footnotes & Flashbacks: Asset Returns 4-20-25
Mini Market Lookback: The Powell Factor 4-19-25
Ships, Fees, Freight & Logistics Pain: More Inflation? 4-18-25
Home Starts Mar 2025: Weak Single Family Numbers 4-17-25
Credit Snapshot: Service Corp International (SCI) 4-16-25
Retail Sales Mar25: Last Hurrah? 4-16-25
Industrial Production Mar 2025: Capacity Utilization, Pregame 4-16-25
Credit Snapshot: Iron Mountain (IRM) 4-14-25
Mini Market Lookback: Trade’s Big Bang 4-12-25
Tariffs, Pauses, and Piling On: Helter Skelter 4-11-25
CPI March 2025: Fodder for Spin 4-10-25
Credit Snapshot: Avis Budget Group (CAR) 4-9-25
Payroll March 2025: Last Call for Good News? 4-4-25
Payrolls Mar 2025: Into the Weeds 4-4-25
Credit Snapshot: AutoNation (AN) 4-4-25
JOLTS Feb 2025: The Test Starts in 2Q25 4-2-25
Credit Snapshot: United Rentals (URI) 4-1-25
Housing:
Existing Homes Sales Feb 2025: Limping into Spring 3-20-25
Housing Starts Feb 2025: Solid Sequentially, Slightly Soft YoY 3-18-25
New Homes Sales Jan 2024: Homebuilders Feeling Cyclical Signals? 2-26-25
Existing Home Sales Jan 2025: Prices High, Volumes Soft, Inventory Up 2-21-25
Housing Starts Jan 2025: Getting Eerie Out There 2-19-25
New Home Sales Dec 2024: Decent Finish, Strange Year 1-28-25
Existing Home Sales Dec 2024: Another “Worst Since” Milestone 1-24-25
Housing Starts Dec 2024: Good Numbers, Multifamily Ricochet 1-17-25
Homebuilders:
Credit Snapshot: Lennar (LEN) 4-15-25
Credit Snapshot: Taylor Morrison Home Corp (TMHC) 4-2-25
KB Home 1Q25: The Consumer Theme Piles On 3-25-25
Toll Brothers 1Q25: Performing with a Net 2-20-25
Credit Crib Note: Lennar Corp (LEN) 1-30-25
D.R. Horton: #1 Homebuilder as a Sector Proxy 1-28-25
KB Home 4Q24: Strong Finish Despite Mortgage Rates 1-14-25
Toll Brothers: Rich Get Richer 12-12-24
PulteGroup 3Q24: Pushing through Rate Challenges 10-23-24
KB Home: Steady Growth, Slower Motion 9-26-24
Lennar: Bulletproof Credit Despite Margin Squeeze 9-23-24
Credit Crib Note: PulteGroup (PHM) 8-11-24
Credit Crib Note: D.R. Horton (DHI) 8-8-24
Homebuilders: Updating Equity Performance and Size Rankings 7-11-24
Credit Crib Note: KB Home 7-9-24
Lennar: Key Metrics Still Tell a Positive Macro Story 6-20-24
Credit Crib Note: NVR, Inc. 5-28-24
Toll Brothers: A Rising Tide Lifts Big Boats 5-23-24
Credit Crib Note: Taylor Morrison 5-20-24
PulteGroup: Strong Volumes, Stable Pricing 4-24-24
D.R. Horton: Ramping Up in 2024 Despite Mortgages 4-19-24
D.R. Horton: Credit Profile 4-4-23