
Credit Snapshot: Iron Mountain (IRM)
We summarize the credit fundamentals of Iron Mountain.


Credit Trends: Positive
Summary credit profile:
IRM continues to transform into a hybrid business model combining its legacy business with growth opportunities in Data Centers and an evolving mix of growth business lines such as Asset Lifecycle Management (ALM) and Digital Solutions. Growth of revenues and earnings, higher margins, rising discretionary cash flow, and lower leverage make for an objectively stronger credit profile. The low BB tier composite credit ratings across time have badly lagged the fundamental and financial reality of low IRM credit risk (see Credit Crib Note: Iron Mountain (IRM) 12-28-24, Iron Mountain 4Q24: Performance Bar Gets Raised 2-15-25). High margins, high cash flow, and exceptional asset coverage anchor the story.
Relative value:
IRM ranks in the top 10 BB names and Top 20 in HY. IRM is a solid core holding for the BBB tier buyer stepping down the credit tiers and for the HY Classic buyers seeking more resilient higher quality exposure on the way into a period of cyclical uncertainty. IRM bonds trade in line with the risks on the tighter side of the BB tier composite spreads. IRM presents a full slate of maturities from 2025 to 2033 and printed a $1.2 bn 6.25% bond due Jan 2033 in Dec 2024 that was substantially upsized from $750 mn to $1.2 bn.
The coupon menu in IRM bonds runs from 4% to 7%. That Dec 2024 deal underscores the deep IRM bond investor base that has grown in recent years since its REIT conversion and expansion into numerous growth business lines supported by the legacy cash cow records and storage business.
While currently a low BB unsecured composite rating, IRM is overdue for upgrades to the high BB tier that would add to the buyer base. The agencies have been a challenge in terms of applying consistent credit metrics on REITs, and IRM still seems to get treated by many like a HY services operation. We see the challenges in framing IRM’s “industry category” in street equity research as well as in credit research. Some of the street REIT equity analysts and street Data Center teams steer around it.
Business risk:
We consider the overall business mix risk of IRM as low, and the extraordinarily stable, high margins across a pandemic, an inflation spike, and a tightening cycle support that view (see Iron Mountain: Credit Profile 4-15-23). IRM has a major presence in a low-volume-growth legacy business with very high gross margins and exceptional free cash flow. That legacy cash machine reinvests in high margin secular growth businesses such as Data Centers, Digital Solutions, and Asset Lifecycle Management (ALM). We consider the legacy Records and Information Management (RIM) operations as lower risk even if in slow secular decline. RIM continues to offer sustained pricing power. RIM free cash flow helps fund growth capex, which is 92% of total capex. Recurring maintenance capex is low, so financial flexibility offers favorable risk symmetry. International expansion opportunities are underscored by recent JV activity in the Middle East (Qatar) where low-cost power is an advantage.
Tariffs:
As a global operation with heavy exposure to data centers and a range of tech services chains used internally and by its customer base (e.g. servers in data centers, HVAC components, etc.), IRM is affected just as the hyperscale customers have regularly cited tariff concerns that could flow into currently booming capex plans. The key for IRM is the ability to exercise pricing power. IRM also has a starting point of very high margins. IRM has less relative tariff risks than just about any other major BB tier name we watch. Having 70% handle gross margins in Storage Rental revenues and very low capex intensity in its legacy business lines helps. Pricing power has been evident in both its old and new business lines and that is a leg up on many BB tier and BBB tier investment comps.
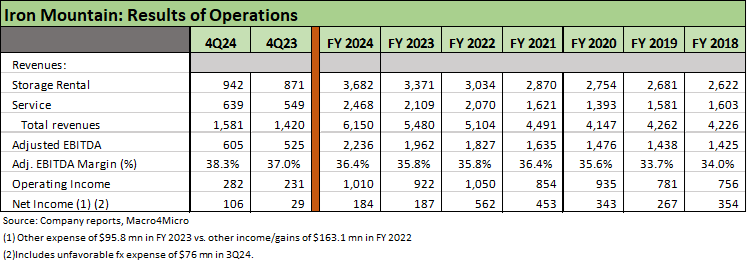
Profitability:
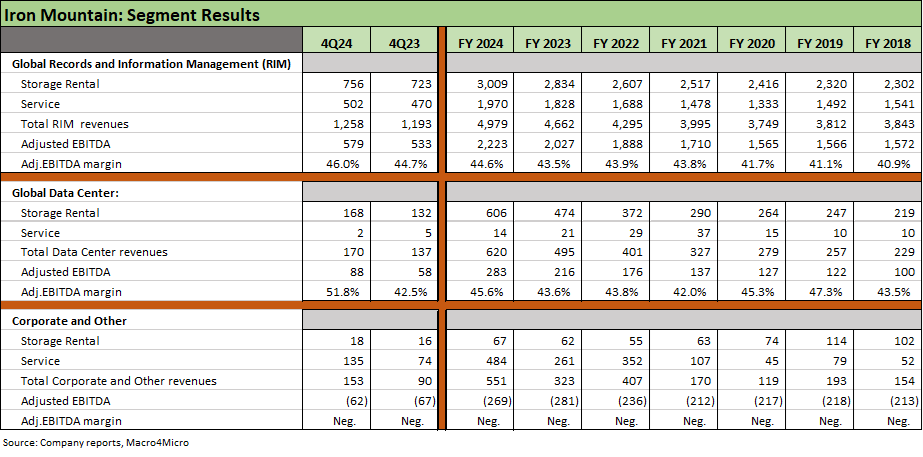
Record revenue (+12% in 2024) and record earnings (EBITDA +14%) and margin expansion in its two main segments (RIM, Data Centers) shows healthy fundamentals. Data Center revenue grew by 25% in 2024. Revenue and EBITDA posted CAGR of 11% since 2021 (13% constant currency). Organic growth in ALM was +30%. Growth capex is running at record highs while the dividend increased by 10% with 4Q24 earnings. Dividends target a low to mid 60% payout ratio. IRM is guiding to 12% EBITDA growth in 2025 after 9% revenue growth at the midpoint.
Balance sheet:
IRM grows both sides of its balance sheet as it deploys cash flow to its dividend payout and tops off cash flow with incremental debt to fund accretive growth capex plans in data centers and new business lines such as ALM. Leverage ended the year at post-REIT conversion lows at 5.0x (Net lease adjusted debt/Adj EBITDAR used in bank lines) is set against an EV/Adj EBITDA multiple of 17x down from 20x at 4Q24 as stocks and a too-hot IRM valuation weakened YTD with tech sell-offs. Net debt/Adj EBITDA of 6.0x also frames up well in that “EV vs. Leverage” context. Total debt as a % market adjusted cap was under 36% at recent pricing (4-14-25). Book leverage is distorted by the REIT conversion process. Leverage has a target range of 4.5x to 5.5x.
The array of financings in loans and bonds in the capital structure mix is wide and cuts across currencies with IRM a global player and currency risks to balance against assets and revenues. The mix includes Sterling bonds, an Aussie term loan, and multicurrency borrowing options in credit agreements that are just logical parts of the capital structure mix.
Cash flow and growth capex:
We break out the capex mix in a table below, and the easy takeaway is that capex is dominated by growth projects at over 92% of the total. Capex is a core component of the IRM growth story, and capex is dominated by Data Centers. A differentiating trait of IRM vs. the usual HY issuer is that dividends are such a massive recurring use of cash for a REIT of this scale. The extraordinary gross margins of the legacy business and related free cash flow diminish dividend risk as IRM grows its balance sheet on both sides with debt to accelerate the expansion of its asset base in high margin, growth businesses. That has shifted the valuation framework of the company and further improved the quality of the asset coverage.
SELECT CHART
Remarkably steady, high margins and organic growth via capex and pricing power.
Segments include high margin cash cows and high margin growth vehicles.
Balance sheet growing on both sides and leverage the lowest in years.

Capex history dominated by accretive growth capex at over 90% of total.

The REIT dividend demands are a constant in framing cash flow and borrowing.
