
Industrial Production Mar 2025: Capacity Utilization, Pregame
Industrial Production was solid and steady with total manufacturing, durables, and nondurables up. The real action is ahead.


Crank it up. Tariffs are coming! Time to build inventory and turn it fast.
Manufacturing and Durables saw capacity utilization rise with the major Durables industry groups doing well. While Nondurables were flat, the two industry lines rose.
One natural question to ask on the way into the uncertain arrival of even more tariffs is how much industrial activity was to preload low-cost inventory before the supplier chains got hit with tariffs and whether the “material to supplier to OEM” chain wanted to clear out what they had on the books and quickly restock.
Another question is whether the lower cost inventory facing tariffs ahead saw price increases early and often or was the focus more on inventory turnover at lower prices and then restocking quickly ahead of the coming tariff endurance contest.
The irony of inventory building is that it can prop up GDP investment lines when the economic toll of tariffs will show up later as inventory gets run down and demand weakens at higher prices. Today’s other release on manufacturing inventories comes at a lag and only covers Feb 2025. The tariff time compression has been brutal for manufacturers.
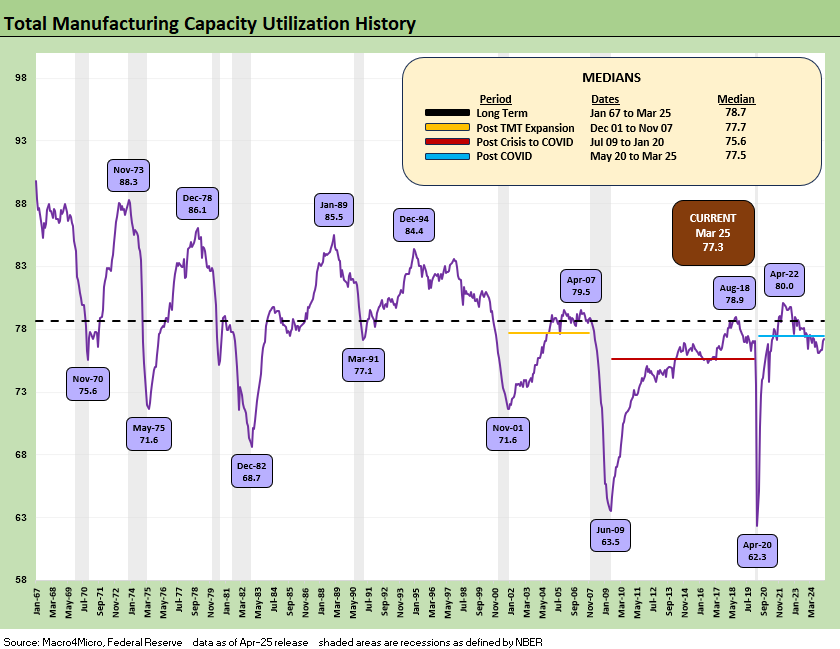
The above chart plots the long-term trend line for total manufacturing utilization. We see a slight uptick in the total sequentially as the Durables line rose and the Nondurables were flat. Gauging how different industries might have been reacting to the tariff threats that were going to kick in during April gets tricky. We can assume many were blindsided by the reciprocal tariff numbers as they rolled out and wished they had done more in March. Delivery times lag on shipping, so the prep would have needed to start earlier.
“Solving for X” is a challenge in terms of the motives behind production rate trends, but working capital management planning will get answered soon enough as the impact of current tariffs in place slowly melt into the 90-day pause effects and the next wave of Section 232 tariffs that are pending.
Whether raw materials, supplier chain output, or finished products facing tariffs now (steel, aluminum, lumber, gypsum etc.) or soon (more tariffs on copper, lumber, pharma, semis, strategic metals) with more coming after the resolution of reciprocal negotiations, there were plenty of reasons to speed up in March and carry that into April.

The above table gives the high-level buckets. We include total industry, which was down on weakness in utilities. Total manufacturing had a decent month as noted earlier with the tick higher to +77.3% from 77.1%. That is set against the long-term median of 78.7% from 1967 but slightly below the post-COVID median of 77.5%. The post-crisis to COVID median was +75.6%, so March was comfortably above that dismal period.
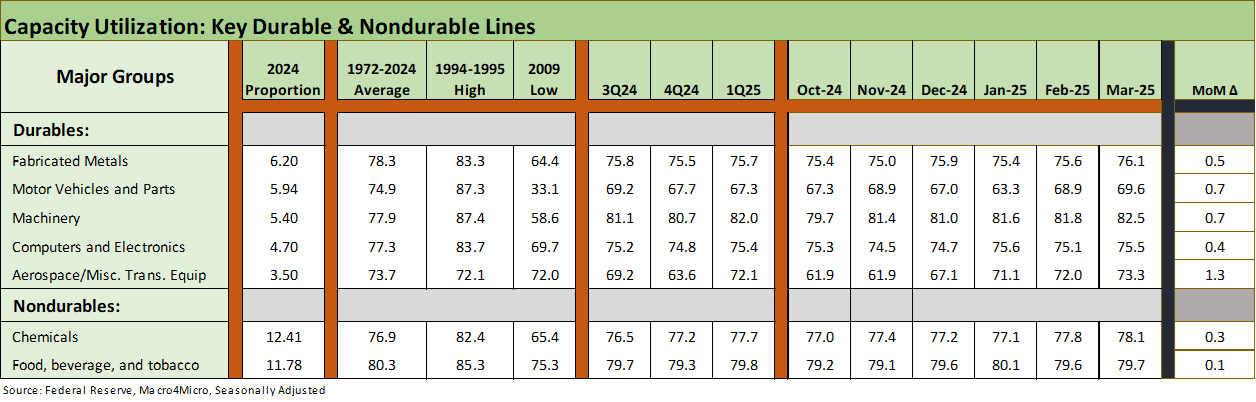
The above table details the largest industry groups we monitor each month with this release. We see all 5 Durables lines higher sequentially and both of the major Nondurables lines higher. The 7 for 7 positive would be good news in a vacuum, but the question of “Why” gets back to the Tariffs of Damocles hanging over production planning in March 2025.

The above table updates the capacity utilization history for expansions and recessions. The ability of more companies to generate solid profits at lower capacity utilization in today’s markets is tied in part to automation and in part to the development of low-cost supplier chains. Low-cost supplier chains are now fatally threatened by tariffs and many will be taken off life support.
Those supply chains had comprised the risk mitigating structural advantages of global sourcing that will be dead as of 2025. The policy architects came around to warnings of “mild disruptions” and a “little pain” but chaos has ensued as reciprocal tariffs were unveiled (see Reciprocal Tariff Math: Hocus Pocus 4-3-25, Reciprocal Tariffs: Weird Science Blows up the Lab 4-2-25). It will get worse as the effects are felt at the transaction level, more tariffs come into effect, and more retaliation actions are taken as trade partners (EU, Canada, Mexico) exhaust all hope and feel the pain.

The above chart details expansion and recession averages and lines them up by height as a frame of reference. We see the current level on the left.
See also:
Credit Snapshot: Lennar (LEN) 4-15-25
Credit Snapshot: Iron Mountain (IRM) 4-14-25
Footnotes & Flashbacks: Credit Markets 4-13-25
Footnotes & Flashbacks: State of Yields 4-13-25
Footnotes & Flashbacks: Asset Returns 4-12-25
Mini Market Lookback: Trade’s Big Bang 4-12-25
Tariffs, Pauses, and Piling On: Helter Skelter 4-11-25
CPI March 2025: Fodder for Spin 4-10-25
Credit Snapshot: Avis Budget Group (CAR) 4-9-25
Footnotes & Flashbacks: Credit Markets 4-6-25
Footnotes & Flashbacks: State of Yields 4-6-25
Footnotes & Flashbacks: Asset Returns 4-6-25
Mini Market Lookback: A Week for the History Books 4-5-25
Payroll March 2025: Last Call for Good News? 4-4-25
Payrolls Mar 2025: Into the Weeds 4-4-25
Credit Snapshot: AutoNation (AN) 4-4-25
Credit Snapshot: Taylor Morrison Home Corp (TMHC) 4-2-25
JOLTS Feb 2025: The Test Starts in 2Q25 4-2-25
Credit Snapshot: United Rentals (URI) 4-1-25
Mini Market Lookback: The Next Trade Battle Fast Approaches 3-29-25
PCE Feb 2025: Inflation, Income, Outlays 3-28-25
4Q24 GDP: The Final Cut 3-27-25
Durable Goods February 2025: Preventive Medicine? 3-26-25
New Homes Sales Feb 2025: Consumer Mood Meets Policy Roulette 3-25-25
KB Home 1Q25: The Consumer Theme Piles On 3-25-25
Lennar: Cash Flow and Balance Sheet > Gross Margins 3-24-25
Mini Market Lookback: Fed Gut Check, Tariff Reflux 3-22-25
Existing Homes Sales Feb 2025: Limping into Spring 3-20-25
Fed Action: Very Little Good News for Macro 3-19-25
Industrial Production Feb 2025: Capacity Utilization 3-18-25
Housing Starts Feb 2025: Solid Sequentially, Slightly Soft YoY 3-18-25
Retail Sales Feb 2025: Before the Storm 3-17-25
Mini Market Lookback: Self-Inflicted Vol 3-15-25
Credit Spreads: Pain Arrives, Risk Repricing 3-13-25
Tariff and Trade links:
Tariffs: Some Asian Bystanders Hit in the Crossfire 4-8-25
Tariffs: Diminished Capacity…for Trade Volume that is…4-3-25
Reciprocal Tariff Math: Hocus Pocus 4-3-25
Reciprocal Tariffs: Weird Science Blows up the Lab 4-2-25
Tariffs: Stop Hey What’s That Sound? 4-1-25
Tariffs are like a Box of Chocolates 4-1-25
Auto Tariffs: Questions to Ponder 3-28-25
Fed Gut Check, Tariff Reflux 3-22-25
Tariffs: Strange Week, Tactics Not the Point 3-15-25
Trade: Betty Ford Tariff Wing Open for Business 3-13-25
Auto Suppliers: Trade Groups have a View, Does Washington Even Ask? 3-11-25
Tariffs: Enemies List 3-6-25
Happy War on Allies Day 3-4-25
Auto Tariffs: Japan, South Korea, and Germany Exposure 2-25-25
Mini Market Lookback: Tariffs + Geopolitics + Human Nature = Risk 2-22-25
Reciprocal Tariffs: Weird Science 2-14-25
US-EU Trade: The Final Import/Export Mix 2024 2-11-25
Aluminum and Steel Tariffs: The Target is Canada 2-10-25
US-Mexico Trade: Import/Export Mix for 2024 2-10-25
Trade Exposure: US-Canada Import/Export Mix 2024 2-7-25
US Trade with the World: Import and Export Mix 2-6-25
The Trade Picture: Facts to Respect, Topics to Ponder 2-6-25