
Credit Crib Note: KB Home (KBH)
We look at the financial profile and operating fundamentals of KB Home.

Credit Profile: Stable
KBH posted improved credit quality across the post-COVID cycle and was upgraded to Ba1 and BB+ in 2024 on stronger overall metrics. The capital markets had already moved to reevaluate the relative risks of homebuilders in debt and equity across 2023 and into 2024 as evident in the trading levels in credit markets and by the banner LTM returns posted up by homebuilder equities through the spring. The equity market in 2023 and into early 2024 had recognized the resilience of the homebuilders even in the face of a monetary tightening cycle and high mortgage rates.
After spending much of 2024 with homebuilder equities ahead of even many tech benchmarks, the valuations into the summer are now more concerned about growth rates. For credit (vs. equity), a slower building cycle leads to high levels of free cash flow generation on inventory liquidation. We also see significant excess cash and inventory coverage at the largest homebuilders. The inventory liquidation cycle is the part of the equation that allows builder credit quality more of a cyclical buffer vs. sectors with high fixed costs such as manufacturing. Basically, the focal point for builders moves over to the cash flow statement from the income statement in a downturn.
We see stability in credit trends from here for KBH, but order rates and leverage improvement are lagging the broader peer group. Order growth in total (vs. by community) has stalled and the increased investment in land and development as well as stock buybacks could slow the improvement in leverage that has been seen in recent years. Community count was down as of 2Q24, but increases are planned. Total backlog value is down YoY while 3 of 4 segments saw lower segment deliveries in 2Q24 vs. 2Q23. The critical West Coast segment rose. We also saw 3 of 4 segments post lower net orders with a big jump in the Central segment for 2Q24 while total order value rose slightly.
We broke out the relative returns of the peer group of homebuilder equities in a recent Lennar report (see Lennar: Key Metrics Still Tell a Positive Macro Story 6-20-24). KBH outperformed the S&P 500 over the trailing 1-year, 3-years, 5-years, and 10-year time horizon in that update. Considering the S&P 500 had hit all-time highs frequently in 2024, that offers some bragging rights for numerous builders including KBH. That said, the builders are struggling to keep the forward-looking optimism alive into 2H24.
Operating Profile:
KBH is a smaller crossover credit relative to the main BBB tier bellwethers and with less national breadth. KBH shows a very heavy concentration in the combined West Coast and Southwest with 60% of Homebuilding (“HB”) revenues in those two geographic segments (41% West Coast, 19% Southwest). Those two regions also accounted for 62% of net order value in 2Q24. The target customer segment focus is first time buyers at 49% and 24% in first move-up buyers, so KBH is feeling the strain in those tiers of mortgage affordability and the “lock-in effect” holding back more move up transactions.
Financial Trends:
Leverage trends have shown consistent improvement since the pre-COVID period with steady free cash flow directed to buybacks. The next fixed bond maturity is 2027 while the $360 mn term loan matures in Aug 2026. The KBH $1.09 bn credit facility is unsecured and matures Feb 2027.
As detailed below, KBH has a very healthy comfort zone in its minimal credit agreement covenant package. Stock buybacks picked up pace into 2023, after no activity in 2019-2020, with $849 million in total buybacks from FY 2021 through 2Q24 with $411 mn of that in FY 2023. Stock buybacks through 1H24 of $100 were down by 40% YoY vs. 1H23.
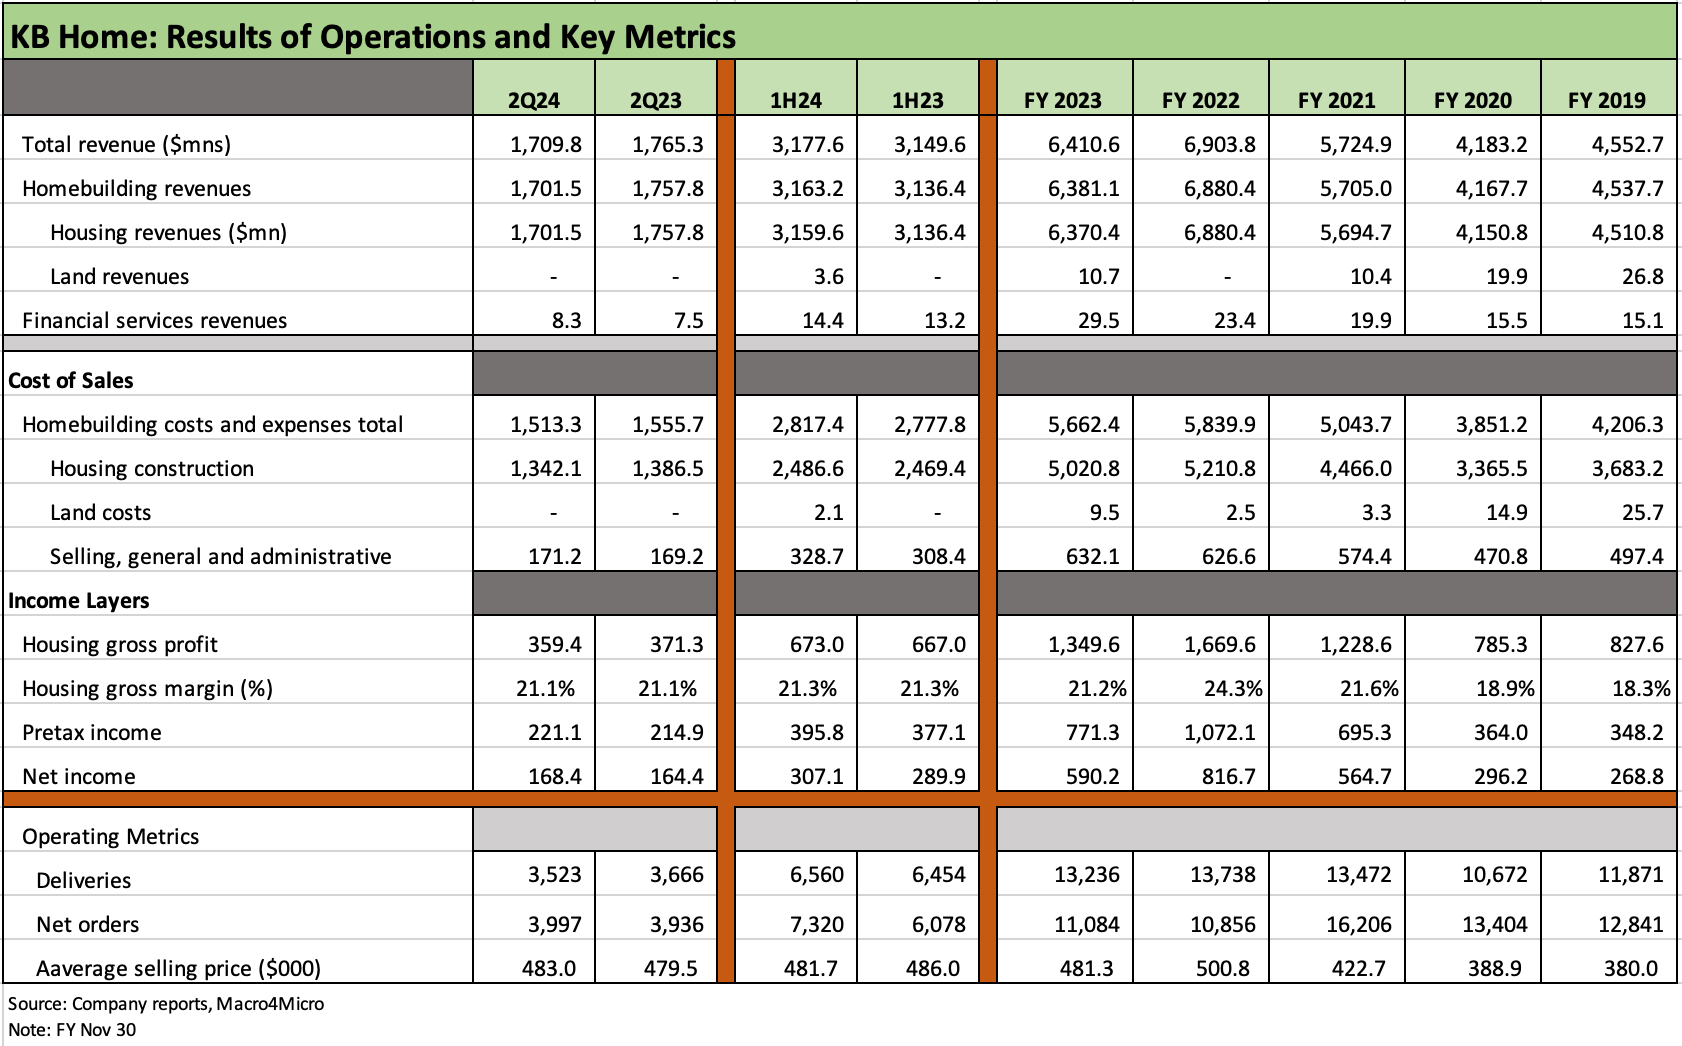
The 2024 numbers have been resilient overall for 1H24 YoY, but 2Q24 is starting to show some weakness in deliveries YoY with volumes down slightly (-4%) but prices ticking higher while SG&A expenses rose as a % Homebuilding revenues. The net effect was 2Q24 homebuilding revenues down -3.1%.
Revenue and profitability trends ran to a peak in 2022 as the built-to-order lag effect rolled into record earnings ahead of the tightening cycle.
The full effects of the tightening cycle hit YoY margin trends in the 2023 peak season with mid-20% range gross margins from 2Q22/3Q22 dropping into the low 20% range as FY 2023 saw deliveries and average selling prices (ASP) drop.
Gross margins for FY 2022 of 24.3% dropped to 21.2% in FY 2023.
The 2023 pressure was heavily tied to the sharp volume decline of almost -20% in the West Coast segment while the Southwest, Central, and Southeast segments rose. West Coast segment margins in FY 2023 slid sharply to 11.5% from 17.0% in FY 2022 with West Coast ASPs dropping from $729K to $690K in the high price West Coast market. The Southwest ASP was only $431K in FY 2023 with Central at $405K and the Southeast at $397K.
Pricing adjustments and various homebuyer concessions (notably mortgage buydowns) have been a margin headwind in the face of the mortgage rate strains on affordability and serious upward pressure on monthly payments.
During 2024, mortgage rates stayed higher than was expected to start the year, and that pressured margins on incentive costs and impacted demand on the stubborn affordability challenge.
Financial services operations saw record revenues in 2023 and rose again in 2Q24 and 1H24 given the active role played by mortgage operations across major builders in the tightening cycle.

Delivery unit volumes are detailed above, and we see 3 of 4 segments posting lower volumes in 2Q24 with only the West Coast higher. For FY 2023, 3 of 4 posted higher deliveries.
The increase in deliveries of +30.0% in the West Coast segment was the main event with Southwest down by -8.5%, Central down by -21.0%, and Southeast down by -5.6%.
The peak in West Coast deliveries was 2022 when the West Coast was over 30% of unit volumes but lower in units than Central at 31% of delivered. In terms of dollar revenues, however, the West Coast segment was 74% larger in segment revenues than Central that year on the ASP differentials.
KBH is calling for growth in FY 2024 in community count. The order risk and delivery schedules are expected to be more predictable as built-to-order grows again in the mix (around 60% of orders in 2Q24) and in part on expectation of an improved rate environment (that may not be as certain as hoped for in 30Y mortgages).
The deliveries count in FY 2023 was over 11% above 2019 levels and 24% above the trough of 2020 but still modestly below the 2021-2022 levels.
Looking ahead on “volume risk” involves a range of factors from land spend (recently rising), cycle times (improving), supplier chains (normalizing), and community counts, which are expected to rise in 3Q24 and likely to rise in 4Q24 per management.
Average community count in 2Q24 had declined by 4% YoY but is expected to be up by mid-to-high single digits in 3Q24 and higher overall in 2H24.

We see mixed trends in ASPs by segment in the table above. While KBH only operates in 9 states, those translate into 47 markets in states that include 3 with economies ranked among the largest nations in the world based on GDP (CA, TX, FL).
Pricing trends across the geographic segments tell the same old story about how incredibly expensive the West Coast market is relative to a range of other markets and notably the Central segment, which for KBH means a heavy mix in Texas but also Colorado. The West coast segment includes California, Washington, and Idaho. The Southwest is Arizona and Nevada. The Southeast is Florida and North Carolina.
Total ASPs peaked in 2022 on the high prices and peak volumes in the West Coast, so ASPs can be heavily wagged by regional mix by state and community count price tier.
KBH indicated that 50% of its deliveries in 2Q24 were to first-time homebuyers, which is one factor to frame in the relative ASP trends along with regional variances.
As of the 2Q24 release, KBH was projecting ASPs for the full fiscal year 2024 in the range of $485K to $495K.

The above chart looks back across the segment results and frames segment revenue, operating income, and operating margin. The FY 2022 total profitability peak saw the operating margin highs and all 4 segments saw peak FY segment profits that year.
The West Coast revenue peak took place in 2022 while the other 3 segments saw revenue peaks in 2023 but at lower margins.
For 2Q24, we see geographic segment margins notably higher in the West Coast segment, slightly higher in the Southwest, and lower in Central and Southeast.
The highest margins are in the Southwest at over 17% in 2Q24 and1H24 followed by the closely grouped other segments in the 12% area.
The West posted higher volumes and lower prices for 2Q24 and 1H24.
The Southwest posted lower volumes but higher prices in 2Q24 while both volume and price increased in 1H24.
Central posted much weaker revenues and earnings in 2Q24 and 1H24 on lower volumes and lower prices but segment operating margins remain in double digits.
Rounding out the mix was the Southeast with lower revenue and earnings in 2Q24 on lower deliveries and higher prices. For 1H24, Southeast revenues rose on higher deliveries and higher prices but segment operating income declined slightly along with margins.
The diverse range of results in the homebuilding geographic segments across revenue, volumes, prices, and margins offers a reminder that there are timing differences in community supply, product tiers, development cycles, and even weather (or fire) events that favor the larger more diversified national builders for overall business risk.
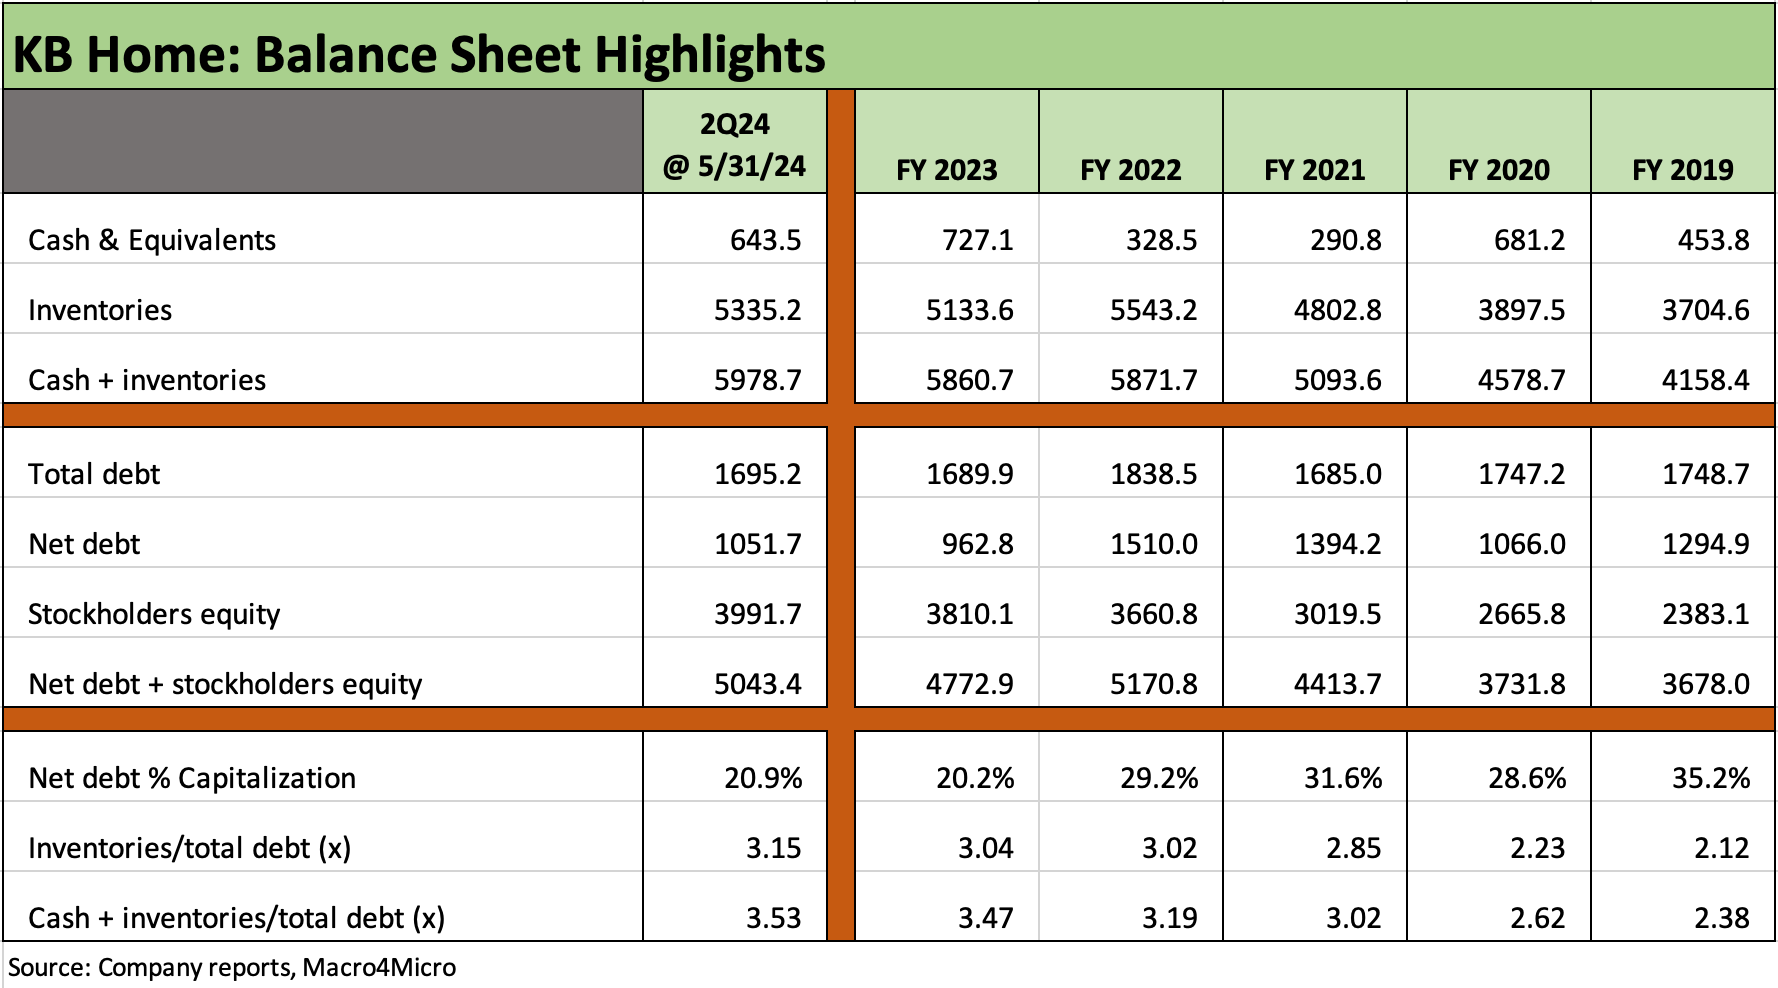
The trend line for leverage at KBH has been favorable. Net debt at $1.05 bn ticked higher at 2Q24 from the end of 2023 while total debt at just under $1.7 bn is down from the $1.84 bn of FY 2022. Net debt is now comfortably below the $1.5 bn of year end 2022 but above FY 2023.
The credit agreement is an unsecured $1.09 bn credit facility that matures in Feb 2027. At 2Q24, it had no cash borrowings and only $8.3 mn in LOCs against the facility. The credit line had $1.08 billion available for cash borrowings at 2Q24.
Cash + Inventory coverage of 3.5x homebuilding debt frames up well vs. the pre-COVID level of 2.4x at the end of 2019 and above the 2020 to 2022 levels and slightly above FY 2023. KBH’s recent market cap of $5.0 bn is ~1.25x book (using 7-9-24 market cap)
The capital structure shows potential refinancing needs (including redemption options) in 2025, 2026, and 2027 in bonds and term loans. The capital structure includes an unsecured term loan ($359 mn) due Aug 2026 and 4 bonds.
The 4 bonds in the stack include two low coupon bonds ($300 mn 4.8% due 11-15-29, $390 mn 4.0% due 6-15-31) and two high coupon bonds ($300 mn 6.875% due 6-15-27, $350 mn 7.25% due 7-15-30). The 7.25% bonds are callable in 2025 while the 6 7/8s have make-whole protection with both trading above par (7-8-24).
As we typically see with homebuilders, the KBH credit facility has a book value leverage test (60% max as defined) paired with an interest coverage covenant (1.5x min). As of the most recent 10-Q filing (2Q24), actual leverage as defined was 30.2% and interest coverage 11.25x.
Total debt to book value cap at 2Q24 was 29.8% and 20.9% net debt to cap. Net debt to market adjusted capitalization was 17.3% (7-9-24 pricing) and total debt to market adjusted capitalization was 25.3%.
The dividend yield on KBH was 1.5% at recent close (7-8-24) with cash dividends at an annualized run rate of ~$70 million based on 1H24 cash dividend payouts.
See also:
New Home Sales: Pumping the Brakes 6-26-24
Existing Home Sales May 2024: Weary Climb 6-21-24
Housing Starts May 2024: Starts vs. Deliveries Balancing Act 6-20-24
Lennar: Key Metrics Still Tell a Positive Macro Story 6-20-24
Credit Crib Note: NVR, Inc. 5-28-24
New Home Sales April 2024: Spring Not Springing Enough 5-23-24
Toll Brothers: A Rising Tide Lifts Big Boats 5-23-24
Credit Crib Note: Taylor Morrison 5-20-24