
New Home Sales Dec 2024: Decent Finish, Strange Year
We look at New Home Sales in a year where builders held an edge in share of total home sales.


Wanted: More Supply, More Entry Level, and More Affordable
The Dec 2024 and full year 2024 numbers were at least higher YoY and MoM with “homes for sale” also higher, so that is a favorable variance for the homebuilders.
Completed homes for sale are higher in Dec and at a high for the year, and that means incentives and prices will be pressured as we have seen in numerous homebuilder earnings commentaries.
Supply and demand imbalances tell a mixed story by price tier but the builders still have the edge given the headwinds facing the existing home sale markets (see Existing Home Sales Dec 2024: Another “Worst Since” Milestone 1-24-25).
The 2025 spring selling season promises to have more aggressive incentives and pricing unless the mortgage rate backdrop eases lower.
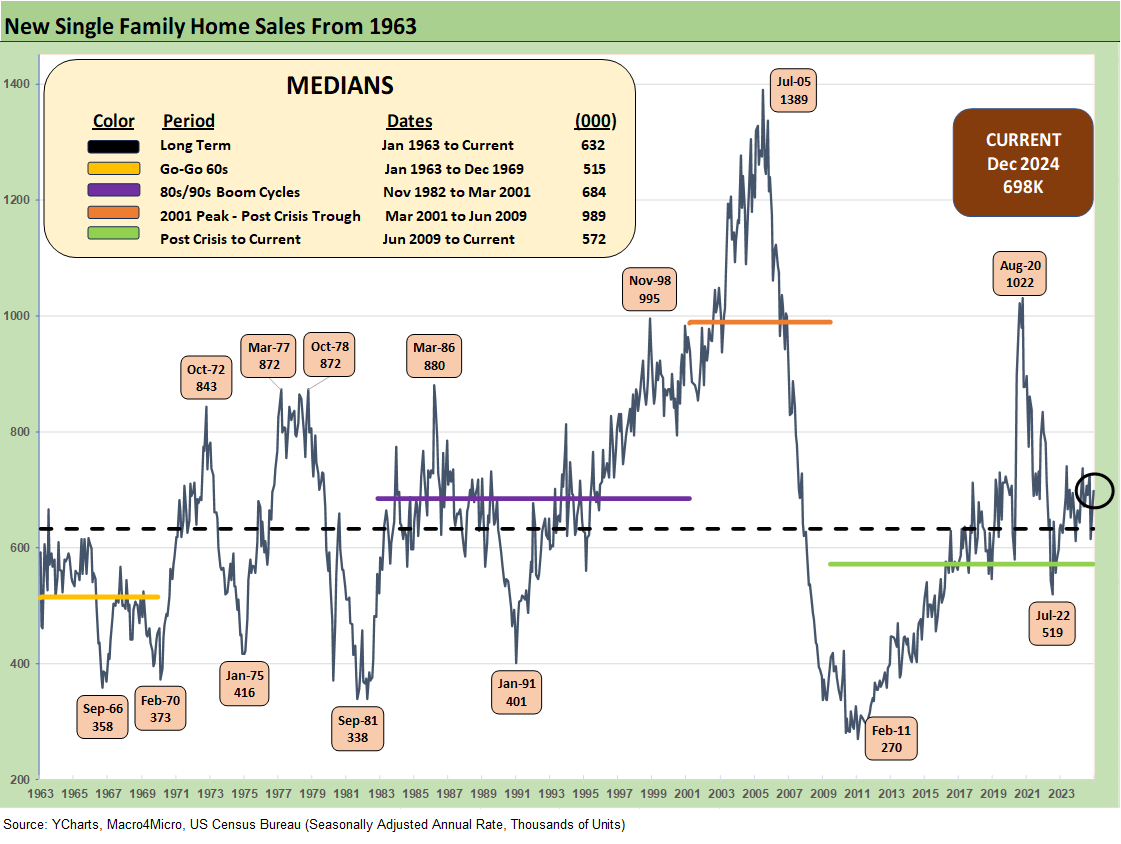
The above chart updates new single family home sales for Dec 2024 as the year ends with a +3.6% sequential increase and +6.7% YoY increase on a SAAR basis. The 698K SAAR on the month is ahead of the long-term median of 632K and ahead of all but one of the timeline medians detailed in the box above.
The housing bubble build rates (peaked in 2005) show a median of +989K from the March 2001 to June 2009 cycle. The July 2005 peak was 1389K as the market was heading to an ugly finish by 2007. The bottom tick on new home sales was 270K in Feb 2011. That was grim.
If we look at Not Seasonally Adjusted (NSA) numbers, the YTD 683K in 2024 was +2.5% vs. 2023 NSA totals of +666K.

The above chart updates the share of total home sales captured by new homes given the constraints on existing home sales. Existing totals always dominate the total home sales number but have been reeled in this cycle on the “golden handcuff” challenge with so many sub-3% and sub-4% mortgages in a market where high 6% and low 7% are on the other side of a home sale when the buyer looks to move up or downsize. That means monthly payment pressures.
We have been discussing the “locked in” challenge every month in our existing home sales commentaries (see Existing Home Sales Dec 2024: Another “Worst Since” Milestone 1-24-25). For Dec 2024, new home sales captured 14.1% of total home sales vs. the long-term median of 11.3%.

The above timeline updates the median new home sales price that has now reached $427K, up sequentially from $402.5K and YoY from $418.8K. The product tiers and geographic mix changes are big asterisks on such month-to-month price medians, but the 300K handles of 2020-2021 seem like a long time ago. On an NSA basis, the 2024 annual median of $420.1K was down from the 2023 median of $428.6K.

The above chart updates the NSA median prices from just before the end of ZIRP and ensuing tightening cycle. The prices are over $400K across the board.

The above time series updates the new single family home sales across the cycles since 1973 for the #1 and #2 regions of the South and the West. The 423K for the South is over 60% of the total of all single family new home sales (SAAR) while the West at 154K is over 22% of the total. For the month, the South was -2.1% sequentially and +0.5% YoY. The West was +1.2% sequentially and +10.0% YoY.
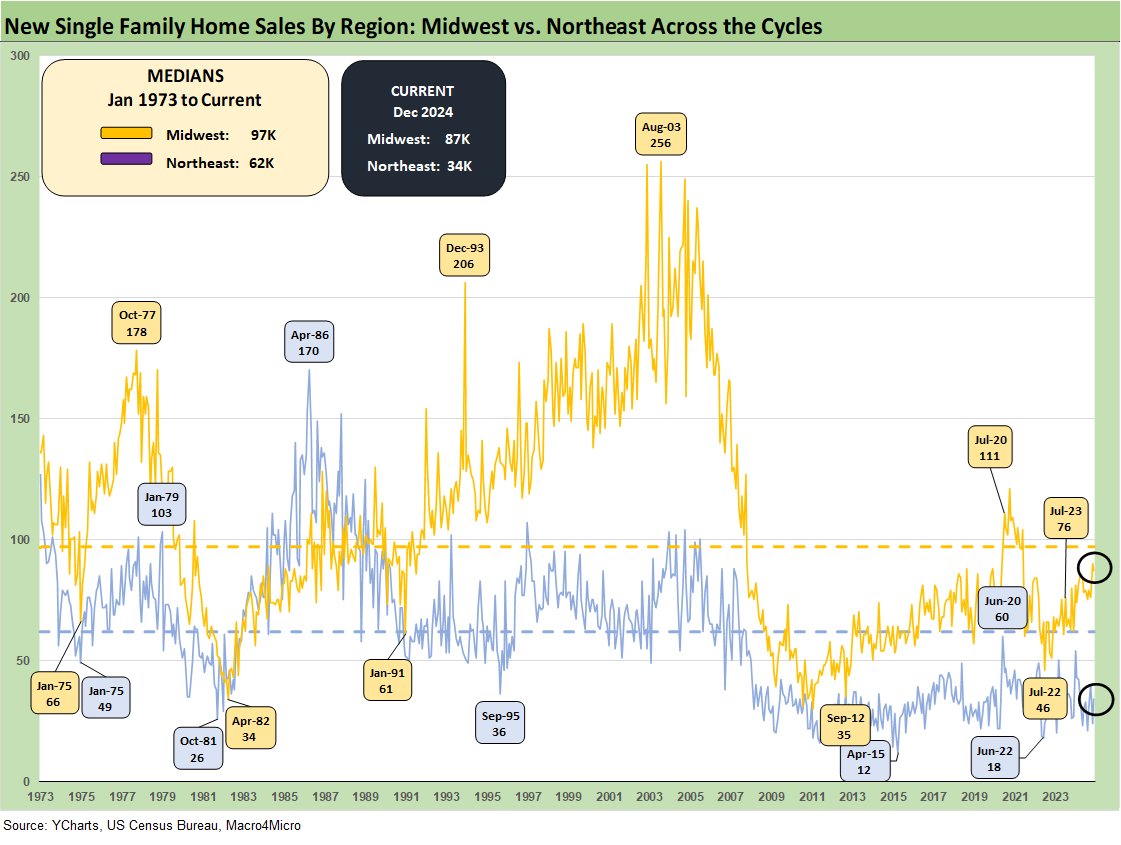
The timeline of new home sales for the smaller Midwest and much smaller Northeast market is detailed above. On a SAAR basis, the Midwest (13% of total) was -3.3% sequentially and +40.3% YoY. The Northeast market (5% of total) was +41.7% higher sequentially and +25.9% YoY. We highlight that NSA numbers are not so distorted for the Midwest and Northeast regions.
See also:
Footnotes & Flashbacks: Credit Markets 1-20-25
Top 10 Fun Facts on Past Presidents and their Economies 1-20-25
Footnotes & Flashbacks: State of Yields 1-19-25
Footnotes & Flashbacks: Asset Returns 1-19-25
Mini Market Lookback: The Upside of Volatility 1-18-25
Industrial Production Dec 2024: Capacity Utilization 1-17-25
Retail Sales Dec 2024: A Steady Finish 1-16-25
CPI Dec 2024: Mixed = Relief These Days 1-15-25
Housing:
Existing Home Sales Dec 2024: Another “Worst Since” Milestone 1-24-25
Housing Starts Dec 2024: Good Numbers, Multifamily Ricochet 1-17-25
New Home Sales: Thanksgiving Delivered, What About Christmas? 12-23-24
Homebuilders:
KB Home 4Q24: Strong Finish Despite Mortgage Rates 1-14-25
Toll Brothers: Rich Get Richer 12-12-24
PulteGroup 3Q24: Pushing through Rate Challenges 10-23-24
KB Home: Steady Growth, Slower Motion 9-26-24
Lennar: Bulletproof Credit Despite Margin Squeeze 9-23-24
Credit Crib Note: PulteGroup (PHM) 8-11-24
Credit Crib Note: D.R. Horton (DHI) 8-8-24
Homebuilders: Updating Equity Performance and Size Rankings 7-11-24
Credit Crib Note: KB Home 7-9-24
Lennar: Key Metrics Still Tell a Positive Macro Story 6-20-24
Credit Crib Note: NVR, Inc. 5-28-24
Toll Brothers: A Rising Tide Lifts Big Boats 5-23-24
Credit Crib Note: Taylor Morrison 5-20-24