
Toll Brothers 1Q25: Performing with a Net
A slight margin fade rattles the equity markets, but Toll is still a credit rock (or a gold bar).


Uncle Jed, you should call Toll Brothers!
The 1Q25 Toll Brothers numbers were mixed by Toll standards and the stock market certainly did not like it, but 26.9% adjusted gross margins (25.0% before adjustments) and double digit increases in new contract value (+13.0%) and new contracted home unit volumes (+12.0%) is something any homebuilder would like to see.
Addjusted gross margins of 26.9%, down from 28.9% in 1Q24, underscores the ability of Toll to navigate a market that will only get more unpredictable subject to the tariff and deportation question marks and how that flows into subcontractor costs and notably materials and labor (see Housing Starts Jan 2025: Getting Eerie Out There 2-19-25).
With a distinctive customer base and luxury brand, Toll operates in a narrower, lucrative space that saw 26.0% of its homebuyers paying all-cash and an average price in backlog over $1 million.
Toll has low LTV buyers and cancellation rates were under 6.0% in 1Q25, down from 8.6% in 1Q24. The distinctive Toll profile makes owning Toll part of a diversification strategy in homebuilder exposure for stocks or bonds.
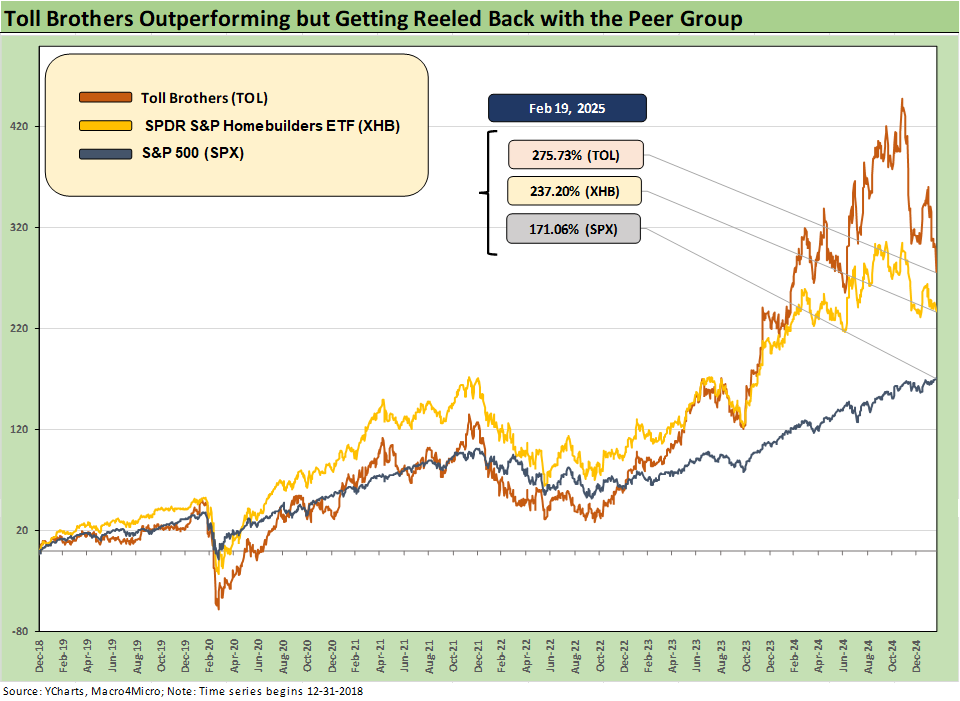
This week’s Toll Brothers earnings drove a TOL stock sell-off with Toll finishing the post-earnings trading day off by -5.9% after being down almost -8.0% earlier in the day. The battle of valuations in builders came down to Toll being a regular outperformer and thus more vulnerable on earnings day (January 1Q25).
That earnings report came alongside weak starts numbers for the industry with the largest builders generally seeing builder stocks down in the -1.0% area. As we cover further below, that still leaves Toll at the head of the builder pack for the past 1-year timeline.
The second worst performer of the largest players on the day was D.R. Horton (DHI) at -3.0%. DHI is at the other end of the average price scale and is more national and multi-tiered in scope. Pulte (PHM) cleared the day with the best numbers of the largest players at -0.7%. We have links at the bottom of this commentary that covers some of these single names. Toll and Pulte routinely weigh in with superior margins.
Toll is typically an outlier based on its luxury franchise and a customer that often defies cyclical trends and consumer confidence indicators. Toll’s customer segments are not the buyers who get squeezed out of the market even if some might opt for a move down the price tiers into the “affordable luxury” product offerings. Toll benefits from the nature of its buyer base that includes a strong mix of move-up buyers with major embedded home equity gains. There is also a significant empty nester base of buyers as “Chip” and “Missy” take their postgraduate diplomas and head off to be potential first time Toll buyers.
As we highlight above and in earlier commentaries (see Toll Brothers: Rich Get Richer 12-12-24), Toll has stayed near the top of the pack in stock performance and has been ahead of the S&P 500 along the timeline detailed above. The recent sell-off has hit builders hard after they tipping the scale in running total returns into 3Q24. That was before the mortgage spike and sharp homebuilder sell-off that followed. The lofty valuations have been called into question and have been hit hard over the rolling 3-months as we detail in the next table.

The above chart adds more equity comps for Toll. We line up the homebuilders and benchmark frames of reference in descending order of 1-year total returns. Toll weighs in at #1 among builders for 1-year, edging out Taylor Morrison Homes (see Credit Crib Note: Taylor Morrison 5-20-24). We see a nasty lashing of Toll over 3 months at -24%, but it leads the pack for 1-year at +13%. Toll is up by an impressive +104% over 2 years.
For two years, that return on TOL was just short of 2x the S&P 500. Those two years were the best back-to-back performance for the S&P 500 since the late 1990s, so the TOL numbers were special. The broader Homebuilding ETF (XHB) includes a number of major suppliers (vs. builders) in the top 10 holdings, and XHB has outperformed most of the builders the past year – but not TOL or TMHC.
The table covers more timelines for cyclical perspective across a set of markets that included a pandemic, an inflation spike, and a tightening cycle that has since flowed into a series of FOMC easing actions in late 2024. That 5-year time horizon is an interesting one given the mix of economic events. After all, the market had not seen an inflation fighting cycle in over 4 decades and had not experienced a pandemic for over a century.

We like Toll Brothers as a credit for multiple reasons and the rationale for credit stability is linked to the income statement, the balance sheet and the cash flow dynamics of the top builders generally. We see the steady and solid mid-20% range gross margins that are well above the 2019-2021 levels. Margins are narrowing slightly this year and could narrow some more as the year goes on. For now, at 27%, gross margins are guided to remain well above those earlier years of 2019-2021. The lingering threat will be tariffs and cost pressures.
Record revenues is not a bad starting place for getting comfortable with Toll, and those are very healthy gross margins in industry context. Guidance calls for sustained volume growth with a midrange estimate of +5% on deliveries and 27% handle margins for the year. The price range guidance for the full year midpoint of around $955K is higher than 1Q25 but slightly below the average of FY 2024. The geographic mix will be the key factor for average price.
This profitability history, taken in tandem with the balance sheet metrics and asset coverage evident in the balance sheet section further below, makes a strong case for higher Toll Brothers credit ratings. The legacy of the rating agencies and their failure to appreciate the nature of the housing bubble home price collapse has somehow led to the rating agencies penalizing the homebuilders. The artificially low credit ratings seem to be a function of the perceived business risk “x factor” and thus the required financial metrics for a given rating.
Looking back across time, the homebuilders fared better than the banks and mortgage lenders (and the rating agencies) when the smoke cleared. The builders clearly demonstrated their ability to stabilize their finances and execute their liability management programs while using their collateral creatively to support liquidity.
The reality of BBB tier industrial names and comparative risk is that homebuilders demonstrate more resilience in the event of a downturn as they generate cash from inventory liquidation. The homebuilders are more variable cost based. The secular demand symmetry is favorable for builders, and that also goes in the positive column.
The scenario that hurts all cyclical industries would be stagflation with high interest rates and high unemployment (think 1974 to 1982). Even then, that risk needs to be put in multi-industry portfolio context and still requires a relative value call. There would be a lot more IG industrials in freefall at that point while homebuilders have shown they have a bigger bag of tricks to support liquidity and mitigate refinancing risks.
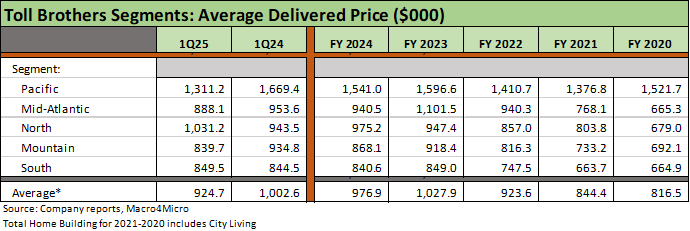
Half the fun of looking at Toll results is to see which regions crack the $1 million average price per unit (deliveries) and what their average price in backlog looks like. We see $1.3 million for the Pacific segment (CA, OR, WA) and $1.0 million for the North segment (MI, PA, IL, CT, DE, NY, NJ, MA).
The overall price decline in FY 2024 is in part a function of Toll broadening out its regional mix and the tiers of its luxury offerings. The term “affordable luxury” might roll some eyes, but in the high-priced Toll mix it is relevant.
The activity in Toll deliveries is characterized by high down payments, lower LTVs (68%), and 26% of customers paying all cash. There is a heavy mix of move-up buyers and “empty nesters” in the mix. Interestingly, Toll stated that 25% to 30% of buyers are first time buyers as more customers wait until later in life and make a big-ticket purchase. Average incentives in 2024 were around $55K. Set against the price of Toll home prices and gross margins, that is not a major cost.
Toll sold 55% of its volumes from spec homes in 1Q25, but the spec sales have the twist of some design studio upgrades that add margin. Toll is targeting 10% community growth in 2025, so the expectation remains for favorable volume variances in the year as they noted in guidance (10/31 fiscal year).

The above chart frames the segment revenue and underscores the growth since 2020 across the South, the Mid-Atlantic, and Mountain regions. The Pacific and North have been steady.
Toll indicated that their Southern California market remains strong despite fires and indicated that Maryland and North Virginia remain strong despite the DOGE chaos. The typical Toll buyer is not the typical Federal employee (more like a lobbyist). The backlog price for the Mid-Atlantic region is over $1.0 million and in the Pacific is over $1.6 million.

The above balance sheet of Toll remains strong in the context of asset coverage with Cash + Inventory totaling 4.1x total homebuilding debt. The net debt to book cap of 21.1% is high relative to the Big Two of the industry with D.R. Horton (see D.R. Horton: #1 Homebuilder as a Sector Proxy 1-28-25) and Lennar (Credit Crib Note: Lennar Corp (LEN) 1-30-25) boasting much more balance sheet liquidity. Those names should be in the single A tier.
Within the top 5 builders, the other names such as NVR and Pulte are more single A tier risks as well. As noted earlier, the rating agencies just have not kept up with the favorably shifting business risk and financial profiles of the homebuilders. The homebuilders now operate with more asset-lite strategies and a heavy use of options and purchase contracts that limit their exposure to asset corrections.
For some companies, the gap between the credit ratings and the financial metrics are glaring. The balance sheet of NVR is other worldly (see Credit Crib Note: NVR, Inc. (NVR) ) and Pulte’s high margins and net debt metrics are hard to find even with many single A cyclicals (see Credit Crib Note: PulteGroup (PHM) 8-11-24). Those 4 names (DHI, NVR, PHM, LEN) in the top 5 are stronger credits than Toll Brothers, but the unique strength of the Toll Brothers franchise and consistent performance is a major positive factor they cannot match.
See also:
Housing Starts Jan 2025: Getting Eerie Out There 2-19-25
UST Yields: Sept 2024 UST in Historical Context 2-17-25
Footnotes & Flashbacks: State of Yields 2-16-25
New Home Sales Dec 2024: Decent Finish, Strange Year 1-28-25
Existing Home Sales Dec 2024: Another “Worst Since” Milestone 1-24-25
Housing Starts Dec 2024: Good Numbers, Multifamily Ricochet 1-17-25
Homebuilders:
Credit Crib Note: Lennar Corp (LEN) 1-30-25
D.R. Horton: #1 Homebuilder as a Sector Proxy 1-28-25
KB Home 4Q24: Strong Finish Despite Mortgage Rates 1-14-25
Toll Brothers: Rich Get Richer 12-12-24
PulteGroup 3Q24: Pushing through Rate Challenges 10-23-24
KB Home: Steady Growth, Slower Motion 9-26-24
Lennar: Bulletproof Credit Despite Margin Squeeze 9-23-24
Credit Crib Note: PulteGroup (PHM) 8-11-24
Credit Crib Note: D.R. Horton (DHI) 8-8-24
Homebuilders: Updating Equity Performance and Size Rankings 7-11-24
Credit Crib Note: KB Home 7-9-24
Lennar: Key Metrics Still Tell a Positive Macro Story 6-20-24
Credit Crib Note: NVR, Inc. 5-28-24
Toll Brothers: A Rising Tide Lifts Big Boats 5-23-24
Credit Crib Note: Taylor Morrison 5-20-24
PulteGroup: Strong Volumes, Stable Pricing 4-24-24
D.R. Horton: Ramping Up in 2024 Despite Mortgages 4-19-24
D.R. Horton: Credit Profile 4-4-23