
Lennar: Bulletproof Credit Despite Margin Squeeze
We look at LEN 3Q24 results as the bellwether #2 homebuilder’s cash still exceeds its debt and a spin-off is still cooking at the SEC.


Lennar numbers show some gross margin pressure as the wear and tear of high rates still was a margin headwind, but the major builders keep on pushing right through and gear up for better days on mortgage rates.
In terms of financial health and impressive cash flow fundamentals, LEN still boasts cash in excess of debt even after materially increasing stock buybacks to over $1.7 billion YTD 2024 or double the rate of YTD 2023. That is on top of a 1/3 hike in the dividend in 2024.
LEN’s focus on driving cash flow and shifting to a land-light homebuilder model focusing on delivery volumes and a balanced sales and starts pace while driving impressive cash flows ahead of what could be more mortgage relief in 2025.
Among the more important variables for LEN balance sheet structure in weeks/months to come will be the Millrose REIT creation on the way to a spin-off and questions around how the cash or inventory component of the deal will work. Debt reduction remains a priority ahead of that deal.

LEN stock sold off by -5.3% on Friday after the YoY decline in home sales gross margins from 24.4% to a still-solid 22.5%. LEN’s stock recovered in part today. That comes after a very heady run in the stock for LEN as well as the builders in 2024 (see Footnotes & Flashbacks: Asset Returns 9-22-24). As we detail above in the timeline since the start of the tightening cycle, LEN is ahead of the builder peer group ETF (XHB) and Equal Weight S&P 500 (RSP).
Lennar has been very consistent in its messaging of focusing on volume and inventory turnover, and the results are evident in the pace of cash flow generation and higher level of capital deployed to stock buybacks and dividends in 2024. The financial risk of Lennar is quite low and deserves higher than BBB ratings but the end game on the balance sheet structure still needs some answers in the home stretch of the shift to an asset-light profile.
We look at some of those issues below, but the shareholder rewards in 2024 and the rock solid, highly liquid balance sheet give LEN a lot of room to maneuver as it works through its plan on its Millrose REIT spin-off. LEN offered very few details given SEC review. The big questions will be “How much land goes with it?” and “How big will the cash component be in the transaction?”
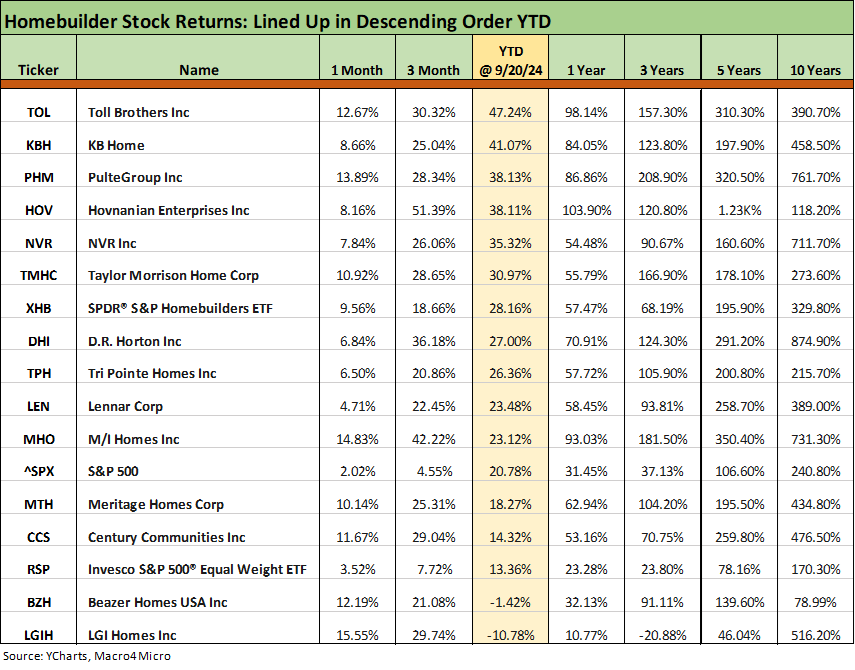
The above chart runs across multiple time horizons for the stock returns in the major public homebuilder group we track, and the relative performance of the builders vs. benchmarks is impressive as we regularly cover in our weekly Footnotes publications. We line them up in descending order of YTD total returns, and LEN only ranks at #9 among the 14 individual builders on the list. LEN frames up better over the 5 years starting back before COVID.
Mortgage rates are declining and slowing inflation supports FOMC action as the Fed toggles to focus more on payroll risks. Meanwhile, homebuilder equities have been winners in 2024 even as we saw turbulence in the yield curve in the 10Y area that drives 30Y mortgages.
For companies such as LEN, the strain on existing sales keeps inventory tight and supports home prices for builders as new homes pick up market share. On the other hand, the “locked-in effect” and “golden handcuffs” backdrop slow the ability of existing homeowners to execute on new home move up transactions into higher price point homes.

The above chart looks at LEN results of operations. The revenue line can be looked at in a simple way as a price x volume story with deliveries materially higher in 3Q24 and YTD and prices modestly weaker.
LEN reported softer gross margins than expected, so that perhaps spooked the market. Our experience going back years tells us that many equity watchers tend to fixate too much on gross margins, which narrowed to 22.5% from 24.4% in 3Q24. The focus on LEN’s margins can sometimes come at the expense of giving credit to LEN’s impressive cash flow and working capital execution. Even if that is more a “credit thing,” LEN has rewarded shareholders in buyback growth and dividend increases.
There is always more to the story given how business models in homebuilding have changed the importance of working capital management, inventory turnover, and relative land intensity (development vs. working with third party developers and active use of options). LEN is not alone among the major builders in allocating capital more generously across buybacks and dividends. The SG&A levels set against revenue and their influence on the bottom line gets ample focus also on earnings calls.

The volumes are broken out above with deliveries up in all 4 major building operating regions. For 3Q24, deliveries were up by 16% overall with Texas over 23% and Central +22% as part of a YTD increase of almost 18% in deliveries. New home starts in the quarter were up by 8% with new orders up by almost 5%.
LEN is forecasting +10% deliveries for FY 2024. Overall, these are very good volumes considering the backdrop for mortgage rates YTD. The community count is growing along with orders although order rates are slowing down at +5% in 3Q24.
LEN has been migrating to a land-light strategy where it takes delivery of homesites fully developed and just-in-time, The success of the LEN strategy is reflected in deliveries. LEN cites how its 5-year effort starting in 2020 to shift to a land-light model has taken inventory turns from under 1.0x to 1.6x now and up from 1.4x last year. This is a critical factor in cash flow generation.

The above chart gives a broad geographic view of how LEN homebuilder prices have trended across regions. The declines in ASPs are consistent with a company looking to drive volumes and higher turnover. We see every geographic segment posting lower ASPs even if the West can be flagged as a YoY tossup YTD and down only slightly for 3Q24 YoY.
LEN looks to keep production pace in line with sales, and the formula has worked very well for cash flow and efficiency. The idea that a builder will give on price or margin to sustain that model is another reason not to become overly fixated on gross margins. Their approach has worked well.
LEN gives a lot of time in their earnings call to detail how they have developed this program with private equity partners to generate a steady supply of fully developed homesites. With the Millrose project underway for a REIT spin-off, shareholders will again get a reward.

The balance sheet story is not very complicated for holders of a highly profitable homebuilder ranking #2 in the industry in size ($49.5 bn market cap vs. $62 bn for D.R. Horton). Cash exceeds homebuilding debt, and the company is a massive cash flow generator allowing for a doubling of buybacks at over $1.7 bn YTD and expectation for FY 2024 of buybacks in excess of $2 bn. LEN also delivered a 1/3 hike in the dividend rate for 2024 at a current annualized payout rate in excess of $540 million.
We see the homebuilding total debt line at $2.26 billion at 3Q24, down from $7.8 billion in 2019. That is a dramatic reduction in debt. Net debt swung from $6.6 billion in 2019 to net cash of $1.77 billion at 3Q24. Total debt/cap leverage of 7.6% and net cash overall plays to the ability of LEN to use its financial services operation to deal with any UST curve backdrop that unfolds from here in using mortgage incentives and buydowns as needed. It also opens up opportunities to deploy some cash as well as land in the pending REITs spin-off.
The LEN total liquidity story line that gets checked off in each press release with the hefty cash balance ($4.0 bn in cash and equivalents plus an undrawn $2.2 bn revolver) generating a headline liquidity number of $6.2 bn. We would expect that the buybacks doubling YTD through 3Q24 to $1.72 bn get the attention of the equity market as does the healthy dividend increase from $0.375 per quarter to $0.50.
To add to the comfort zone for both debt and equity exposure to LEN, the cash + inventory levels are almost 9x total homebuilder debt and inventory alone over 7x. Since a slowdown would serve to generate even more cash from inventory liquidation (even with a hit to earnings in a contraction), the financial story of LEN is packed all about liquidity health and cash flow resilience.
As we look back to 2019, we see a ratio of 2.4x on cash + inventory coverage. The obvious question is how much land will get shed with the REIT and what will be the new balance of finished lots and homes in process on their books once the REIT is spun. LEN has a $500 mn bond maturing in May 2025 and a $400 mn bond maturing at the start of June 2026.
For now, LEN presents a AA quality balance sheet and an overall risk profile more like a single A despite its BBB tier rating. The ratings criteria for major homebuilders are long overdue for a revision after so much industry proof over such a range of macro backdrops from COVID into the supplier chain challenges, labor shortages, and then a tightening cycle. LEN still has a transaction pending, but pro forma for shedding a lot of land and some cash, the company will continue to present a very strong financial profile after paying down over 70% of its debt since 2019.
Land-light home stretch…
As cited earlier, the development of the land-light and asset-light strategy since 2020 remains underway. That will include a REIT (“Millrose”) to spin off as a land development operation to sustain this changing business model. The process remains underway and will get more airtime as it proceeds through the SEC. There will be a distribution of stock to Lennar shareholders.
The moving parts of this transaction will get more disclosure in time, but it has been a topic for quite a while to this point. LEN kept repeating that they were limited on what it could say due to SEC review. The transaction would reduce inventory and be accounted for as a distribution. Some cash will be contributed to the entity, but the major moving parts of the deal are unclear in terms of the billions of inventory at this point.
See also:
Footnotes & Flashbacks: Credit Markets 9-23-24
Footnotes & Flashbacks: State of Yields 9-22-24
Footnotes & Flashbacks: Asset Returns 9-22-24
Mini Market Lookback: FOMC Week 9-21-24
FOMC Action: Preemptive Strike for Payroll? 9-18-24
Consumer Sentiment: Inflation Optimism? Split Moods 9-13-24
Construction Spending: A Brief Pause? 9-3-24
PCE July 2024: Inflation, Income and Outlays 8-30-24
2Q24 GDP 2nd Estimate: The Power of 3 and Cutting 8-29-24
Housing and Homebuilders:
Existing Homes Sales Aug 2024: Mortgages Still Rule 9-19-24
Home Starts Aug 2024: Mortgage Rates to Kickstart Hopes Ahead? 9-18-24
Harris Housing Plan: The South’s Gonna Do It Again!? 8-28-24
New Home Sales July 2024: To Get by with a Little Help from My Feds? 8-25-24
Existing Home Sales July 2024: Making a Move? 8-23-24
Housing Starts July 2024: The Working Capital “Prevent Defense” 8-16-24
Credit Crib Note: PulteGroup (PHM) 8-11-24
Credit Crib Note: D.R. Horton (DHI) 8-8-24
New Homes Sales June 2024: Half Time? Waiting for Mortgage Trends 7-24-24
Existing Home Sales June 2024: Supply Up, Prices Up, Volumes Down 7-23-24
Housing Starts June 2024: Still All About the Deliveries 7-17-24
Homebuilder Equities: “Morning After” on Rate Optimism 7-12-24
Homebuilders: Equity Performance and Size Rankings 7-11-24
Credit Crib Note: KB Home 7-9-24
Lennar: Key Metrics Still Tell a Positive Macro Story 6-20-24
Credit Crib Note: NVR, Inc. 5-28-24