
Footnotes & Flashbacks: Asset Returns 4-20-25
We update running asset returns for rolling time periods as the UST rallies and equities react to erratic, recurring tariff policy shifts.


Congressional GOP spirit animal or the mascot for any school that bows to Trump?
Another strange week saw toxic political headlines, some fresh trade action against China in port fees, mixed macro headlines, and an aggressive display of hostility by Trump against Powell (see Mini Market Lookback: The Powell Factor 4-19-25, Ships, Fees, Freight & Logistics Pain: More Inflation? 4-18-25).
We had mixed econ headlines across retail sales, industrial production, and housing starts, but the sense of dark foreboding (and confusion) around tariff fallout (prices, costs, and payroll fears) remain a dominant factor as tariffs will be registering in transactions in coming weeks and take their logical multiplier effects across the economy.
The week overall was a net positive for asset returns whether we look at the rolling 1-week (5 days) or narrow it to just the holiday-shortened week. Rates rallied for bonds this week, but the industry 1Q25 earnings releases and guidance sent mixed messages on where we go from here.
The market will get a massive wave of earnings reports across more critical sectors this week that include bellwethers with exposure in Consumer Finance (e.g. CapOne, Discover), Mag 7 (Alphabet, Tesla), Pharma (Merck, AbbVie), Defense & Aerospace (Boeing, Lockheed, RTX, NOC, GD, GE), some data center flavor (Digital Realty), color on equipment demand (United Rentals), and some legacy tech (Intel). That is a lot of range.
The earnings reports will be interesting in gauging how many major companies tackle (or evade) commentary on tariffs given the awareness of how a highly vindictive President tends to react to any hint of a question on the wisdom of tariffs (likely Defense response: “Salt of the earth! Wonderful guy! Great policies!”). Color on Tech/Semis and Pharma tariffs will be especially guarded.
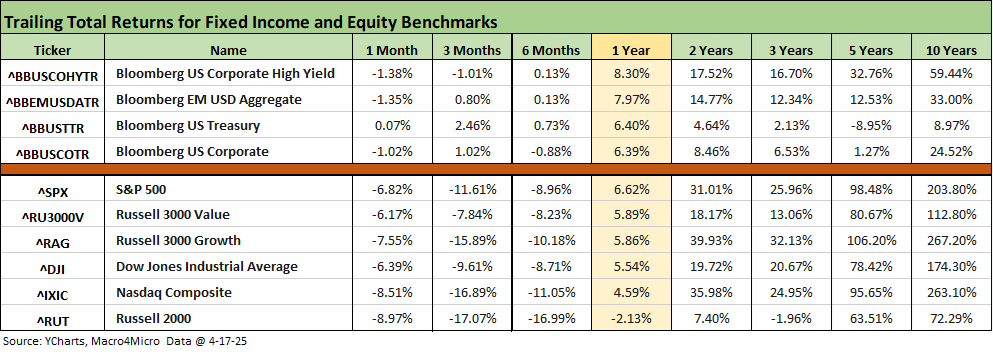
The above table updates the rolling returns on the high-level debt and equity benchmarks we monitor.
There is certainly no mystery to equities as those benchmarks post all negative numbers for the 1-month, 3-month, and 6-month time periods. If we look back at the trailing 1-year period, we see equity benchmarks with 5 of 6 positive (Russell 2000 negative). The best 1-year return within the equity mix is the S&P 500 at a mid-single-digit return of 6.6%, which is below the long-term return on equities of closer to 10%. That is not saying much after the 2023-2024 years saw the S&P 500 put together the best back-to-back annual returns north of 20% since the TMT bubble years of the late 1990s.
The bond benchmarks overall are slightly negative for the 1-month period with 3 of 4 in the red while 3 of 4 were positive for 3 months and 6 months. One highlight is that looking back over the 1-year time frame shows bond benchmarks slightly ahead of equities. That offers a reminder of why diversification exists as a strategy. Riskier bonds with a credit flavor performed slightly better over a 1-year horizon but that performance on the “interest rate risk vs. credit risk” contest has been more mixed in recent weeks with the sharp rise in spreads from the recent lows and confusion around what lies ahead from the Trump Tariff team.
The rolling return visual
In the next section, we get into the details of the 32 ETFs and benchmarks for a mix of the trailing periods. Below we offer a condensed 4-chart view for an easy visual on how the mix of positive vs. negative returns shape up. This is a useful exercise we do each week looking for signals across industry groups and asset classes.

The symmetry of returns as captured above shows an abysmal performance of asset returns over 1-month and 3-months as well as the steady adverse shift over a 1-year horizon with 2024 returns gradually getting eaten away. The overwhelmingly positive mix of 1-year returns to start 2025 will continue but with volatile weeks along the way.
For the 1-week timeline, we detail two cuts of the data further below. We usually post the rolling 5-day returns (typically a Friday close to Friday close), but holidays bring an asterisk when the start or end date moves. The above chart has 5 days although in these times a single day at the beginning or end can make a big difference in the return number. For the 5-day period, the week was notably positive in mix at 28-4 (within a very ugly 1-month period). The shorter measurement period just includes 4 days (detailed further below) and was still net positive at 21-11 but tougher on the larger benchmarks with the S&P 500 and NASDAQ negative.
The Magnificent 7 heavy ETFs…
Some of the benchmarks and industry ETFs we include have issuer concentration elements that leave them wagged by a few names. When looking across some of the bellwether industry and subsector ETFs in the rankings, it is good to keep in mind which narrow ETFs (vs. broad market benchmarks) get wagged more by the “Magnificent 7” including Consumer Discretionary (XLY) with Amazon and Tesla, Tech (XLK) with Microsoft, Apple, and NVIDIA, and Communications Services (XLC) with Alphabet and Meta.

The tech bellwethers have had a rough ride with a lot of turbulence still ahead as markets try to frame what the final reciprocal tariff negotiations will look like with various non-China Asian nations (notably Taiwan) and how many aggressive retaliations China might pull out to undermine key US markets. Beyond the retaliatory tariffs, we got a tase with the Boeing delivery actions and strategic metals restrictions. The range of retaliatory alternatives China could pursue under some more extreme scenarios to impact Apple and Tesla does not require much imagination. After a while, extrapolation would start to run amok in economic war games. The scenario risks certainly remain high.
For the rolling 5-day week in the chart above, we see 6 of the Mag 7 names in the red and sitting below the broader benchmarks with Apple on top. For 1-month, all lines ex-Tesla (+1.4%) were negative while for 3-months all lines were negative. For 6 months, all lines ex-Tesla were negative.
In a market with such volatility, the rolling 1-month and 3-months is today’s story with the next round of tariff battles with trade partners driving the bus. The tariff rollout has been managed erratically to the point of gross incompetence. Even the impressive skillset in disinformation we used to see has fallen short with the messages often directly contradicting each other (“permanent, not a negotiation, no exemptions” vs. “all about negotiations, pauses and myriad exemptions”). They will market it as “game theory brilliance,” but the market is showing its justified doubt on that.

As we addressed above, the “1-week” buckets we use drop in the rolling 5-days (typically Friday close to Friday close), so this “1-week” would have been Thursday to Thursday close (detailed in the chart below). Adjusting for the shorter time horizon, the above chart adds in a few more negative returns including the S&P 500 (SPX). The 21-11 score for the shortened week includes a few more negatives such as the Financials ETF (XLF) and Industrials ETF (XLI).

We earlier framed this version of “1-week” in our Mini Market Lookback: The Powell Factor (4-19-25). For the rolling 5-day version, the pop in the energy ETFs was especially impressive but within an ugly 1-month period for the E&P ETF (XOP) and broad Energy (XLE). E&P also was beaten down over 3-months with broad Energy doing slightly better near the bottom of the 3rd quartile for 3-months (detailed further below).
The common feature in both “1-week” charts was the weakness in the tech heavy and Mag 7 concentrated ETFs as well as NASDAQ. Both versions of the week highlight strength in Energy and high-income sectors such as Midstream Energy (AMLP) and BDCs (BIZD). Both show some relief for Real Estate (XLRE) and Regional Banks (KRE).

The 1-month period tells a story of tariff pain and macro anxiety with a score of 3-23 with Consumer Staples ETF (XLP) at #1 at +2.0% joined by the short duration UST 1-3Y (SHY) and the UST index (GOVT) at sub-1% returns. The rollout of tariffs did not quite work out as planned in substance, optics, or consistency.
The industry ETFs getting slammed are there to look at in the above chart, but a common theme is weaker economic growth and demand headwinds, higher costs, worries around inflation and the assumed need of the Fed to protect price stability first and foremost to reduce stagflation risk. That means slow easing until jobs start to erode. Tech line items were hit hard with Energy and Transport, but the small caps Russell 2000 (RUT) and Midcaps (MDY) remain markets to watch.
Russell 2000 weakness offers a reminder of what threats lurk below the Russell 2000 in the very long tail of privately-owned small businesses across the US. Small businesses are critical employers and will feel the tariffs without the synergies, operational flexibility, and purchasing power clout of some major corporate sector companies.
The weakest performers over the 1-month period include E&P (XOP) as oil tanked and the Transport ETF (XTN) after Trump put a dagger in project trade volumes. The World Trade Organization also released their World Trade Outlook this week, and the forecast were grim (see Ships, Fees, Freight & Logistics Pain: More Inflation? 4-18-25).

The 3-month returns post a score of 7-25 in another ugly performance. The 7 in positive range include 6 bond ETFs with Consumer Staples (XLP) at the top of the 7. The Utility ETF (XLU) in the top quartile bringing up the rear of the 3-months but with a negative return. The HY ETF (HYG) is just across the line at the top of the second quartile but with a negative return.
We see the Transport ETF (XTN) in dead last at -24.7% as trade volume expectations have plummeted. Just ahead of XTN is E&P (XOP) with the rest of the bottom quartile showing an alarming diversity of very poor performers in tech-centric and Mag 7 heavy sectors such as Consumer Discretionary (XLY), Tech (XLK), and NASDAQ. Regional Banks (KRE) and Russell 2000 (RUT) are in the bottom quartile along with Homebuilders (XHB). That is not a reassuring mix for cyclical confidence and highlights the breadth of the tariff impact.
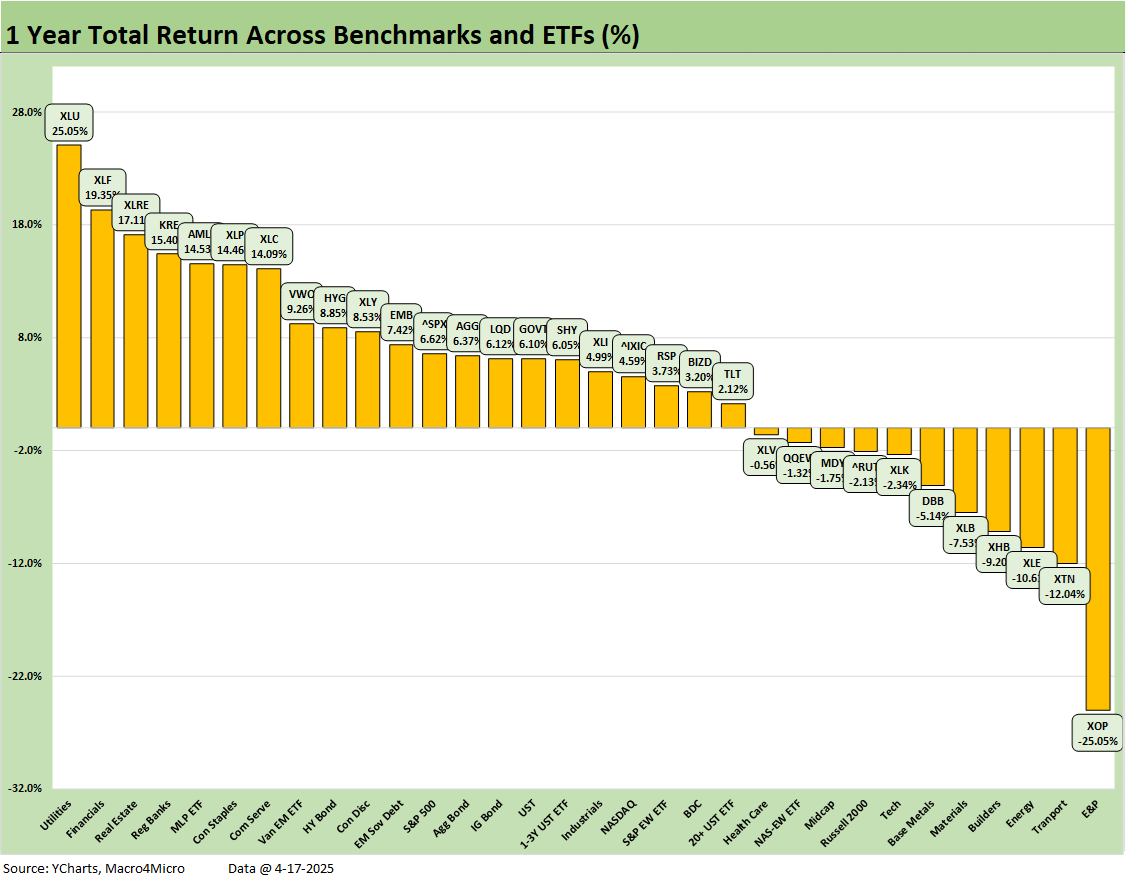
The trailing 1-year number detailed above is a long way from the 32-0, 31-1, and 30-2 scores we saw across the weeks in late 2024 and into early 2025. The current score above stands at 21-11. As a reminder, the final score for 2024 was 30-2 (see Footnotes & Flashbacks: Asset Returns for 2024 1-2-25).
The weak performers in the bottom quartile above combine the tariff-exposed such as Transports (XTN) and some of the interest rate sensitive cyclicals such as Homebuilders (XHB) and Materials (XLB). As we saw with the 3-month results, the Tech ETF (XLK) beatdown is in the negative mix.
Energy marches to its own beat and ties into macro demand and how that flows into volume and price. When Trump promised to cut energy costs in half in his campaign, we assumed it was tied into drill, drill, drill and not a sharp decline in forecasted demand weakness tied to tariffs, tariffs, tariffs. He also might have had in mind more Russian supply and throwing Ukraine under a tank, but he did not share that. OPEC has also moved the needle on supply expectations.
For asset allocation strategies and those who justifiably preach diversification and spreading around your risks, we see 6 of the 7 bond ETFs we track positioned in the second quartile. The long-duration UST ETF (TLT) is in the middle of the third quartile.
Tariff execution and the credibility problems…
A simple statement of fact from the White House and policy advocates affirming that the “buyer pays” the tariff might help in terms of credibility, but the concepts and the facts have not been friends to the pro-tariff crowd. Unlike lying about election results, tariffs will show up in time in aisles, on Amazon, in the showrooms, and make an increasingly troubling appearance at the unemployment office. The voters can also just google the facts.
An intro economics class hammers home the concept of multiplier effects as we have covered in past commentaries on tariffs (see The Trade Picture: Facts to Respect, Topics to Ponder 2-6-25, Tariffs: Questions to Ponder, Part 1 2-2-25). The positive multiplier effects from trade also go in the other direction. You can win on multiple fronts from expanded trade volumes and lose on more fronts when trade heads lower.
Among the bad multiplier effects are lower real growth rates and lower earnings. In equities, that is when lower multiples get assigned to lower earnings rates. That is unfriendly math. The ferocity of the political sales pitch by the Trump Tariff team focuses on winning over the base, so the reality of tariffs will just need to be experienced firsthand over the remainder of 2025.
In the meantime, as the reciprocal tariffs get negotiated with the clock ticking on the rest of the tariffs not in the negotiation process, the tariff advocates will be working on their distraction and deflection game (blame Powell, blame CEOs for raising prices, blame China, the EU, etc., and anyone else who retaliates). One of the Congressional GOP geniuses from the Ghostly Trio (Boebert, House Rep from Colorado on Fox) was citing “communist” asset managers selling stock to hurt Trump. These are the leaders in Washington. Best and brightest.
See also:
Mini Market Lookback: The Powell Factor 4-19-25
Ships, Fees, Freight & Logistics Pain: More Inflation? 4-18-25
Home Starts Mar 2025: Weak Single Family Numbers 4-17-25
Credit Snapshot: Service Corp International (SCI) 4-16-25
Retail Sales Mar25: Last Hurrah? 4-16-25
Industrial Production Mar 2025: Capacity Utilization, Pregame 4-16-25
Credit Snapshot: Iron Mountain (IRM) 4-14-25
Footnotes & Flashbacks: Credit Markets 4-13-25
Footnotes & Flashbacks: State of Yields 4-13-25
Footnotes & Flashbacks: Asset Returns 4-12-25
Mini Market Lookback: Trade’s Big Bang 4-12-25
Tariffs, Pauses, and Piling On: Helter Skelter 4-11-25
CPI March 2025: Fodder for Spin 4-10-25
Credit Snapshot: Avis Budget Group (CAR) 4-9-25
Payroll March 2025: Last Call for Good News? 4-4-25
Payrolls Mar 2025: Into the Weeds 4-4-25
Credit Snapshot: AutoNation (AN) 4-4-25