
D.R. Horton: #1 Homebuilder as a Sector Proxy
We update the trends of the #1 builder as a proxy for how mortgage rates and incentives flow into the numbers.


The recent trends seen in the largest homebuilders tell a story of an industry evolution in operating and financial strategies such as lower asset intensity, stronger balance sheets, and high free cash flow driving outsized stock buybacks.
The major homebuilders have been able to reassure investors that higher mortgage rates can be navigated while still sustaining high gross margins, lowering debt and leverage, improving asset protection (inventory/debt ratio), and all the while returning cash via major stock buybacks.
The post-COVID housing cycle is one that should lead to a broader and favorable reassessment of industry risk profiles that could flow into credit ratings criteria and valuation multiples.
Homebuilders are in a market that remains capacity constrained in labor while disruptions from deportation and contingent threats from tariffs and supplier chains could bring more headwinds.

The above chart plots the stock returns for D.R. Horton (DHI), Toll Brothers (TOL), and the Homebuilder ETF (XHB) across the timeline from just before the end of ZIRP and the start of the Fed tightening cycle. If we look at the largest builders (e.g. Top 10), Toll has the highest average selling prices and DHI the lowest. The simple chart makes a statement that affordability and the need for incentives is going to remain a challenge in the “real world” for DHI buyers. TOL has a very different customer profile.
While affordability strains are a demand factor and undercut some new home buyers at the margin, DHI has shown it can be dealt with as we discuss below. The use of incentives with a modest and manageable haircut to margins did not derail DHI or numerous other major builders since the mortgage rates pain kicked into gear (see Credit Crib Note: D.R. Horton (DHI) 8-8-24, D.R. Horton: Credit Profile 4-4-23). It was a headwind, but they pushed through.
We like to watch D.R. Horton and Lennar as the “Big Two” of homebuilders with Pulte, NVR, and Toll rounding out the Top 5 and each with their own distinctive strengths (see links at bottom for other builder commentaries). Pulte posts industry leading margins (see Credit Crib Note: PulteGroup (PHM) 8-11-24, PulteGroup 3Q24: Pushing through Rate Challenges 10-23-24, ). With its outsized market cap relative to its size, NVR “wrote the book” on the use of land/lot options that allowed it to maximizing ROE and maintain a very strong balance sheet (see Credit Crib Note: NVR, Inc. 5-28-24). Toll Brothers is simply in its own world of luxury success and its client base does not face the type of barriers that impact the “low ASP crowd” (see Toll Brothers: Rich Get Richer 12-12-24).
DHI and LEN by sheer scale, geographic breadth, and product tier mix are useful proxies for the direction of the industry. In current times, it is worth watching how they adapt their strategies in a market that still boasts a bullish secular demand outlook that comes with favorable demographics.
Monitoring DHI and LEN as leaders is as much about the housing sector supply crisis and navigating high mortgage rates as it is about their stand-alone fundamentals as stocks or bonds. 30Y mortgage rates have swung in a 200 bps band since the last tightening action of July 2023, and there is still material uncertainty where the 10Y UST (and 30Y mortgages) go from here after the sharp back-up from the Sept 2024 lows (see Footnotes & Flashbacks: State of Yields 1-26-25).
Land, lots, starts, and funding…
There has been a lot of action in reshaping inventory strategies in the post-bubble cycle generally and in the post-COVID period narrowly that we look at in our single name work. The embrace of asset light strategies is a hot topic, especially for DHI and LEN. Some of the plans continue the evolutionary trend set by NVR’s strategy before and during the bubble years with respect to land development and use of options (purchase contracts, etc.). NVR easily was the most visible success story in managing its risks after the housing bubble popped. The changes in land banking and land development funding continues to change since then with almost all the big players using the NVR toolkit (see Credit Crib Note: NVR, Inc. 5-28-24)
Recent actions at D.R. Horton (1Q25 earnings reported and 10-Q filed) and Lennar (filed FY 11-30-24 10-K. Millrose REIT spin-off proceeding with S-11 filing on land banking and development strategy). We will look at the Lennar details in a separate commentary. In the Millrose REIT spin-off, LEN will be testing the waters with a permanent source of recurring, recycled capital for a portion of their lot development and funding needs. It is a taxable REIT in a taxable spin-off distribution.
If LEN’s Milrose REIT strategy works, that entity (for now, tagged as “unique” by LEN) would open up a new channel for lot/land funding in an independently capitalized, separate entity. More on that another day. We read the Millrose S-11, and it is jampacked with details on land banking and where it might be headed with a new REIT model.

The above peer group stock returns for 14 homebuilders vs. the benchmarks tells a story. The obvious trend is the recent underperformance with the 3-month beatdown showing all builders negative. The 6-month shows all homebuilder negative ex-Toll. For the 1-year we see 9 positives and 5 negatives. For the 1-year, only Toll and Taylor Morrison outperformed the S&P 500. The damage has mostly been done since Sept 2024.
The “comps” look very different when you start looking back 2, 3, 5, and 10 years. The homebuilders generally have been exceptional performers even just looking back at the pre-tightening period and pre-COVID.
In looking at the homebuilder returns and framing them vs. XHB, it is important to remember that the XHB ETF also includes supplier chain players from building products to home retail and furnishings. Homebuilders comprise just under half of the XHB as of the most recent look at their holdings. The mix at XHB has the merit of representing the impact of housing and the building cycle with all of its multiplier effects from materials and building suppliers to those in the remodeling end of the business.
The homebuilding chain represents an ecosystem that is extraordinarily important in the consumer and supplier chain of materials as well as financial services (mortgages, land banking, etc.). The heavy supplier chain and services mix in XHB is why so many builders can lag the XHB looking back over the 1-year time horizon.
The homebuilder journey into 2025…
D.R. Horton (DHI) put up decent numbers for 1Q25 (quarter ended 12-31-24), the stock market liked it, and the credit quality still looks more like a high single A than a high BBB tier name. That said, DHI’s financial and operating trends still show modestly fading growth fundamentals in the face of high mortgage rates and an inadequate supply of affordable homes in the lower price tiers.
As we cover in the stock charts above, the homebuilders have been dialed back after leading the pack through the early fall as rate optimism shifted homebuilder valuations higher. The Homebuilder ETF was leading the LTM returns at the end of September 2024 for the 32 benchmarks and ETFs we track each week (see Footnotes & Flashbacks: Asset Returns 9-29-24). That +64% LTM return saw the LTM return for XHB this past week fall back to +19.4%.
The risk from here is that policy actions further unsettle the longer end of the UST curve and notably the 10Y and how that flows into 30Y mortgage rates. As we go to print, the 10Y UST is just under 4.5% vs. a 3.6% handle during Sept 2024.
The recent home starts numbers and new home sales were constructive (see New Home Sales Dec 2024: Decent Finish, Strange Year 1-27-25, Housing Starts Dec 2024: Good Numbers, Multifamily Ricochet 1-17-25). Margins can get squeezed but the builders were able to deal with a tightening cycle that often surprised even the housing sector bulls. You cannot fight the tape on unit cost pressures or faltering first time and entry level buyers. Eventually margins get pressured, and we have seen such headwinds in recent quarters for some bellwether builders.
One fact that has been made clear by all the major builders is the commitment to sound and prudent working capital management and finding the right balance between starts and sales rates. In some cases, the price vs. pace decision shows some builders prioritizing inventory turnover to drive cash flow and a willingness to give on price and margins to maximize inventory turns and cash flow for buybacks (notably in Lennar’s case).
DHI by the numbers…

The direction of the DHI revenue line is clear enough in the above results of operations. A mixed combination of volume or price drove FY 2024 revenues to double that of FY 2019. As we detail in the geographic segments below, there is a range of variances across the 6 geographic “reporting segments” within the homebuilding operations. Separately, we also include metrics for the “operating segments” across Homebuilding, Rental, Forestar and Financial Services.
The trend lines above cover the main income statement drivers in what is a “price x volume” business. Homes closed hit a high of 89K in FY 2024 in a very impressive volume performance while average selling prices (ASPs) are off the highs of FY 2022 and down YoY. DHI has traditionally generated the lowest ASPs of the major homebuilders at sub-$300K as recently as 2019-2020.
In a sign of the times, DHI is still the lowest of the top tier builders but closer to $400K at a $375K ASP in 1Q25, below the $385 peak of FY 2022. If you include LGI Homes in the peer group of the major builders, LGIH posted $371K for its most recent reported quarter (3Q24).
DHI margins have felt incentive costs and some of the effects of the inflation cycle, and that has flowed into Homes Sales gross margins. The peak FY gross margin was +28.7% in FY 2022, up from 20.2% in FY 2019. The weight of the operational and incentive headwinds saw margins narrow down to the 24% area in FY 2024 and under 23% in 1Q25 as noted above. Net sales orders in 2024 declined and again 1Q25 YoY with the backlog down as well.

The above table shows the operating segment profitability for DHI. The homebuilding segment also has 6 reporting segments broken out along geographic lines. These units have distinct operating fundamentals and have stand-alone balance sheets not guaranteed by DHI or the homebuilding units. Despite that stand-alone profile for financial performance and balance sheet, the lines of business are inextricably intertwined with the core homebuilding operations of DHI. Even the multifamily rental operation has a heavy single-family flavor in the form of garden apartments and attached homes. Those of us who live in congested urban areas have a different view of what “multifamily” often means.
A quick review of the segment mix:
Homebuilding: This segment is over 91% of operating segment pre-tax income. The reporting segment is where the bulk of inventory lives ($20.6 billion at 1Q25) and includes $2.55 bn in cash vs. segment debt of only $2.44 bn in homebuilding debt. That includes the DHI bonds guaranteed by the homebuilding subsidiaries.
Forestar: As a reminder, Forestar (ticker FOR) is a publicly traded stand-alone lot/land developer that is 62% owned by DHI. FOR has a market cap around $1.2 bn and issued bonds with a low BB tier composite rating that is not guaranteed by DHI or its homebuilding units. FOR reported $807 mn in debt set against $2.7 bn in inventory at 1Q25. We will look at FOR credit fundamentals separately as a stand-alone operation.
FOR delivered record profitability in FY 2024, but pretax income ticked down materially in 1Q25, which was expected to be the lowest delivery quarter of the year. During 4Q24 earnings season, FOR guided to $1.6 bn to $1.65 bn in revenue for 2025 with 2H25 higher than 1H25. They indicated with 1Q25 reporting that FY 2025 guidance remains unchanged.
Financial Services: The financial unit is also a stand-alone borrower not guaranteed by DHI or its homebuilding operations. The mortgage boom in 2021 still is the peak earnings year. The mortgage operation remains a core component of the selling strategy through mortgage buydowns and fee relief.
Rental: The single family rental operations and multifamily operations are lumpy given the timing of bulk sales. The Rental operations balance sheet also features its own stand-alone borrowing lines not guaranteed by DHI or the homebuilding subsidiaries. The Rental unit posts $1.05 bn in debt at 1Q25 vs. just under $3 bn in properties inventory.

The above table updates the geographic homebuilding segment pre-tax income. For FY 2024, we see 4 of 6 segments post higher earnings while for 1Q25 we see 3 up and 3 down. Considering all the headwinds around mortgages and affordability concerns and the supply crisis, that is a solid result.

The above homebuilding reporting segment table details closings, so it is about volume. We see all 6 segments posting higher volumes in FY 2024. For 1Q25, we see some leveling off at 3 higher and 3 lower and the total closings lower.

The above table presents a mix of balance sheet line items and some asset coverage ratios. DHI’s homebuilding debt is lower than the overall consolidated entity given how DHI has structured its guarantor and recourse exposure across business lines. The “consolidating” financials are broken out in each quarter’s earnings release and SEC filings.
As cited earlier in this note, financial debt is distributed across its various operating segments including the land/lot development subsidiary Forestar, Financial Services, and the Rental operations. Those units each have their own debt and are not guaranteed by DR Horton or its homebuilder subsidiaries. Those operations are distinctly profitable stand-alone borrowers in their own right.
Total consolidated debt to cap of 17% is below the sustainable upper target of 20% using the $5.1 bn total DHI debt while the homebuilder balance sheet is materially stronger with $2.45 bn in homebuilder debt. That homebuilder debt total is slightly less than homebuilding cash of $2.55 bn. Homebuilder inventory coverage (ex-Forestar) of homebuilder debt underscores the magnitude of asset protection at 8.4x at 1Q25 even before factoring in cash.
The heavy rate of stock buyback activity is a key part of the balance sheet story as we detail in the next chart. DHI can pay down debt at will but seeks to run a balanced capital allocation program. Homebuilding debt has remained in a relatively narrow range across this cycle while its expansion in Rental and need to use Financial Services balance sheet to drive higher volumes of home sales account for the modest increase in total consolidated debt.
As we will address in a separate commentary on Lennar, the use of new strategies to fund land development activity could open up a lot of other potential avenues for the major builders. Looking back across the cycles, NVR was an innovator by steering clear of land development and using lot option strategies with developers. DHI then decided to buy a developer (Forestar) as a stand-alone unit (62% owned) while still doing a heavy lift of development on its own.
If Lennar’s REIT strategy works as planned, that would open up a new means for reducing balance sheet intensity and funding alternatives via third party balance sheets while concentrating on home construction activities and inventory turns.
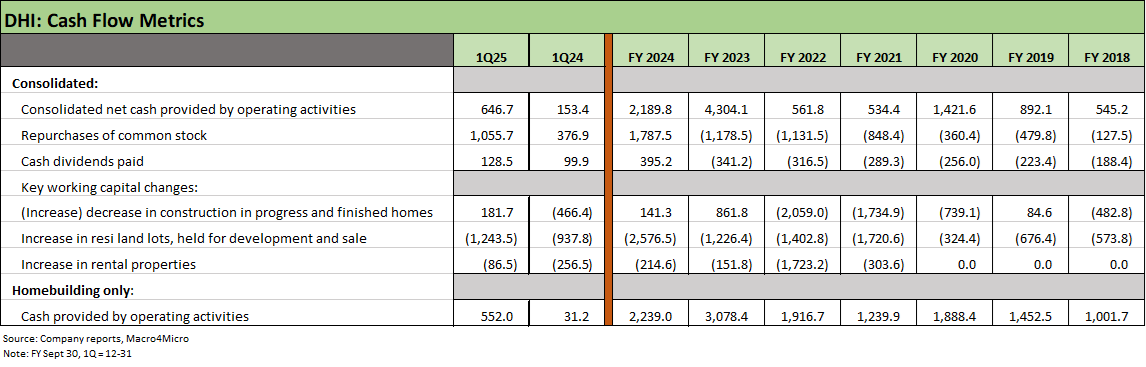
We update the cash flow metrics and primary uses/sources above. The stock buyback trend tells a very favorable story for shareholders while still underscoring how controlled the DHI homebuilding balance sheet is across the cycle. When DHI stock sells off, DHI can step up and buy back stock. That was very much in evidence at DHI in the Dec quarter with a $1.06 bn buyback line for 1Q25.
See also:
Footnotes & Flashbacks: Credit Markets 1-27-25
Footnotes & Flashbacks: State of Yields 1-26-25
Footnotes & Flashbacks: Asset Returns 1-26-25
Mini Market Lookback: Policy Blitz Formation 1-25-25
Housing:
New Home Sales Dec 2024: Decent Finish, Strange Year 1-27-25
Existing Home Sales Dec 2024: Another “Worst Since” Milestone 1-24-25
Housing Starts Dec 2024: Good Numbers, Multifamily Ricochet 1-17-25
Homebuilders:
KB Home 4Q24: Strong Finish Despite Mortgage Rates 1-14-25
Toll Brothers: Rich Get Richer 12-12-24
PulteGroup 3Q24: Pushing through Rate Challenges 10-23-24
KB Home: Steady Growth, Slower Motion 9-26-24
Lennar: Bulletproof Credit Despite Margin Squeeze 9-23-24
Credit Crib Note: PulteGroup (PHM) 8-11-24
Credit Crib Note: D.R. Horton (DHI) 8-8-24
Homebuilders: Updating Equity Performance and Size Rankings 7-11-24
Credit Crib Note: KB Home 7-9-24
Lennar: Key Metrics Still Tell a Positive Macro Story 6-20-24
Credit Crib Note: NVR, Inc. 5-28-24
Toll Brothers: A Rising Tide Lifts Big Boats 5-23-24
Credit Crib Note: Taylor Morrison 5-20-24
PulteGroup: Strong Volumes, Stable Pricing 4-24-24
D.R. Horton: Ramping Up in 2024 Despite Mortgages 4-19-24
D.R. Horton: Credit Profile 4-4-23