
Mini Market Lookback: Trade’s Big Bang
We look back at a week that sets the stage for bouts of inflation, supply-demand dislocations, cost shocks, and disinformation.


All the King’s sycophants and the all the King’s “men” won’t put global trade back together again.
Equities went on a wild ride and credit spreads were mixed after the prior week’s shocking pain (see Mini Market Lookback: A Week for the History Books 4-5-25). The 90-day pause and a 1-day mind-blowing rally does not change the basic reality of a soaring overall tariff structure, a full-blown China trade war in what is a systemic threat to the US “cost of sales,” and the facts of very high tariffs already in place on the top 4 trade partners (including USMCA partners on the fentanyl). We see numerous product tariffs in process (e.g., autos, steel, aluminum) and on the drawing board (lumber, copper, potentially pharma and semis).
The scenarios went from the assurance of the trade system literally breaking in months on the reciprocal tariff lunacy to global trade now being exposed to potentially breaking subject to what comes out of the 90-day pause and any proportionate retaliation from the EU, Canada or Mexico (see Tariffs, Pauses, and Piling On: Helter Skelter 4-11-25). We at least got some good news on the 11th hour Trump China exemptions Friday night that protected smartphones and computers from the reciprocal tariffs. Perhaps that will be fleshed out over 90 days with many electronics components essential to data centers with all of the AI ramifications.
The tragically simplistic and conceptually bereft reciprocal tariff policy is coming home to roost in dollar weakness, higher UST rates, and more political toxicity and Washington dysfunction (even if that seemed impossible) as the government budgets are falling prey to accounting gimmicks that do not change the basic story or change the upward trajectory in the world of “cash in, cash out” for the US Treasury. Record gold prices are no coincidence. At this point, the word “trust” rivals “uncertainty” in active usage in financial commentary (see Reciprocal Tariff Math: Hocus Pocus 4-3-25, Reciprocal Tariffs: Weird Science Blows up the Lab 4-2-25).
The worries around funding record US deficits in a market that needs high rates of foreign buying - and no large-scale foreign selling - made the UST curve the swing factor that got Trump off his case of “repetitive repetition syndrome.” The problem will be higher goods prices ahead, rising inflation forecasts, and a weaker dollar. That adds up to a bad marketing campaign for UST demand – especially when so many of the largest holders (Japan, China, numerous European domiciles/entities) are extremely pissed off at the US.
In a week where CPI and PPI would seem supportive in normal times after a mild setback in the last PCE report (see PCE Feb 2025: Inflation, Income, Outlays 3-28-25), the CPI/PPI tag team seemed irrelevant in the context of the forward variables unfolding for prices and wages. We heard one “Fed head” (NY Fed President John Williams) predict 4% inflation this year.
The UMich consumer sentiment index tanked, and inflation expectations spiked (when you see phrases such as “since 1981” in the headline, you are supposed to pay attention). The 1-year inflation expectations increasing to 6.7% (from 5.0% last month) and long-term expectation to 4.4% (from +4.1%) was an eye-opener on sentiment even if it is just a survey (and even if 6.7% does not make much analytical sense). The Fed pays attention to expectations. The plunge in the overall sentiment to 50.8 in April 2025 was the lowest since the record low of 50 in June 2022 (peak inflation month).

The above chart updates a rally week for HY on the combination of the 90-day reciprocal tariff reprieve and the equity rally. IG spreads edged wider to +118 bps but were still inside the long-term median of +130 bps. The damage to IG returns as highlighted in the 1-week returns further below was tied to the UST curve and duration pain. The IG corporate ETF (LQD) was the second worst performer in the group of 32 benchmarks and ETFs we track. The worst performer was the long-duration UST ETF (TLT).
HY put together a rally on the week as noted above. It was a more nuanced spread rally with the lower end quality compression seeing both the B and CCC tier in lockstep at -23 bps. That is not a classic quality spread tightening. The rolling 1-month HY delta declined to +106 bps from the prior week’s +157 bps. The latter made the top10 worst months list (see Footnotes & Flashbacks: Credit Markets 4-6-25 ).
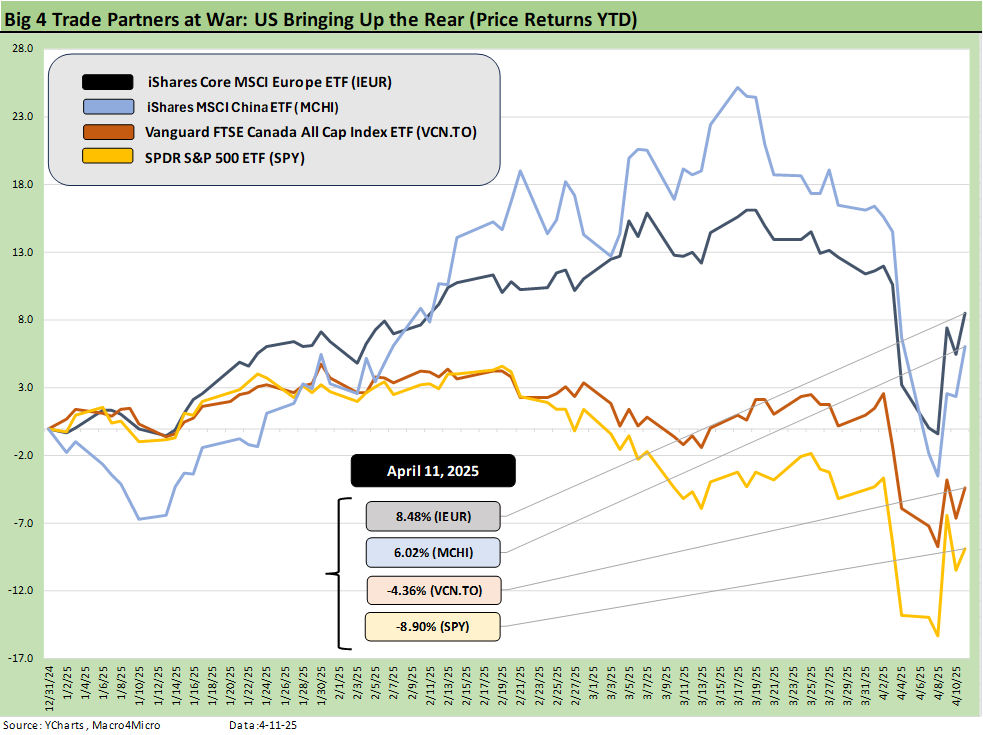
The above updates our recurring chart framing YTD benchmark equity index ETFs across 4 major trade partners of the US, Europe, China, and Canada. The running S&P 500 ETF (SPY) is in last place YTD. Europe is well ahead. China has been declared the trade war loser in advance based on simplistic assumptions (“the surplus trade partner always loses”). That does not reflect well on common sense. Voters decide how their leaders are doing in elections (except for the growing base of anti-democratic election deniers), and there is a lot of trade battling left to do.

The above chart updates the “rally week” with a score of 21-11. We see 5 of the 8 in the bottom quartile comprised of bond ETFs with the remaining 2 bond ETFs (SHY, HYG) in the lower end of the 3rd quartile.
The top quartile showed the prior week beatdown shifting into a rally with Tech and Mag 7 leading as we cover in the next chart. We see the Tech ETF (XLK) on top followed by the NASDAQ, but Industrials (XLI) bounced even if that mix is still facing material cyclical risk and tariff exposure. The Mag 7 heavy ETFs such as Communications Services (XLC) and Consumer Discretionary (XLY) made the top quartile along with the Mag 7 heavy S&P 500 (SPX) and the Equal Weight NASDAQ 100 ETF (QQEW).
Financials had a good week as the big bank earnings rolled out with the 1Q25 quarter perhaps the last “normal quarter” for banks to wrestle with as tariffs roll in and responses show up in the quality trend of counterparty ranks and the various subsectors of borrowers taste the tariff distortions and recession risk. Consumer quality will be right at the top of the list. M&A, IPOs, and capital markets activity will be a test of the tariff impacts in coming months.

The above chart updates the rolling returns on the tech bellwethers with the returns lined up in descending order of total returns for the 1-week period. The 1-week returns were all positive while the 1-month returns erased the “all negative” label seen last week as NVIDIA cracked back into positive range at +2.0% after a +17.6% week. The 3-month time horizon remains all negative while rolling 6-months pushed Broadcom back into the positive range (barely) joined again by Tesla in the new measurement period.

The above chart updates the 1-week UST deltas, and duration was pummeled. The headlines covered the UST issues all week as the noise behind the scenes was more worrisome than the absolute yields. The pace of yield deltas with a weakening currency and concerns around financial stability appeared to be what moved Trump (or so the flavor of news is spinning).
That concerns of “over the wall” dialogue across the US Treasury or even the Fed can lead the market to more extrapolation and worry with that as a lead topic with the 90-day clock ticking. We will still see retaliation getting handicapped and the first wave of tariffs start influencing prices into the summer. Rumors of China and Japan or numerous European entities revisiting their UST holding strategies will not go away.

The above chart plots the dollar index (DXY) with its heavy weighting of Euros at over half the index. There are many slices one can do on the dollar whether trade-weighted or directly looking at single paired exchange rates. The weighting of Euros vs. Yen vs. Sterling vs. Canadian dollar, etc. is not the main event for this purpose here. It is simply the reality that the dollar has been materially weakened at a time when tariffs are hitting buyers. A weaker dollar means tariffs cost even more than the hit to the “buyer pays” math.
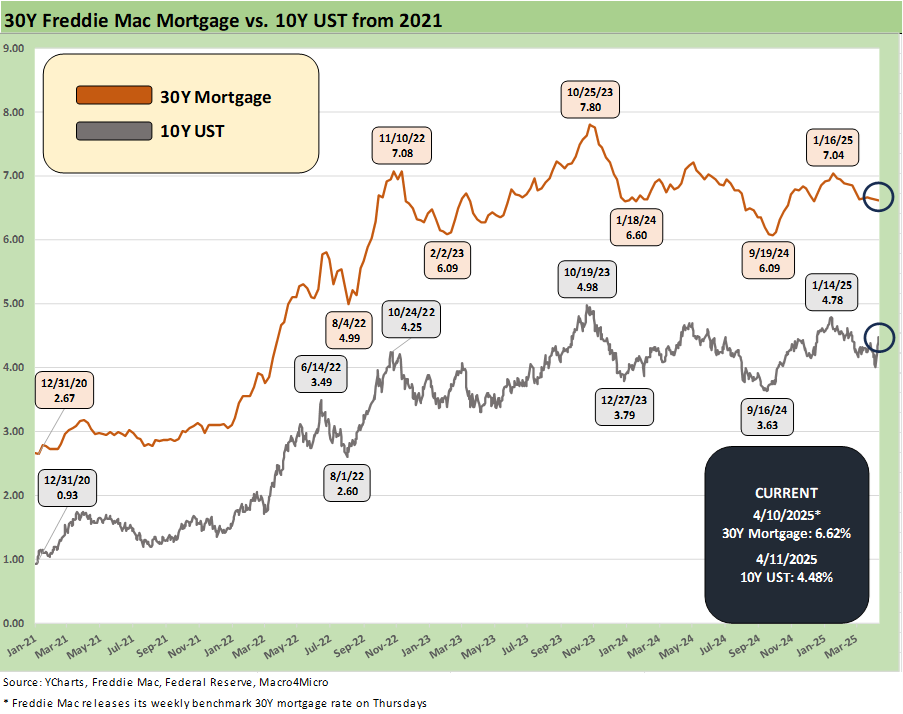
The above chart updates the Freddie Mac 30Y benchmark (set on Thursday at noon) vs. the 10Y UST. Freddie Mac lags the broader market price action when rates are moving quickly. Mortgage News Daily saw its index above 7% to end the week. The nuance of the survey timing, fees, and quality mix can be debated, but the Freddie benchmark gives a long timeline and a relatively uniform benchmark. The takeaway is that the news is bad and the rates are climbing to 7% handles for many lenders and borrowers.

The above chart updates the running credit spread with HY at+426 bps, down from +445 bps last week and inside the +462 bps median.

The quality spread differential between HY and IG OAS tightened on the week to +308 bps vs. +331 bps last week as IG edged wider by +4 bps and HY ran -19 bps tighter as noted earlier.

The above BB vs BBB quality spread differential also tightened to +132 bps from +153 bps last week as BBBs widened by +5 bps and BB tightened by -16 bps.
See also:
Tariffs, Pauses, and Piling On: Helter Skelter 4-11-25
CPI March 2025: Fodder for Spin 4-10-25
Credit Snapshot: Avis Budget Group (CAR) 4-9-25
Footnotes & Flashbacks: Credit Markets 4-6-25
Footnotes & Flashbacks: State of Yields 4-6-25
Footnotes & Flashbacks: Asset Returns 4-6-25
Mini Market Lookback: A Week for the History Books 4-5-25
Payroll March 2025: Last Call for Good News? 4-4-25
Payrolls Mar 2025: Into the Weeds 4-4-25
Credit Snapshot: AutoNation (AN) 4-4-25
Credit Snapshot: Taylor Morrison Home Corp (TMHC) 4-2-25
JOLTS Feb 2025: The Test Starts in 2Q25 4-2-25
Credit Snapshot: United Rentals (URI) 4-1-25
Mini Market Lookback: The Next Trade Battle Fast Approaches 3-29-25
PCE Feb 2025: Inflation, Income, Outlays 3-28-25
4Q24 GDP: The Final Cut 3-27-25
Durable Goods February 2025: Preventive Medicine? 3-26-25
New Homes Sales Feb 2025: Consumer Mood Meets Policy Roulette 3-25-25
KB Home 1Q25: The Consumer Theme Piles On 3-25-25
Lennar: Cash Flow and Balance Sheet > Gross Margins 3-24-25
Mini Market Lookback: Fed Gut Check, Tariff Reflux 3-22-25
Existing Homes Sales Feb 2025: Limping into Spring 3-20-25
Fed Action: Very Little Good News for Macro 3-19-25
Industrial Production Feb 2025: Capacity Utilization 3-18-25
Housing Starts Feb 2025: Solid Sequentially, Slightly Soft YoY 3-18-25
Retail Sales Feb 2025: Before the Storm 3-17-25
Mini Market Lookback: Self-Inflicted Vol 3-15-25
Credit Spreads: Pain Arrives, Risk Repricing 3-13-25
Tariff and Trade links:
Tariffs: Some Asian Bystanders Hit in the Crossfire 4-8-25
Tariffs: Diminished Capacity…for Trade Volume that is…4-3-25
Reciprocal Tariff Math: Hocus Pocus 4-3-25
Reciprocal Tariffs: Weird Science Blows up the Lab 4-2-25
Tariffs: Stop Hey What’s That Sound? 4-1-25
Tariffs are like a Box of Chocolates 4-1-25
Auto Tariffs: Questions to Ponder 3-28-25
Fed Gut Check, Tariff Reflux 3-22-25
Tariffs: Strange Week, Tactics Not the Point 3-15-25
Trade: Betty Ford Tariff Wing Open for Business 3-13-25
Auto Suppliers: Trade Groups have a View, Does Washington Even Ask? 3-11-25
Tariffs: Enemies List 3-6-25
Happy War on Allies Day 3-4-25
Auto Tariffs: Japan, South Korea, and Germany Exposure 2-25-25
Mini Market Lookback: Tariffs + Geopolitics + Human Nature = Risk 2-22-25
Reciprocal Tariffs: Weird Science 2-14-25
US-EU Trade: The Final Import/Export Mix 2024 2-11-25
Aluminum and Steel Tariffs: The Target is Canada 2-10-25
US-Mexico Trade: Import/Export Mix for 2024 2-10-25
Trade Exposure: US-Canada Import/Export Mix 2024 2-7-25
US Trade with the World: Import and Export Mix 2-6-25
The Trade Picture: Facts to Respect, Topics to Ponder 2-6-25