
Home Starts Mar 2025: Weak Single Family Numbers
A weak month for single family starts and permits is consistent with mortgage rates and a worried consumer sector.


Tinkering with some affordable housing ideas.
Recent mortgage rates off the Sept 2024 lows, the tariff bombshells, and consumer nerves as reflected in sentiment surveys make this spring selling season a tense one for builders as the 1Q25 earnings season kicks into gear.
On a day when D.R. Horton reported 2Q25 earnings (orders, closings, and backlog all down YoY), the March 2025 starts release was weak YoY with single family at -14.2% sequentially and -9.7% YoY. The very important South region was at -17.6% sequentially and -14.8% YoY.
Permits were not big movers but are not signaling optimism with total permits +1.6% MoM and -0.2% YoY with single family -2.0% MoM and -0.6% YoY. The South is around 59% of single family and was -3.4% MoM and -0.7% YoY.
Total completions were only -2.1% MoM and +3.9% YoY, but the South had a major move in single family at +12.3% sequentially and +12.5% YoY in a sign of favorable expectations for the season. Single family under construction was down -8.7% YoY and -1.6% as price could be a challenge to keep that pace.

The above chart frames the current 940K for single family starts which was down by -14.2% MoM and -9.7% YoY. Total starts overall was -11.4% sequentially and +1.9% YoY with Multifamily up by +47.8% YoY.
The South region at 56% of single family was down by -17.6% MoM and -14.8% YoY while the West as the #2 region was -15.0% MoM and +3.6% YoY.

The above chart plots total permits and total starts on a Not Seasonally Adjusted (NSA) basis, and we see total permits up for both total and single family. NSA YTD permits were -3.7% for total and -3.9% for single family. NSA is viewed as closer to what is going on in the trenches without the SAAR model assumptions.
For total starts and single family starts on an NSA basis, we see both essentially flat MoM. The YTD NSA starts is only -1.5% for total starts and -5.6% for single family.

The above plots the single family starts by region on an NSA basis. The two largest regions (South and West) were down slightly, the Midwest moved higher, and small Northeast markets ticked up slightly.

The above chart updates running Multifamily starts. At +371K, March 2025 is up by 0% sequentially and up by +47.8% YoY. The 371K is above the long-term median of 338K, above the median from Jan 2009 to current (346K), and above the median from 2000 to 2008 (296K). The 1960s was a boom period for multifamily with the postwar explosion of urbanization.
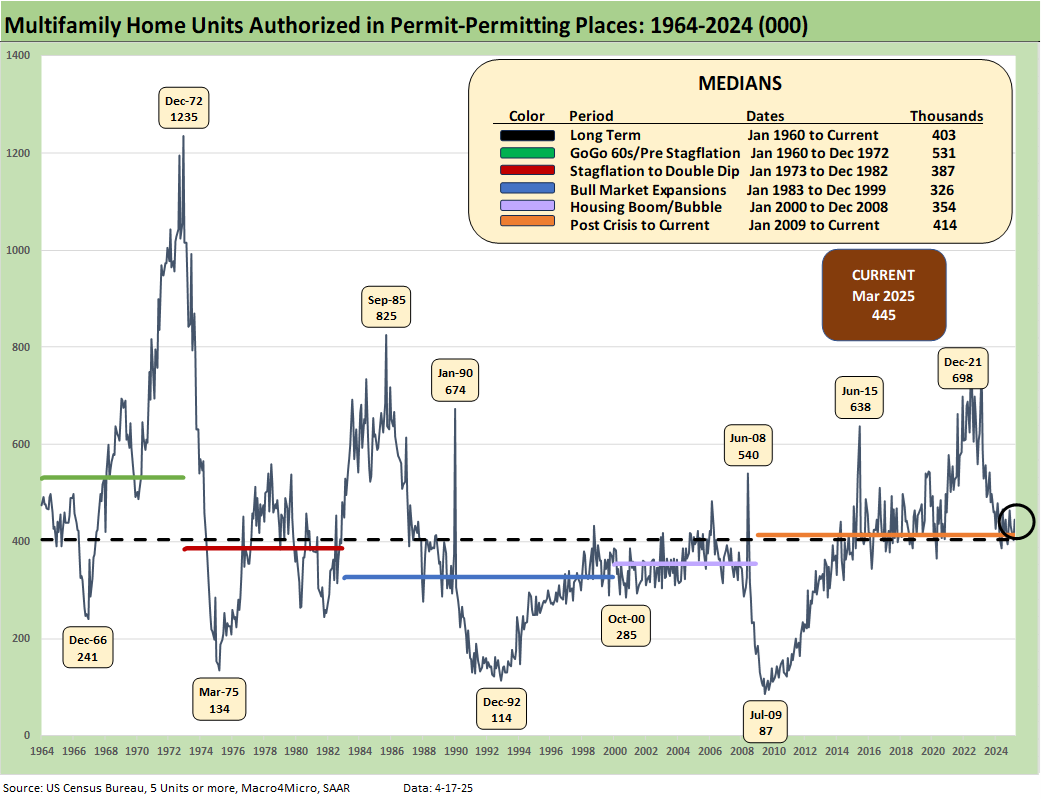
The above chart updates Multifamily permits. The 445K is up by +10.1% from Feb 2025 MoM and down by -0.9% YoY. The YTD change on an NSA basis (not shown) is -4.9%.
See also:
Credit Snapshot: Service Corp International (SCI) 4-16-25
Retail Sales Mar25: Last Hurrah? 4-16-25
Industrial Production Mar 2025: Capacity Utilization, Pregame 4-16-25
Credit Snapshot: Iron Mountain (IRM) 4-14-25
Footnotes & Flashbacks: Credit Markets 4-13-25
Footnotes & Flashbacks: State of Yields 4-13-25
Footnotes & Flashbacks: Asset Returns 4-12-25
Mini Market Lookback: Trade’s Big Bang 4-12-25
Tariffs, Pauses, and Piling On: Helter Skelter 4-11-25
CPI March 2025: Fodder for Spin 4-10-25
Credit Snapshot: Avis Budget Group (CAR) 4-9-25
Payroll March 2025: Last Call for Good News? 4-4-25
Payrolls Mar 2025: Into the Weeds 4-4-25
Credit Snapshot: AutoNation (AN) 4-4-25
JOLTS Feb 2025: The Test Starts in 2Q25 4-2-25
Credit Snapshot: United Rentals (URI) 4-1-25
Housing:
Existing Homes Sales Feb 2025: Limping into Spring 3-20-25
Housing Starts Feb 2025: Solid Sequentially, Slightly Soft YoY 3-18-25
New Homes Sales Jan 2024: Homebuilders Feeling Cyclical Signals? 2-26-25
Existing Home Sales Jan 2025: Prices High, Volumes Soft, Inventory Up 2-21-25
Housing Starts Jan 2025: Getting Eerie Out There 2-19-25
New Home Sales Dec 2024: Decent Finish, Strange Year 1-28-25
Existing Home Sales Dec 2024: Another “Worst Since” Milestone 1-24-25
Housing Starts Dec 2024: Good Numbers, Multifamily Ricochet 1-17-25
Homebuilders:
Credit Snapshot: Lennar (LEN) 4-15-25
Credit Snapshot: Taylor Morrison Home Corp (TMHC) 4-2-25
KB Home 1Q25: The Consumer Theme Piles On 3-25-25
Toll Brothers 1Q25: Performing with a Net 2-20-25
Credit Crib Note: Lennar Corp (LEN) 1-30-25
D.R. Horton: #1 Homebuilder as a Sector Proxy 1-28-25
KB Home 4Q24: Strong Finish Despite Mortgage Rates 1-14-25
Toll Brothers: Rich Get Richer 12-12-24
PulteGroup 3Q24: Pushing through Rate Challenges 10-23-24
KB Home: Steady Growth, Slower Motion 9-26-24
Lennar: Bulletproof Credit Despite Margin Squeeze 9-23-24
Credit Crib Note: PulteGroup (PHM) 8-11-24
Credit Crib Note: D.R. Horton (DHI) 8-8-24
Homebuilders: Updating Equity Performance and Size Rankings 7-11-24
Credit Crib Note: KB Home 7-9-24
Lennar: Key Metrics Still Tell a Positive Macro Story 6-20-24
Credit Crib Note: NVR, Inc. 5-28-24
Toll Brothers: A Rising Tide Lifts Big Boats 5-23-24
Credit Crib Note: Taylor Morrison 5-20-24
PulteGroup: Strong Volumes, Stable Pricing 4-24-24
D.R. Horton: Ramping Up in 2024 Despite Mortgages 4-19-24
D.R. Horton: Credit Profile 4-4-23