
Footnotes & Flashbacks: Credit Markets 4-21-25
A strange headline week with a mixed econ data saw spreads rally with earnings underway and investors awaiting tariff color.


Trump’s backup candidates for Fed chair
Yield curve relief combined with a spread rally to support total returns for bonds with higher quality credit returning to positive total returns for 2025 YTD even with HY still slightly negative in total returns YTD.
The rally coincided with a mixed readings on the macro side while renewed attacks on Powell by Trump keep macro asset allocators on edge and sea level industry watchers worried that they have even more top-down worries beyond tariffs and currencies and could face a fresh UST steepening if executive branch behavior goes off the rails.
HY spreads ended the week only +79 bps wider for the rolling month after a wild ride wider and the +157 bps rolling 1-month widening seen earlier this month.
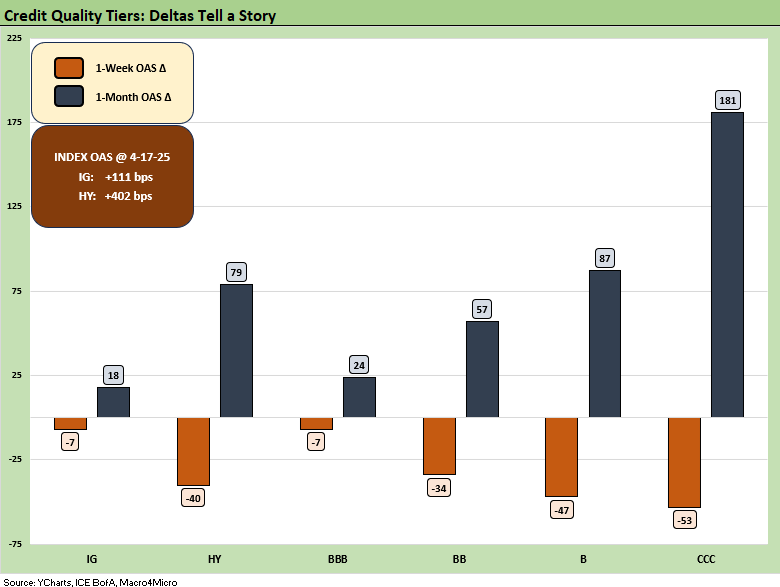
The above chart updates the running 1-week and 1-month credit deltas across IG and HY and for the BBB to CCC tiers. The recent relatively good news on tariffs (absence of horrible) sees respectable tightening in IG and HY at -7 bps and -40 bps, respectively as of Thursday’s close. The recent rally continues to chip away at the recent spread whipsaw that brought HY spreads from +305 bps in late March (3/24) to +461 bps as the initial tariff news shocked and back to the +402 bps level. Tariffs continue to leave a dark cloud over the market as they impact the market later this year and this past week did not help (see Ships, Fees, Freight & Logistics Pain: More Inflation? 4-18-25).
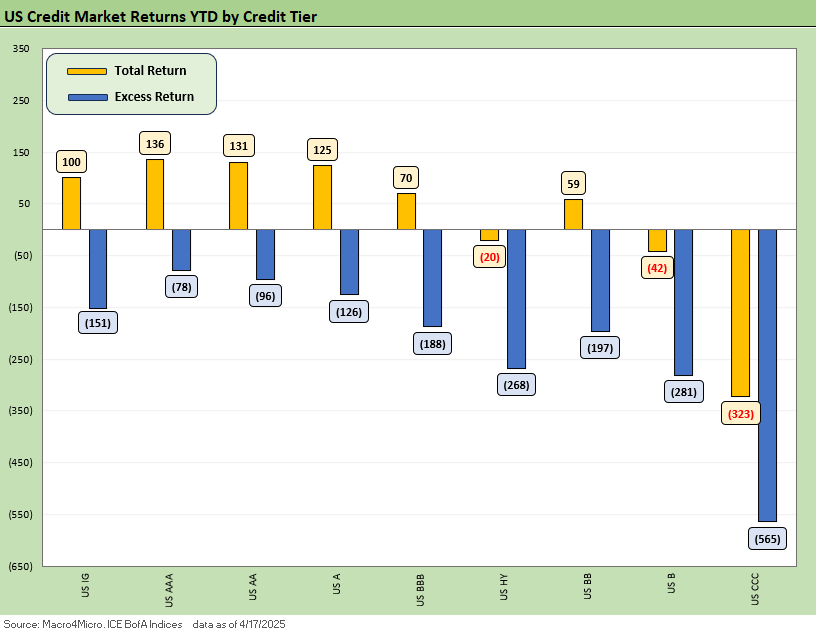
Total returns and excess returns for HY and IG both rallied across the board this past week with the curve working in tandem with tightening spreads. The US IG total returns moved back to positive for the year with BB total returns also eking out a positive. However, the tariff-driven adverse spread movements still rule the roost in excess returns with all tiers still negative in excess returns.

IG spreads ended the week -7 bps tighter to +111 bps as Bank earnings saw strong results in a volatile 1Q25. IG Banks followed suit across the week coming in -8 bps tighter with little sector differentiation in the modest rally.
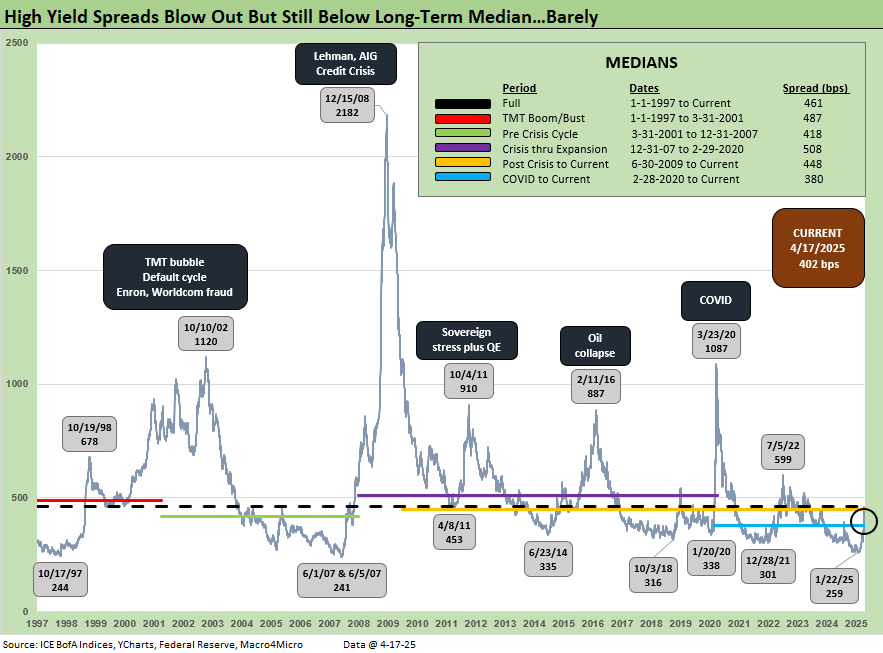
A decent week for risk overall and HY narrowly now with HY recovering -40 bps to the +402 bps mark, a level comfortably below the long-term median. The current levels remain vulnerable after the recent whipsaw brought spreads over +100 bps wider in short order from late March to early April.
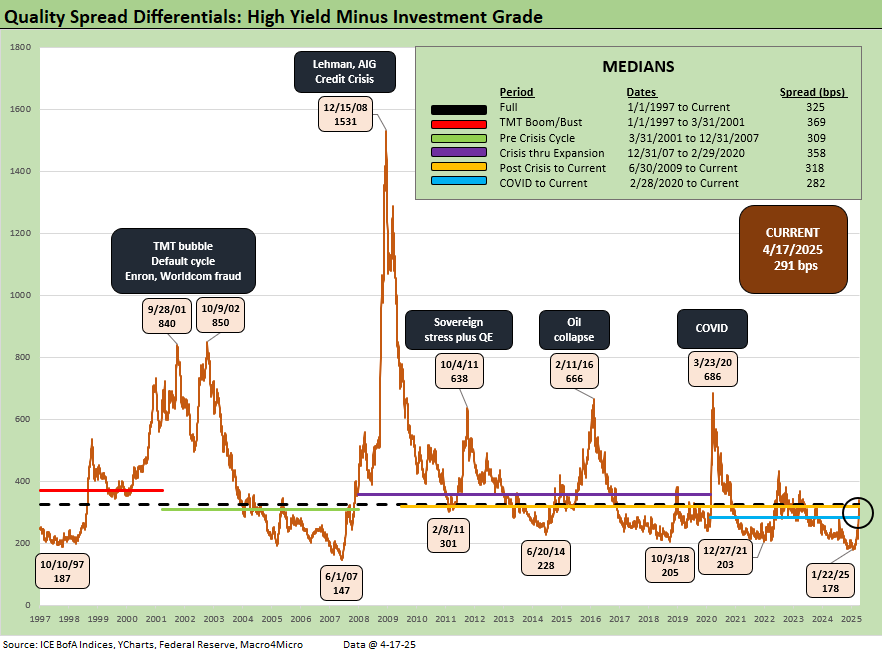
The differential between HY OAS and IG OAS (quality spread) moved -17 bps since last Friday close with the risk rally driving compression. This is moving back towards a post COVID median that reflects the trend of a lower quality IG market and higher quality HY market in recent years.

The “BB OAS minus BBB OAS” quality spread differential narrowed -13 bps to +119 bps from +132 bps last week. The current level remains just below long-term medians but still more than double from its earlier low in 2024.

The BB tier compressed -20 bps since last Friday down to +258 bps and now back down -40 bps vs. the long-term median and right back to the post-COVID median.

The B tier saw a -29 bps spread tightening since last Friday in line with the broader credit rally this week. The tariff whipsaws this month saw spreads above the long-term median at +486 bps but now returns to modestly below that +466 bps median level.

The B vs. CCC tier OAS time series is plotted above. The timeline for B and CCC spreads highlights the points of major divergence along the way (see The B vs. CCC Battle: Tough Neighborhood, Rough Players 7-7-24).
The current CCC tier OAS at +1039 bps tightened by -37 bps the past week and remains above the long-term median of +953 bps. It comes as no surprise that the tariff chaos and potential economic damage could be another moment of B vs. CCC divergence as we wade further into this mess.
The yield to worse is above the 14% line at 14.34% and widely dispersed across a 78.55 composite dollar price. The CCC tier is about equity risk returns with such yields at this point. The CCC exercise is an issuer-specific case of capital structure selection as well as issuer relative value research. Subject to how these tariffs play out and how the stagflation wildcard unfolds, the distressed players are warming up.

The shorter timeline from Jan 2022 just ahead of the end of ZIRP and start of the tightening cycles gives better granularity on the movements from a low of +659 bps in Jan 2022 to a peak of +1226 bps in July 2022 and 1289 bps to end Sept 2022 down to the Jan 2025 tights of +690 bps ahead of the recent spike to current levels.

The B vs. CCC tier differential is broken out above with the current +622 bps well above the long-term median and above the distinct segmented timeline with the exception of the TMT HY credit cycle with its +702 bps median.
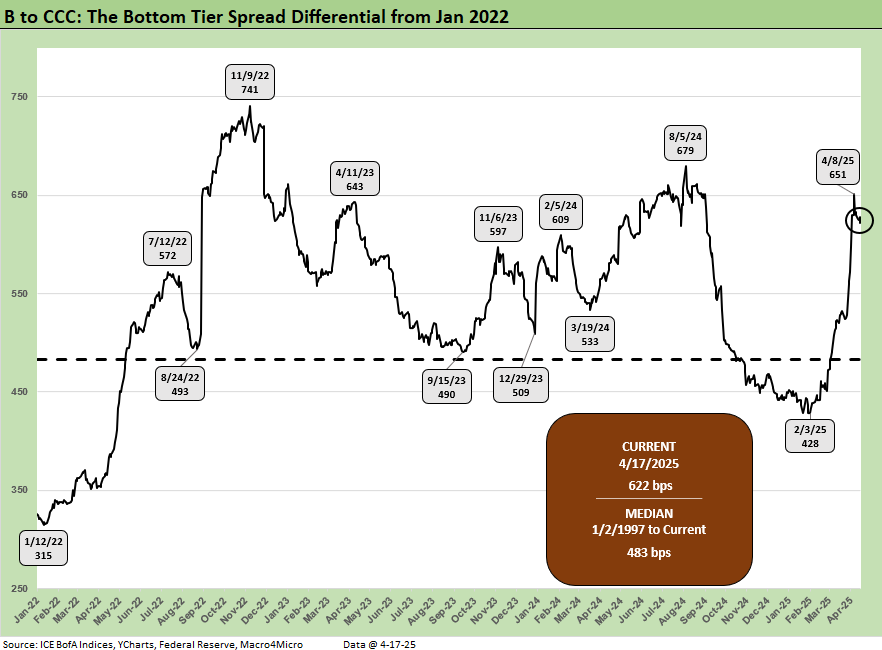
The above chart frames the “B vs. CCC tier” quality spread differential across the short timeline for better granularity. Spreads widened with a vengeance since the low of Feb 2025 at +428 bps even if it has recovered a little.
A look at yields…
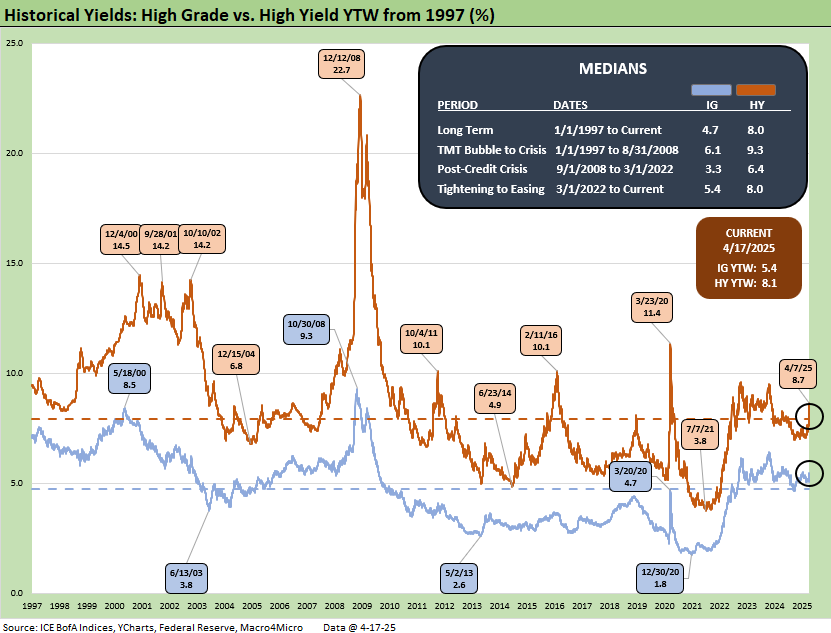
Moving away from spreads, which are a little further below long-term medians this week, yields for both IG and HY have a more complex story in historical context given the post-crisis distortions of ZIRP and “normalization.” The normalization period of Dec 2015 to Dec 2018 never really got on track with the economic weakness and Fed easing of 2019 followed by a COVID crisis and return to ZIRP in Mar 2020.
The current IG YTW at 5.35% (vs. 5.50% last week) has come down on the lower UST curve and spread tightening and are now moving back away from the 6.1% pre-ZIRP median. The HY YTW lowered this week to 8.13% (from 8.59%) vs. a pre-ZIRP 9.3% mark. We consider the pre-ZIRP years the most rational frame of reference in light of the post-crisis ZIRP and QE as well as the COVID Fed reactions.
Spreads will remain a key swing factor for reaching those yield medians of pre-ZIRP years, and we just saw material credit risk pricing action on HY the past three weeks. UST yields are a tougher call with the tariff backdrop that still threatens stagflation as well as a technically driven upward shift on the supply-demand fears.
In theory, old fashioned recession risk would pressure UST rates lower and credit spreads higher, but this is no ordinary cyclical turn. We cover the UST shapeshifting in our separate Footnotes publication on yields as the UST curve rallied this week (see Footnotes & Flashbacks: State of Yields 4-20-25).

The above frames current IG index yields vs. previous credit peaks along with their respective UST curves. We include both prior credit peaks in June 2007 and Dec 1997 for context as prior peak credit cycles when high risk appetites saw investors chasing yields. Those 1997 and 2000 markets saw poor risk symmetry and low spreads.
Today’s curve is still low in those historical credit peak contexts. With stagflation risks back in the mix and the current market beyond the credit cycle peak after the tariffs, the next stretch could see long yields rising as spreads widen out for renewed return pain. The short to intermediate IG market is still the safest bond game for now. The funds that are asset class constrained to HY can take refuge in the higher quality layers.

The final chart does the same 1997 and 2007 drill but for HY index yields. This week’s UST move leaves current HY index yields still in line with prior peak credit cycles at 8.13% vs. 7.96% in June 2007 and 8.60% in Dec 1997. The recent spread widening has moved HY index yields higher than the 2007 peak 1997 peak but below 2007.
The widening early this month gave flashbacks to the volatility and major spread moves of the 1997-98 and 2007-08 periods that also posted triple-digit widening months. The sheer speed of risk repricing has happened in earlier cycles even if those moves were for very different reasons.
The challenge is identifying a fundamental transmission mechanism to more trouble for financial metrics and relative risks of default. Identifying a catalyst for pain now is easy with extreme tariffs hitting the macro drivers (the consumer) and micro drivers (“buyer pays” hits margins or requires hire prices). The tariff shock is unprecedented in modern capital markets, but at least the banks are much healthier. We also see higher quality levels in the HY bond index as a starting point vs. 2007 and the late 1990s TMT bubble years.
Looking back even more, the turn in the credit cycle always comes at some point and often with an external trigger or “assist” that can set it off. During 1990, securities firms started to collapse including Drexel’s Chapter 11 in Feb 1990 and bridge loan related bailouts of Shearson Lehman, First Boston, and Kidder Peabody. We do not face that type of financial intermediary meltdown risk here (at least not yet!).
The summer of 2007 was the start of major problems in the credit markets, but the equity markets and S&P 500 and NASDAQ kept on rallying into Oct 2007. Later in the turmoil and well after the fact, the start of the recession was tagged as Dec 2007 (see Business Cycles: The Recession Dating Game 10-10-22).
The 2007 experience reminded the market that credit leads the cycle and equity lags. The same was true in 1999 with the HY default cycle underway and NASDAQ at +86% that year. This time around, the credit markets did not expect the tariff insanity and is still making up its mind. The real economic effects are more geared to the periods ahead in 2Q25 and 3Q25 when tariffs will be registered at the transaction level. That will be the reality point. We expect HY to stay unhappy and spreads to average wider as the tariffs roll into actual corporate fundamentals.
See also:
Footnotes & Flashbacks: State of Yields 4-20-25
Footnotes & Flashbacks: Asset Returns 4-20-25
Mini Market Lookback: The Powell Factor 4-19-25
Ships, Fees, Freight & Logistics Pain: More Inflation? 4-18-25
Home Starts Mar 2025: Weak Single Family Numbers 4-17-25
Credit Snapshot: Service Corp International (SCI) 4-16-25
Retail Sales Mar25: Last Hurrah? 4-16-25
Industrial Production Mar 2025: Capacity Utilization, Pregame 4-16-25
Credit Snapshot: Iron Mountain (IRM) 4-14-25
Footnotes & Flashbacks: Credit Markets 4-13-25
Footnotes & Flashbacks: State of Yields 4-13-25
Footnotes & Flashbacks: Asset Returns 4-12-25
Mini Market Lookback: Trade’s Big Bang 4-12-25
Tariffs, Pauses, and Piling On: Helter Skelter 4-11-25
CPI March 2025: Fodder for Spin 4-10-25
Credit Snapshot: Avis Budget Group (CAR) 4-9-25
Payroll March 2025: Last Call for Good News? 4-4-25
Payrolls Mar 2025: Into the Weeds 4-4-25
Credit Snapshot: AutoNation (AN) 4-4-25
JOLTS Feb 2025: The Test Starts in 2Q25 4-2-25
Credit Snapshot: United Rentals (URI) 4-1-25