
Credit Crib Note: Lennar Corp (LEN)
We look at the credit risk and fundamental profile of Lennar, the #2 homebuilder, as it morphs its business model with a REIT spin-off.


CREDIT TREND: Stable
We lowered our credit trend assessment of Lennar from Positive to Stable with the pro forma spin-off transaction effects, the renewed climb in 30Y mortgage rates to the 7% area, and concerns around what tariffs and mass deportation might mean for the UST curve indirectly but also what it could mean for supplier chains and labor costs directly.
Lennar kept reducing debt across the tightening cycle even in the face of a sharp rise in mortgage rates to near 8% in fall 2023. The rally to around 6% in Sept 2024 was brief as FOMC easing raised hopes for affordability relief, higher volumes, and lower incentives. The optimism did not last with 30Y mortgage rates moving back to near 7% in recent weeks.
A few major open items were answered in the 4Q24 FY (11-30) release and 10-K and recent filings. We have been getting more details on the Millrose REIT spin-off detailed earlier in an S-11 filing for this newly created REIT that LEN will use for land development and finished lot sourcing. The contribution of over $5 bn to $6 bn of land/lot assets and $1 billion in cash is part of a shareholder reward (i.e. spinoff to shareholders) that will be spun off in early Feb 2025. The Millrose spin is part of a broader shift to an asset light strategy as well as a shareholder enhancement.
The taxable distribution of the Millrose REIT to LEN shareholders constitutes a reduction in balance sheet liquidity and assets but does not change the rock-solid BBB story for what was already an underrated credit. There is no getting around the fact that a net distribution of assets reduces inventory asset coverage even if it lowers business risk. Going forward, total debt to cap is expected to remain below 12% and cash will still exceed homebuilding debt pro forma for the spinoff.
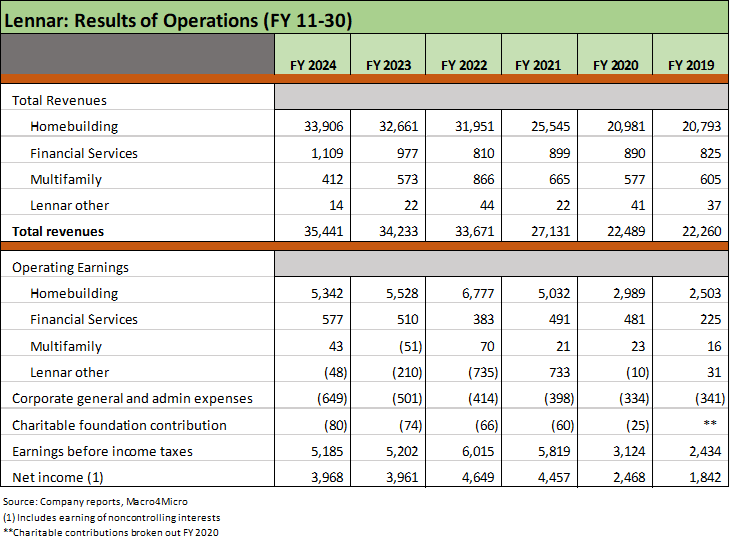
Balance sheet strength has ruled credit trends at Lennar despite lower earnings and lower margins to end FY 2024. While earnings peaked in the 2021-2022 period, LEN has still posted strong earnings in historical context and boasts cash in excess of homebuilding debt. LEN offers a diverse and well-balanced mix of regional exposure after a decade of expansion and M&A activities. The trend line in gross margins is negative on higher costs and financing/price incentives, but the very healthy cash generation and balance sheet still carry the day.

The above equity total return chart starts in early 2020 immediately before the onset of COVID through this week. We compare the #1 (D.R. Horton) and # 2 (Lennar) homebuilders against the Equal Weight S&P 500 ETF (RSP). The builders were notable winners vs. the broad market despite a pandemic, an inflation spike, a tightening cycle and ugly rise in mortgage rates. Along the way, both builders rode the very favorable demographic and demand trends that were set against tight supply. Prices and volumes rose impressively from the pre-COVID levels.
When we look at DHI vs. LEN, DHI came out on top with LEN lagging but in broad strokes they have somewhat tracked each other. That is in contrast to a builder such as Toll Brothers with its distinct product offerings and customer base (see Toll Brothers: Rich Get Richer 12-12-24). We take a broader look at the builder peer group across more key time horizons in a table further below.
The challenges in existing home sales activity helped bolster the major builders as we cover in our housing sector work. The builders have demonstrated how their incentives work in a market with high mortgage rates. The incentive and pricing strategies have allowed LEN and others to drive higher volumes and generally higher average selling prices with the trade-off being incentive costs. Gross margins remain high in historical context even if compressing from the 2022-2021 peaks. High demand, favorable demographics, record payrolls, and constrained supply still rules.
For 4Q24 and expectations into 1Q25 (12-31-24), LEN posted misses on gross margins as incentives increased (buydowns/price) and new orders missed. The builders broadly have been showing modest weakness that has taken their materially outperforming stocks down sharply from the boom in homebuilder stocks seen through the early fall season. The confidence factor is lower now with the tariff and deportation uncertainty and risks of supplier chain disruptions and UST uncertainty. The #1 risk to affordability will be fears of further UST steepening and stubbornly high rates out the yield curve that flow into 30Y mortgages.

The above peer group stock returns are lined up in descending order of 1-year returns, and the builders have generally lagged the broader market after a very strong run through the fall that flowed into a grim trailing 3 months. We see all the builders in the red for 3 months and 6 months. If we look back to Jan 2022 (3 years) ahead of the tightening cycle, the homebuilders performed quite well with the notable exception of LGI Homes with its geographic concentration and lower ASP profile.
OPERATING PROFILE
LEN ranks a close #2 behind industry leader D.R. Horton (DHI #1 by volume and LEN for most recent quarter #1 in dollar homebuilding revenues). LEN is well ahead of #3 Pulte in revenues by a factor of 2x.
LEN arguably possesses the most expansive national footprint across the widest range of price tiers. That scale and breadth was built through acquisitions and organic expansion with the all-stock deal for CalAtlantic (closed Feb 2018) being the pivotal strategic acquisition combining the #2 and #4 builders. CalAtlantic had been created by the Ryland and Standard Pacific merger in 2015 that combined the #8 and #12 builders. LEN’s WCI Communities deal in 2016 enhanced and upgraded LEN’s mix and market position in its home state of Florida.
The most important business profile change in 2025 will be the spin-off of the Millrose REIT operations to shareholders. The Millrose plan marks a continuation of Lennar’s strategy to become an asset light pure play homebuilder. The Millrose REIT strategy will materially reduce the land development activity of Lennar while creating a vehicle that will provide reliable funding and for LEN lower the level of asset-intensity (land/lots, etc.) often associated with homebuilder inventory cycles.
The structure of the Lennar-Millrose relationship is designed to create a combination of a homesite option purchase platform with a REIT, which for its part can be self-funding through cash flow, bank lines, and bonds. The capital recycling process comes after the initial contribution of land and lots-in-process by LEN totaling $5 bn to $6 bn from its inventory and $1 bn in cash. LEN has plenty of cash and inventory, and the idea is that this starts a game clock to grow the Millrose REIT and sets the table for recycled capital flows across time. The Millrose S-11 is a very informative read on the nuances of land banking and the secular changes that could come with Millrose-type structures if they catch on.
The REIT game plan would assure a continuous low-cost and efficient source of funding for land development that can be sold under option programs. The benefit is a smooth and steady process across all types of housing cycles (and the market has certainly seen diverse housing cycles across the decades). Option fees and exercises by LEN comprise the recurring cash flow cycle for Millrose, who can build out their own balance sheet and grow – in theory.
FINANCIAL TRENDS
Cash exceeding total homebuilding debt is clear enough, but the asset coverage of debt based on the ratio of inventory to total debt has been exceptionally high even after the plans to spin out a substantial base of inventory and land assets as part of the spinoff of the Millrose REIT. The excess asset coverage at LEN has room to maneuver on behalf of shareholders while still maintaining a rock-solid BBB tier credit risk profile.
The fact that assets are being spun off is a de facto negative for asset protection of debt, but the longer-term business risk “X-factor” is a partial offset. That distribution is why we downgraded the LEN credit risk trend from positive to stable, but the interests of credit quality longer term (risk symmetry across cycles and earnings exposure) is a balance. We have seen an evolution of the homebuilder strategies in taking asset risk through lot options and reduced land development exposure, and the Millrose plan is the next evolution.
The legacy balance sheet advantage left LEN many options as the industry remains in an uncertain monetary cycle and a mortgage rate backdrop that has swung in a 200 bps range since the fall of 2023. The liquidity fundamentals of the homebuilder working capital cycle positions LEN to sustain very high rates of free cash flow generation even if demand weakens in 2025 and drives inventory liquidation.
In the weeds of the Millrose spin-off, the cash contribution will help fund an acquisition by Millrose of additional land assets that are part of LEN’s Rausch Coleman deal. For a frame of reference, the contribution of over $5 bn rolls up under the current inventory owned by LEN at 11-30 totaling over $15.6 billion. Of that, $10.8 bn was finished homes and construction-in-progress.
The pressure on the homebuilders in the post-COVID period was mostly about mortgage rates after 2022 and supplier chains earlier in the cycle (2020-2021). The challenges cut across affordability (monthly payments) and construction costs (supplies, labor, and building cycles). The pricing power of homebuilders was evident very quickly.
Across the inflation spike and ensuing Fed tightening cycle, the industry clearly and unequivocally demonstrated its resilience and earned a lot of new, favorable opinions on how high mortgage rates can be navigated. The very successful use of incentives by major builders leaning on financial services business lines has made all the difference.
Supply chains and construction cycles were under duress during COVID and demand was rising with home starts hitting a peak in 2020. The inflation tightening cycle later took a toll, but the financial results and credit profile of LEN showed steady improvement along the way until the recent margin pressure.
Gross margins on home sales for LEN peaked at 27.5% in FY 2022, up from 19.6% in FY 2019 but have since tailed off to 22.3% in FY 2024 with 4Q24 down to 22.1% with 1Q25 guiding to below the 20% line to a possible 19% handle.
The ace in the hole for the industry has consistently been about favorable demographic and supply-demand imbalances that support the builders over existing home supply. It also played to the incentive advantages of builders with their ability to engage in mortgage buydowns and fee relief through their mortgage operations. Incentives are an expense, however, and that eventually gets reflected in margins.
Unrealized losses in the “Lennar Other” segment moved lower again in 2024 after declining sharply in 2023. That followed the downward move in valuations during 2022 that saw some payback for the soaring mark-to-market valuations in 2021.

In a “price x volume” business, LEN has shown plenty of volume growth across the cycle from 2019 through 2024 as detailed in the table above.
We see all 4 geographic segments at highs in FY 2024 and the total deliveries also at a high for FY 2024, but the 4Q24 fade saw deliveries fall by -6.7% and new orders missed the low end of guidance by around -11%.
That poor performance by the #2 builder and its 11-30 fiscal year set the tone for the calendar year reporters as builder equities took a beating to wind down the year. We saw the Homebuilder ETF generate a -14.8% Dec and a -16% rolling 3-months after a very strong period in 2024 into late Sept (see Footnotes & Flashbacks: Asset Returns for 2024 1-2-25).
The strategic focus on “steady state volumes” and “even flow production” to improve pace and to “meet the market where it was” was part of the game plan to focus on inventory turns and cash flow generation and even to use “margin as a shock absorber.”
LEN’s priority is moving more volumes and executing on a disciplined, consistent working capital management plan. The asset lite strategy will now include using the REIT spinoff as a source of capital that can be a major and reliable supply base for its lot and land development needs.
The big leap in 2021 volumes came alongside extremely low mortgage rates and a strong consumer upswing coming out of COVID with ZIRP and pent-up demand that has been covered in our macro work and housing sector research along the way.
As we cover in many of our housing sector and single name builder commentaries, the affordability stress started to pick up with mortgage rates racing higher across the 7% line and close to 8% in fall 2023 as monthly payment pain was feeling the effects of higher home prices since 2019 on supply-demand imbalances.

Average sales price (ASP) for each geographic reporting region is broken out above, and we see FY 2022 as the peak for ASPs in total and for each geographic segment (ex “Other”).
The ASP trends by region are self-evident in the total roll-up of ASPs with the declining total ASPs a function of product tier shifts and regional mix across the time horizon.
Incentives serve as a cost that comes out of margin, and the focus on cash flow by LEN remains the plan even if the equity market tends to fixate on home sales gross margins. The flexibility in cash flow is an intrinsic positive for credit quality, and the inevitable decision on the scale of buybacks is important to shareholders in a homebuilding market under volume pressures and affordability setbacks as we roll into 2025.
FY 2022 was the peak inflation period that saw the most aggressive moves by the Fed in the tightening cycle after the end of ZIRP (March 2022). LEN still showed a solid year given lag times on contracts and closings.
The UST rose to a peak 10Y UST in Oct 2023 when the market saw the peak mortgage fallout for 30Y mortgages near 8% (see Mini Market Lookback: Policy Blitz Formation 1-25-25).
The mixed curve performance in 2024 saw 30Y mortgages move back closer to 6.0% by Sept, which supported volumes when taken in tandem with the use of incentives ranging from mortgage buydowns to fee relief and price discounts. That move lower in rates quickly moved back to the 7% area on the US bear steepener further out the curve.

The above table shows the geographic segment gross margin history in % terms and the net margins in dollar terms. The 4 major segments cut across East, Central, Texas and West. The West and East are the biggest earnings drivers.
The peak margins across the homebuilders generally are posted in the 2021-2022 time horizon depending on their contractual lags.
The above shows the more notable % margin compression from the peaks are evident in the West and Texas. During that period, Texas saw a sharp rise in volumes and materially lower prices while the West saw a modest rise in volumes with a notable decline in ASPs. The mix shifts can be a function of product tiers (community mix) or metro regions.
The margin pressure and LEN’s approach of “pricing to the market” and focusing on “steady state volumes” along with maximizing inventory turns to drive cash flow ends up coming out of margins.
LEN used phrases such as “solving to volume” and “avoiding inventory buildup” in its descriptions of faltering margins relative to expectations with the 20% area being in a range that is a few points below the past two fiscal years. Such margins would look more like 2019 levels, but the very low leverage, higher inventory turns, the evolving asset light model, and healthy cash flow fundamentals still make for a very strong credit profile.

The trend over the past 5 years is clear enough in the very impressive reduction in gross debt, the net cash position of the net debt line, and minimal total debt leverage. The move from $6.5 billion of net debt to end 2019 to $2.4 bn of net cash at the end of 2024 makes a statement on financial flexibility and cash generation across a period of record stock buybacks.
LEN has reduced total homebuilding debt by $5.5 bn since the end of 2019 through the end of FY 2024 while giving LEN the ability to create the Millrose REIT with a large scale inventory contribution plus cash. The cash will fund additional land acquisitions before Millrose has even moved to take on its own debt (a $1 bn revolver is in process).
LEN has been able to balance credit quality with stock buybacks and dividends and has repurchased almost $5.9 billion in shares from 2021 to 2024 while executing on over a 70% reduction in debt. At the same time, LEN has sustained a high base of inventory.
Total debt % capitalization at 7.5% is a rock-solid balance sheet even before netting cash against the total. LEN has indicated it expects to keep debt/cap below 12% even pro forma for the Millrose spin-off.
Owned inventory coverage of total debt of 6.9x is a lot of asset protection even without even taking into consideration other asset values. The cash + inventory coverage of 9.0x is up from 2.4x at the end of 2019.
The mortgage loan warehouse facilities in the Financial Services operations are non-recourse to LEN.
As discussed in the earlier sections of this report, the Millrose REIT spin-off will dominate the balance sheet “optics” at LEN in coming quarters as the asset distributions show up in the line items and investors take note of the new strategy and how it flows into the cost structure. The inventory/land contribution to capitalize Millrose is around 1/3 of the 4Q24 inventory balance based on what LEN has disclosed.
HIGHLIGHTS AND HISTORY
Lennar is the #2 homebuilder by volume behind D.R. Horton with LEN posting more than twice the home sales $ revenue of #3 Pulte. Like DHI, LEN is important for its scale and breadth with an asset mix and operations serving as a useful microcosm of the bigger macro picture for the housing sector.
The #1 (DHI) and #2 (LEN) builders are more than 3x the #5 ranked builder (NVR) based on the most recent quarterly revenue run rate, underscoring the relative concentration of the major builders while raising the potential for more consolidation ahead.
LEN historically has been the most complex of the builders given the range of its asset management interests and tech-focused venture investments, but it has taken action to shift more towards its core classic homebuilding operations in recent years.
The LEN asset mix (e.g. tech-based real estate equities) still makes LEN one of the most diverse in terms of its investment strategies.
The shift toward an “asset light” strategy with the Millrose REIT spin-off will continue to evolve the homebuilding operating profile and is consistent with LEN’s goal of becoming a pure play homebuilder.
LEN’s venture equity stakes include a range of publicly traded and private companies across various real estate related businesses. Public equities include Blend Labs (BLND), Hippo (HIPO), Opendoor (OPEN), SmartRent (SMRT), Sonder (SOND), and Sunnova (NOVA). Investment in equity securities get rolled up in the “Lennar Other” segment. Changes in market value of public equities get run through earnings each quarter in mark-to-market adjustments.
LEN owns a major stake in Five Point Holdings, LLC with a carrying value of $471 mn at 4Q24. That asset has been an underperformer since its IPO at $14.00 in 2017 (ticker FPH, closed at $6.04 on 1-29-25). FPH is a major owner and developer of master planned communities in California.