D.R. Horton: Ramping Up in 2024 Despite Mortgages
D.R. Horton sees pretax earnings growth of +23% outpace solid revenue growth of 14% as DHI cranks it up despite mortgage rates.
The market share gains by homebuilders relative to inventory-constrained existing home sales is very much in evidence at D.R. Horton with a high $300K handle average price (lowest of the Top 10 builders) and strong positions in the largest growth markets for housing.
The asset protection metrics (e.g. inventory to homebuilding debt) keeps on climbing while cash falls just short of homebuilder debt.
DHI’s guarantee structure offers bondholders even more protection with the guaranteed homebuilding debt less than half the consolidated debt.
Homebuilding unit cash is only slightly below the homebuilder unit debt balance with homebuilder inventory over 8x homebuilder debt.
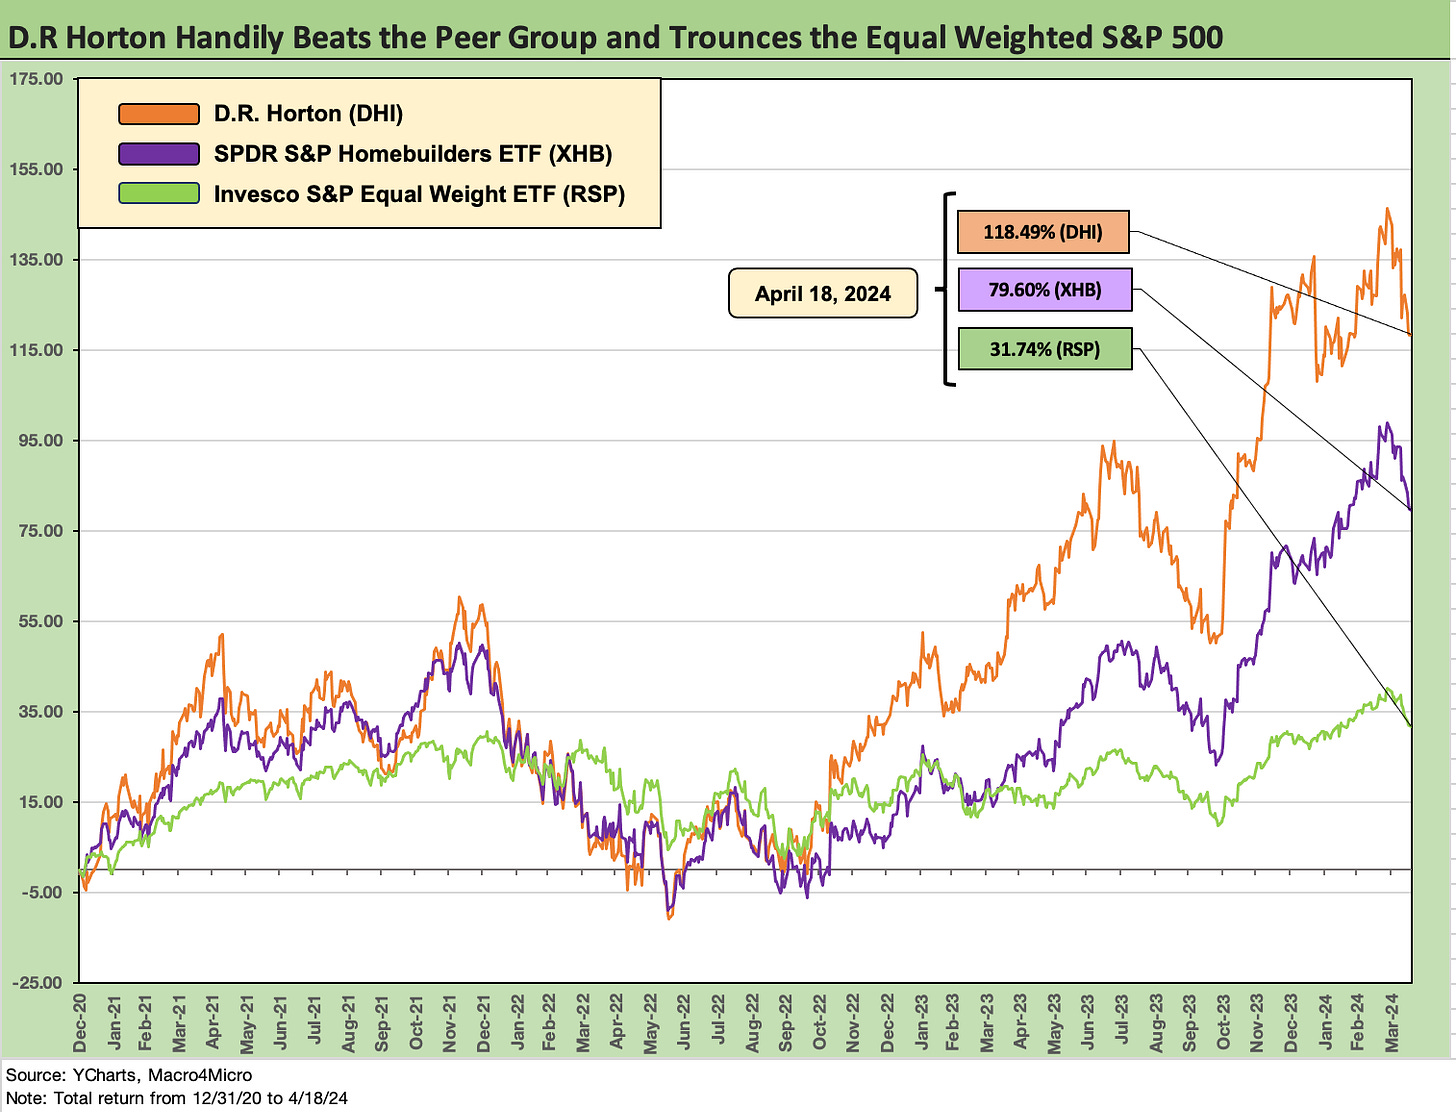
In the above chart, we update the running stock returns of D.R. Horton (DHI) from the start of 2021 when rates were low, the vaccine was available, and demand was high. We frame DHI against the Homebuilder ETF (XHB) and the equal weighted S&P 500 (RSP). Builder outperformance is clear enough. Many have been surprised by how well the homebuilder names broadly have done even in the face of the ugly UST curve action and mortgage rate spike.
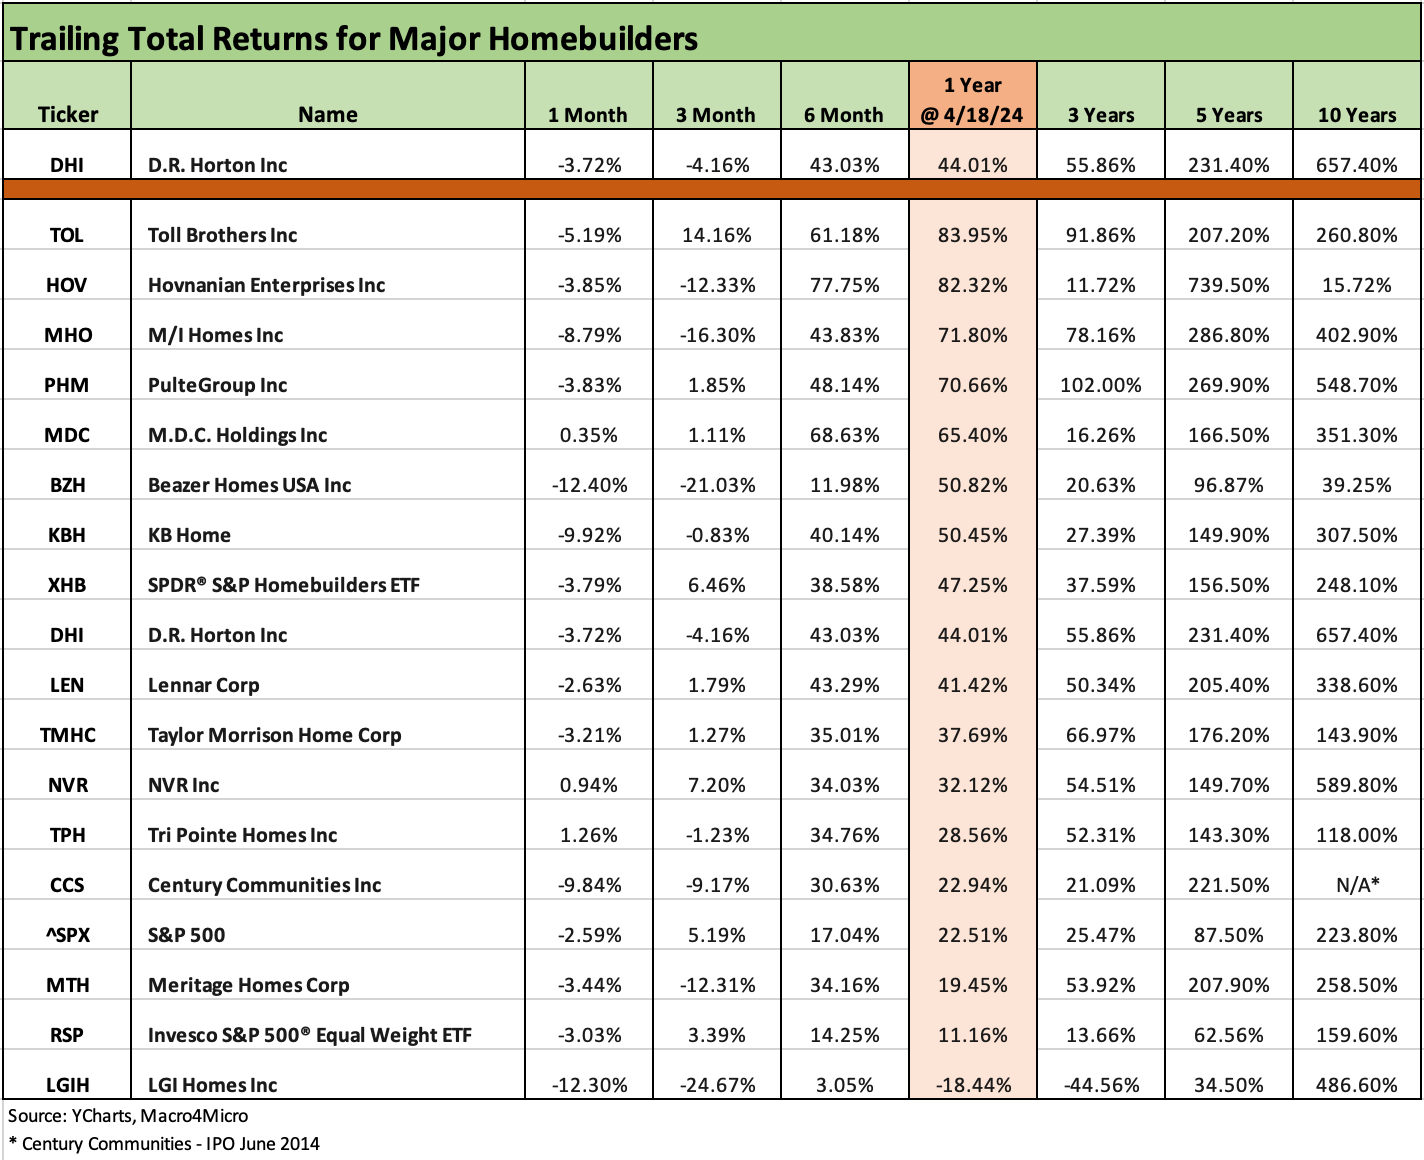
DHI has always been a solid performer as the financially strongest of the major homebuilder pack along with NVR, so the starting dates on measurement matter as we detail below. The mix of steady, larger cap names such as DHI, Lennar (LEN), PulteGroup (PHM), NVR (NVR), and Toll (TOL) stand out below looking back to 5 to 10 years as they are all now investment grade credit quality. We would argue most should be rated higher.
The above updated stock returns for the builder group vs. the broad benchmarks tell a good story about most builders with a few exceptions (notably LGI Homes). The rally of weaker and/or smaller builders over more recent periods is very much in evidence. Some names had been in the distressed bucket in market caps (HOV), but the resilience of the builders has been a fact of the post-crisis period and across COVID.
The demand side of the equation was powered during COVID by the “flight to the suburbs” wave as home starts spiked in late 2020 (see Housing Starts March 2024: The Slow Roll and Ratchet 4-16-24). Supplier chains were a problem and home prices soared with low rates.
DHI is #1 overall and still dominates the lower price tiers…
We have looked at DHI regularly as a useful bellwether of housing sector trends with its market position as the #1 builder and also its strong presence with first time buyers. DHI offers a good microcosm of where the homebuilding sector is heading given its mix of business lines across the emerging single family rental business, its multifamily operations, financial services, and land development (the majority owned Forestar unit).
The single family rental business is an interesting one to watch, but the dominant business remains the single family homebuilding operations. The HB segment stands out for its scale and for the sub-$400K average selling price. DHI’s $376K area average sales price (we await the final official price in the 10-Q) sits at the bottom of the rankings of the Top 10 builders, so DHI also gives a broader look at the “real world” in contrast to Toll Brothers with its $1 million prices.
For its part, Toll offers a useful look at the luxury market, but DHI offers a view of the below median price range that drive its core business. DHI does offer a range of price tiers as broken out in their presentation materials for the quarter, but only 11% of DHI sales are at price points over $500K.
While DHI has distinct reportable segments across 4 major business lines, DHI is the leader of the homebuilding pack (see D.R. Horton: Credit Stronger Even if Stock Takes a Step Back 1-29-24, D.R. Horton: Credit Profile 4-4-23). Lennar ($42 bn in market cap 4-18-24) is a strong #2 in the industry based on sales, but its ambitious acquisition history presents a different profile than DHI ($48.5 bn market cap 4-18-24) as an operating company since so much of the DHI growth was organic and sustained ex-M&A. Pulte is a very distant #3 in revenues but in market cap NVR ($24.4 bn) is #3, just ahead of PHM ($22.5 bn).
The above chart breaks out the revenue for the March quarter (F2Q24) and YTD 2Q24 along with a timeline back to 2019. FY 2019 saw the Fed in easing mode during 2H19, and the economy was getting back on track after a bad year for the markets in 2018 led to some soft corporate investment in 2019. That prompted the Fed to ease 3 times (many don’t remember it that way in an election year like 2024, but just google the FOMC statements of that period). Then came COVID, inflation, and a tightening cycle. That stretch of time brought a wide range of macro conditions to test the homebuilding industry. The major builders definitely passed the test.
For 2Q24, the income statement tells a favorable story. We see +14.2% in total revenues and +13.4% in homebuilding revenues. While we only break out the segment gross profits separately in the next chart for this update, 2Q24 saw all four major reporting units posting increased YoY revenues. The home sales gross profit line rose by 22.1% with gross margins widening to 23.2% from 21.6% in 2Q23. We see the new fiscal year (FY 9-30) off to a good start after a decline in FY 2023 (9-30-23) when the tightening cycle effects were in full swing.
The pretax income mix of the reportable segments shows the Homebuilding operation generating 89% of the pretax income. Forestar is very closely linked to the homebuilding operations and that end market, so that segment is also doing well.
The volume and value mix across homes closed and orders in 2Q24 were quite strong in double digits for the quarter at +14.7% in units closed and +14.3% in net sales orders. For the 6-month YTD period, orders are up just under 22% YoY and order value at +24.3%. Volume and dollars were both very favorable.
Rental pretax income generates lower margins than Homebuilding with its multifamily and single family operations. The revenue mix in rentals saw 1109 single family units sold in 2Q24 and 424 multifamily units sold. Rental property inventory at quarter end was $3.1 billion with $1.3 bn in single family and $1.8 bn in multifamily.
For a sense of scale, that $3.1 bn in rental inventory comprises only around 12% of consolidated DHI inventory ($24.8 bn) with $19.9 bn of inventory in the homebuilding unit.
The balance sheet for DHI needs a few different angles. The consolidated balance sheet is strong by any measure. In framing consolidated financial risk, the homebuilder asset protection is more like AAA quality with home buying cash just shy of total homebuilder debt and homebuilding inventory amounting to 8.4x homebuilder debt.
DHI can invest in growth or shareholder enhancement at will and subject to its balance of priorities. DHI is guiding to $3 bn in cash flow provided by the homebuilding operations with peak selling season ahead and buybacks for FY 2024 at $1.6 bn vs. the $795 million through 2Q24.
We wrap up the DHI update with the key liquidity line items. The operating cash flow used in operations for 1H24 was -$470 mn based on inventory building as noted above. Homebuilding provided $408 mn of cash in that mix. Balance sheet liquidity and the usual homebuilder cash flow dynamics on the other side of the working capital cycle during the peak periods remain exceptionally strong.
With much of the cash flow statement moving around the working capital changes of homebuilding, the dominant lines are stock buybacks with capex relatively small. DHI has been relatively light in M&A activity compared to the #2 player Lennar (LEN). From 2018 through 2Q24, DHI has repurchased $4.9 bn in common. The target for FY 2024 amounts to $1.6 bn with almost half of that done YTD 2Q24. The $1.6 bn guidance was increased with 2Q24 earnings with earnings guidance also shifted upward.
See also:
Existing Home Sales March 2024: Something Old, Not Something New 4-19-24
Housing Starts March 2024: The Slow Roll and Ratchet 4-16-24
New Home Sales Feb 2024: Hope Springs Eternal, but Demand Seasonally 3-25-24
D.R. Horton: Credit Stronger Even if Stock Takes a Step Back 1-29-24
KB Home: Wraps Industry Rebound Year, Exiting on Upswing 1-14-24
Lennar 4Q23:Buyer Buzz, Curve Support 12-15-23
Credit Crib Note: Lennar (LEN) 11-22-23
Pulte: Relative Value Meets “Old School” Coupons 11-15-23
Credit Crib Note: PulteGroup (PHM) 11-15-23
Anywhere and Real Estate Brokerage: Judgement Day 11-2-23
Credit Crib Notes: Toll Brothers (TOL) 9-11-23
Credit Crib Notes: D.R. Horton (DHI) 8-29-23
D.R. Horton: Credit Profile 4-4-23


