
Footnotes & Flashbacks: State of Yields 4-20-25
The UST rally and destructive tariff plan will keep tension rising between the curve, inflation worries, cyclical fear, and FOMC policy.


Hermione, we can’t let him get Powell.
The week (whether the holiday shortened week or the running 5 days) saw the UST rally and bond ETFs benefit, but the bigger debate was around Trump hammering the Fed Chair after the Powell presentation (April 16) at the Economic Club of Chicago. Powell provided a very reasonable, rational analysis and Q&A commentary on the macro backdrop and a range of topics on the role of the tariffs and what that could mean for monetary policy.
Powell discussed the moving parts of tariffs, immigration, the sheer scale in history and its role in forward economic risks. The interview was a case study in contrast with Trump at Economic Club of Chicago: Thoughts on Autos (10-17-24 ). We would recommend checking out the Powell interview and then contrast the content and depth of the Trump Q&A at the Economic Club of Chicago on autos back in Oct. You make the call on which makes sense.
Powell made a constructive case that immigration/deportation would not drive inflation, but Powell clearly cited the risk of higher unemployment and higher inflation with the tariffs and how difficult that is for a policy response. Most of us would bet the ranch Trump did not listen to the Powell whole Q&A (which was quite well done). If he did, he tuned out early and often.
The ensuing rage from the White House included termination threats. The desire to control the Fed takes on new significance given the chaos of tariffs and the poorly executed, inconsistent rollout and apparent lack of conceptual and factual foundation. Other than that, its been smooth sailing.

The above chart plots some key cyclical transition periods from the Carter inversion of 1978 across the Volcker years, the credit cycle peak in 1989, the TMT cycle in 2000, and the housing bubble in 2006. We then jump beyond the crisis period and the ZIRP years with the QE and normalization distortions to the Oct 2023 UST peak date on the 10Y UST. The UST rates now are very low by any historical standard but well off the Sept 2024 lows.
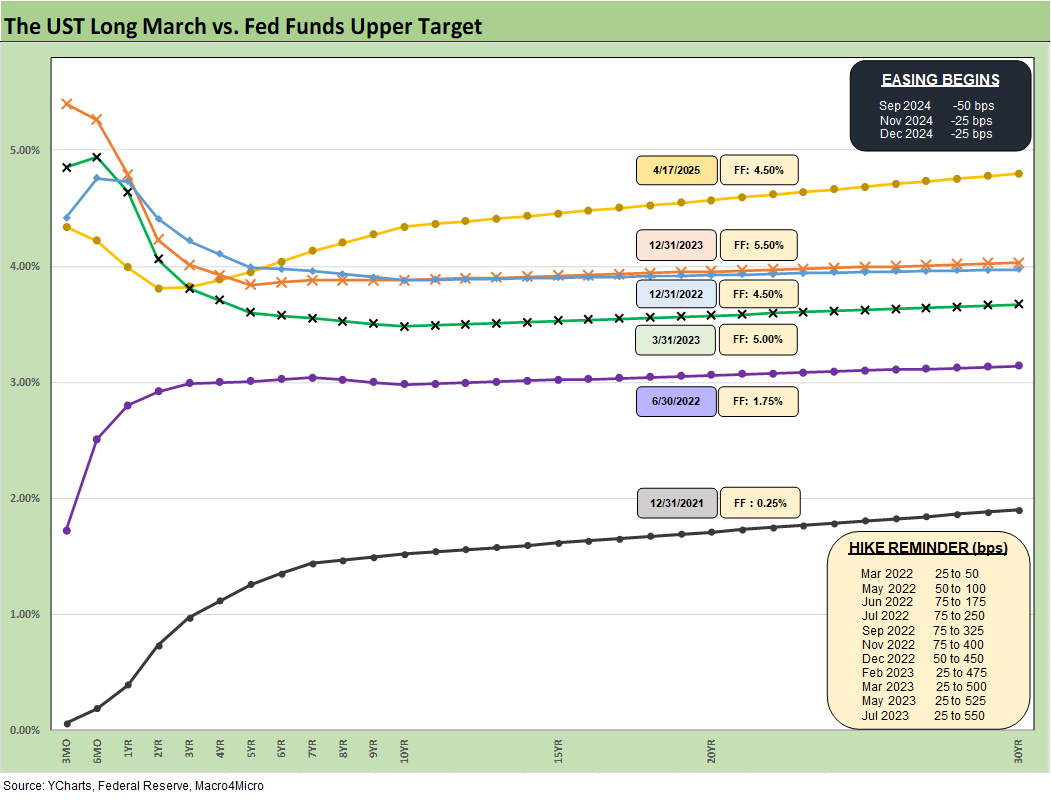
The above replays our weekly chart detailing the migration of the UST curve from 12-31-21 with a memory boxes detailing the tightening dates and magnitude and more recently the easing. The UST curve seems to intermittently mix bear steepening patterns and flattening rallies since the Sept 2024 lows, but fear is creeping into the shapeshifting at this point.
The next few CPI and PCE releases will settle the tariff argument on inflation while the jobs and growth numbers will answer some cyclical questions. The stagflation threat is one the markets have not had to deal with for decades since the 1980-1982 double dip under Volcker. That was a radically different backdrop but also much less globalized and the US was not facing a massive trade war. This is an all-new challenge with a President who thinks the selling country pays the tariff.
The next PCE release is April 30, and that day brings the first advance estimate on 1Q25 GDP. In many ways, the 1Q25 numbers will be old news and pre-tariff numbers but some questions around investment and inventory and early PCE reactions will get answered. We also will see how March outlays are framing up with the PCE release. As 2025 proceeds, if the economic release numbers are weak, you can bet DOGE-like carnage will be moving on to the Census data keepers for broad restructuring. Independent data sources was one of the Project 2025 targets for “consolidation” under like-minded loyalists.
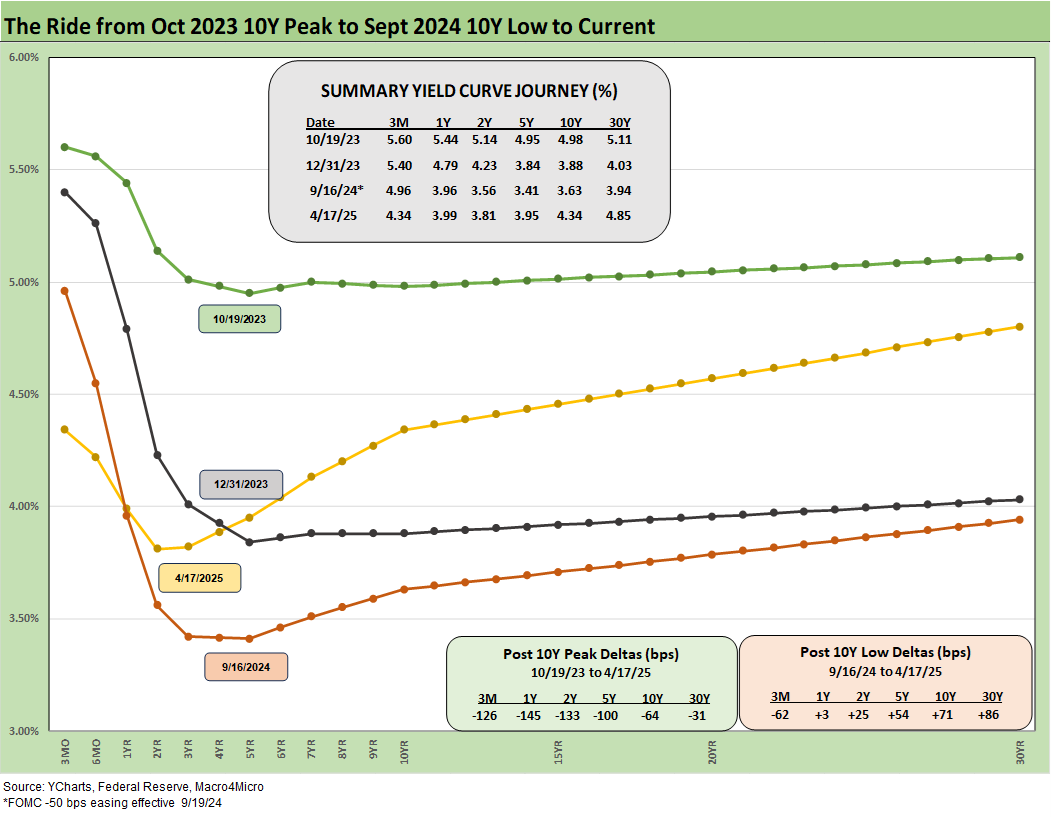
The above chart details the material move from the peak UST curve of 10-19-23 down into the UST bull rally of Nov-Dec 2023 and then eventually into the lows of Sept 2024. The Sept 2024 lows only came after a bear steepener hit the curve through the summer of 2024. We then moved back into the bear steepener mode until the tariffs roiled the UST markets and initially sent 2Y to 30Y lower on cyclical fears.
Rate volatility moved materially higher with the tariffs and the policies sent the markets into fresh debates on UST supply-demand running alongside nerves around dollar weakness in the global market (see Footnotes & Flashbacks: State of Yields 4-13-25). The ensuing chaos and UST and USD volatility drove a Trump reciprocal tariff pause. His impressive discussion on his underlying thought process was that people were getting “Yippy.” We refer you to those earlier Footnotes publications. The volatility still leaves the 10Y UST well inside 2025 highs.

The above chart updates the UST weekly deltas as the 2Y to 10Y posted a rally. The catalysts for a fresh move this coming week will be more about tariff headlines that could get generated by Trump or any trade partners at any time. The past week had some action with the port fees levied against China, which begs a China response (see Ships, Fees, Freight & Logistics Pain: More Inflation? 4-18-25). There is a lot of action still ahead in tariffs and retaliation risk is daunting.
We have a major wave of nonfinancial earnings reports teed up across a range of bellwether sectors as the market puts the bulk of bank earnings behind us. Those were constructive for the big banks. This week we will get a fresh read on asset quality at consumer-oriented financials such as Capital One (COF) and Discover Financial (DFS). The rest of the action includes some of the names we cited in our Asset Returns Footnotes publication (see Footnotes & Flashbacks: Asset Returns 4-20-25).

The above chart updates the YTD bull steepener with the 2Y to 10Y supporting duration even if recent volatility and the inevitable upward pressure on goods prices is on its way as we wade further into the tariff transaction cycle.
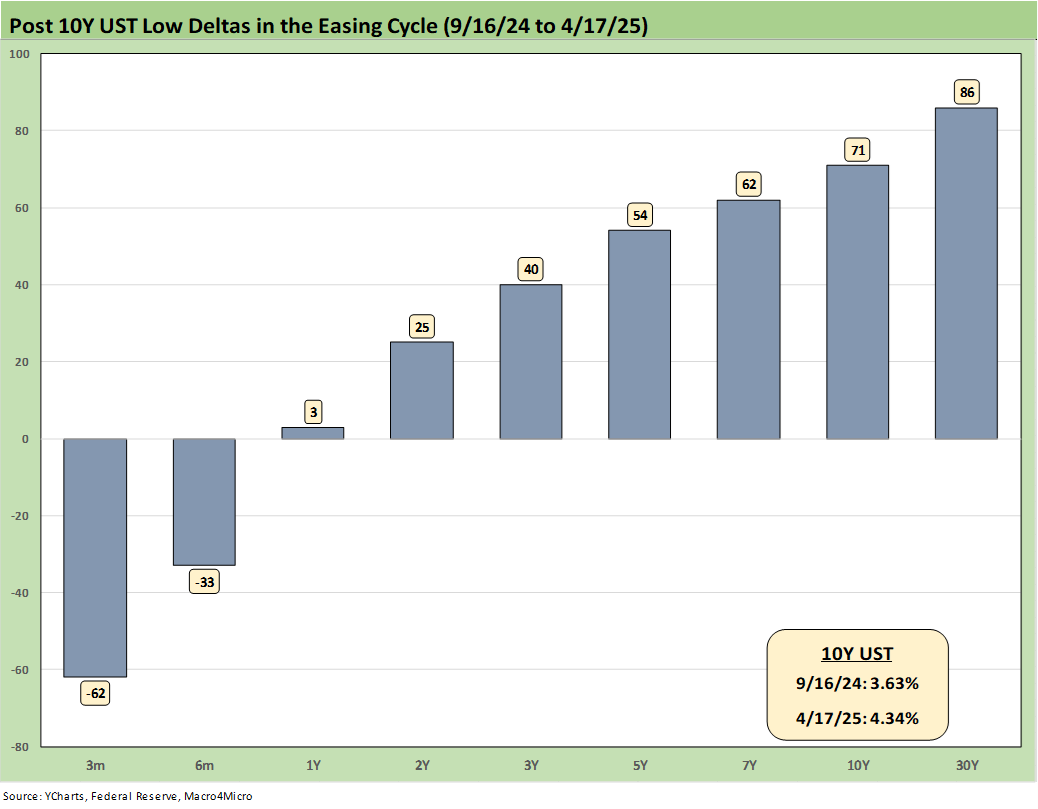
The post-Sept 2024 bear steepener is broken out above. The pressure of the FOMC to ease needs a bad jobs report at the very least to even allow FOMC to navigate toward the other side of the dual mandate.
The inflation side of the Fed mandate vs. the payroll threat is turning into a bit of a game with Trump the only one playing. He wants support from Powell before the market sees that tariffs actually do cause price increases and lower earnings. If Powell moves too early, Trump will get amnesia and blame him anyway for anything that goes wrong. Tough job. People forget Trump was demanding negative rates in Trump 1.0. If payroll weakens Trump will blame Powell. If payroll stays firm, Trump will take credit for that, but he remains exposed on the inflation side. We like to think he knows that prices will rise, but that would blow up his “seller pays” story.

The above chart updates the mixed steepener since the end of 2023 through today with a big rally on the front end and a more restrained upward move in rates beyond 5Y. The end of 2023 saw an impressive rally of the UST curve and combined duration and credit risk home run in Nov-Dec 2023 as detailed often in past commentaries. The longer end of the UST curve has been stubborn as the crow flies despite the fall 2024 rally.

The above chart breaks out the running UST deltas since the peak date of the 10Y UST (10-19-23). Wiping out that 10Y UST delta of -64 bps since the peak in Oct 2023 would take some bad news on inflation or a more sustained erosion of confidence in the US macro picture (weak dollar, erosion of buyers, net sellers, etc.). The weaker dollar is not helping any more than the record deficits and soaring interest bill and UST supply needs.
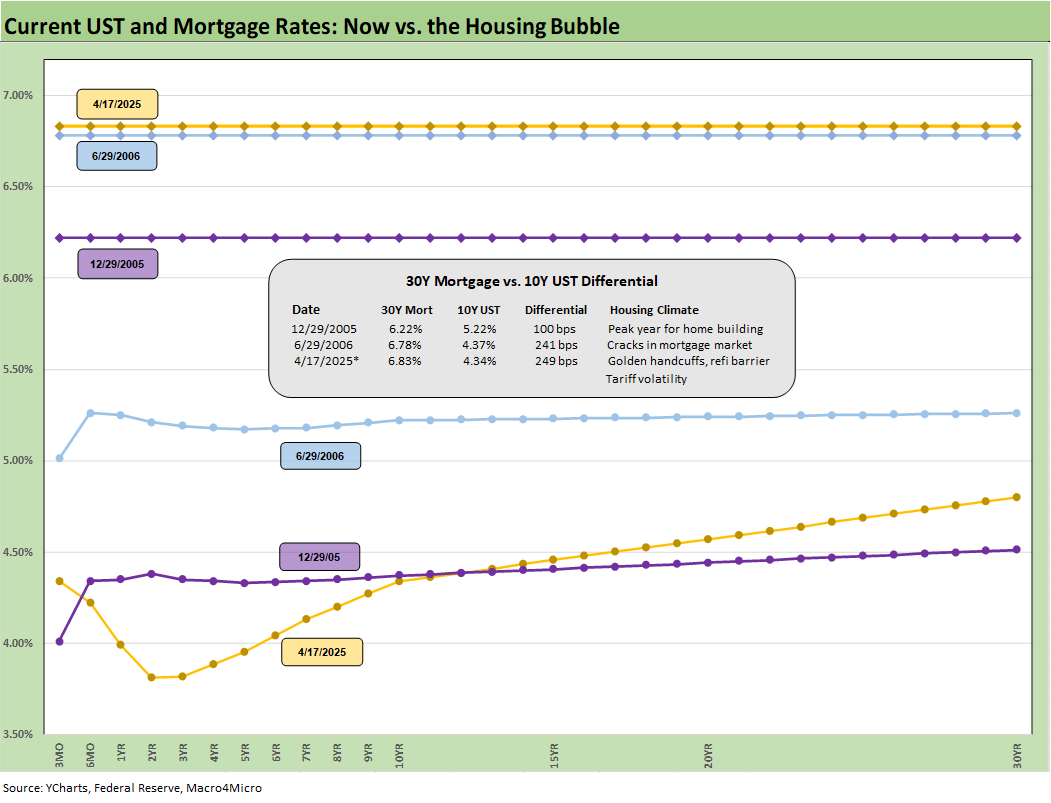
The above chart updates the UST curve for this past Friday and the Freddie Mac 30Y Mortgage benchmark rate (noon Thursday release). We include two useful historical periods including the peak homebuilder year end of 2005 and mid-2006 when RMBS quality concerns were catching headlines as the housing bubble was peaking.
We post UST curves for each period in the chart. We highlight that some useful indicators outside the sleepier Freddie benchmarks such as Mortgage News Daily were just under 7% to end 4-11-25. The past week ended just under 6.9% for Mortgage News vs. 6.83% for Freddie’s noon Thursday pricing. That Freddie rate is up from 6.62% last week as mortgages and the 10Y UST went in different directions. The important distinction for the Freddie 30Y is that mortgage rates were driving higher last week and were at 7% Friday outside of Freddie’s 30Y Thursday noon rate.
We recently added a column detailing the differential between the Freddie Mac 30Y and the 10Y UST. That differential moved higher this week to +249 bps from +214 bps last week after being at +263 bps two weeks ago. The year 2005 makes a statement on what the mortgage market was like back then in terms of originating “anything” and selling to “anyone” to bundle it and resell it to “anyone else.” That of course ended badly.

We update the 3M to 5Y slope as the inversion grew more pronounced from -19 bps last week to -39 bps this week. That is radically different from the long-term median of +108 bps. If the FOMC sees another supportive PCE print plus a bad jobs number (as in negative) there might be room to maneuver. For most rational observers (non-MAGA), there will need to be more data support on the effects of the tariffs before the Fed would pull the trigger at current Core PCE levels (see PCE Feb 2025: Inflation, Income, Outlays 3-28-25).

The above chart shortens up the timeline to a start date in early 2021 during ZIRP ahead of the sharp steepening to +221 bps by May 2022. Then came the tightening cycle and the peak inversion of -197 bps in May 2023.

We wrap this week’s State of Yields with an update of the running UST deltas since March 1, 2022 just ahead of the end of ZIRP (effective 3-17-22). We include the 12-31-20 UST curve and 10-19-23 peak UST curve as frames of reference.
See also:
Footnotes & Flashbacks: Asset Returns 4-20-25
Mini Market Lookback: The Powell Factor 4-19-25
Ships, Fees, Freight & Logistics Pain: More Inflation? 4-18-25
Home Starts Mar 2025: Weak Single Family Numbers 4-17-25
Credit Snapshot: Service Corp International (SCI) 4-16-25
Retail Sales Mar25: Last Hurrah? 4-16-25
Industrial Production Mar 2025: Capacity Utilization, Pregame 4-16-25
Credit Snapshot: Iron Mountain (IRM) 4-14-25
Footnotes & Flashbacks: Credit Markets 4-13-25
Footnotes & Flashbacks: State of Yields 4-13-25
Footnotes & Flashbacks: Asset Returns 4-12-25
Mini Market Lookback: Trade’s Big Bang 4-12-25
Tariffs, Pauses, and Piling On: Helter Skelter 4-11-25
CPI March 2025: Fodder for Spin 4-10-25
Credit Snapshot: Avis Budget Group (CAR) 4-9-25
Payroll March 2025: Last Call for Good News? 4-4-25
Payrolls Mar 2025: Into the Weeds 4-4-25
Credit Snapshot: AutoNation (AN) 4-4-25
Thank you. For anyone interested, here are my Mar PCE estimates: https://open.substack.com/pub/arkominaresearch/p/mar-2025-pce-estimate?r=1r1n6n&utm_campaign=post&utm_medium=web&showWelcomeOnShare=true