
Lennar: Key Metrics Still Tell a Positive Macro Story
With solid revenue and earnings growth and cash in excess of homebuilding debt, Lennar is taking its next steps in the land spin-off plan.


Time to go land light?
While the market awaits more disclosure, Lennar revisited plans to spin off land assets as part of its continued move to a land-light strategy. A draft registration was submitted to the SEC “a few weeks ago” as the market awaits some details.
As of 2Q24, balance sheet liquidity was impressive with $3.6 bn in Homebuilding (“HB”) cash, well in excess of the $2.24 bn in HB debt, with a sequential decline in HB debt of $589 mn that also reduced LEN bond supply in the market and left the “net cash position” at $1.36 bn after deducting the $2.24 bn of HB debt.
Asset coverage of total debt (owned inventory/total HB debt) of 7.2x just piles onto the theme of very low financial risk with $2.24 bn HB debt set against a $27 bn book equity base with a LEN market cap of $41 bn. That inventory coverage number would decline to 5.2x if the land was spun off.
With such a minimal financial risk profile and strong operating performance, the most interesting aspect of Lennar’s latest earnings call involved plans to keep moving to a more asset-light business model to support deployment of capital with the next step involving what was earlier billed after 1Q24 as a taxable spin-off of land to a new entity.
For 2Q24, rising orders (+19%) and higher deliveries (+15%) offset a -5% decline in average sales prices to sustain a stable YoY margin and drive a +10.4% YoY increase in Homebuilding operating income on the way to a +9% increase in consolidated net earnings.

In this commentary, we update the latest results and frame the very strong financial profile of Lennar (LEN). LEN’s next adventure in business mix thus entails a potential land spin-off that has now moved from the idea and exploration stage to a draft registration statement with the SEC. There is not much to be said yet about the land spinoff with a filing pending. Management could not say more in Q&A.
Even without the disclosure, the latest plan comes as part of a move to be more “land light” in its business model and create both a means to less balance sheet exposure and to generate another shareholder distribution plan. Changes in business mix and spin-offs are not new to Lennar. The latest one is a taxable spin, which is different from some earlier ones, including some that did not happen such as the Quarterra spin of noncore rental and multifamily assets.
Lennar equity in peer group context…
The above chart frames the stock performance of Lennar, the #2 homebuilder, and we set LEN against Toll Brothers (TOL) and the Homebuilder ETF (XHB). We start the time horizon at the beginning of March 2022, which was the month that ZIRP ended. The wild inflation rise to a CPI print of over 9% in June 2022 saw a multi-year tightening cycle kick into gear and the UST curve inversion got underway. During 2022, there was a lot of doubt as to how the builders would hold up.
The remainder of 2022 after the end of ZIRP saw Lennar and D.R. Horton among the rare builders able to generate slightly positive stock total returns as the UST migration kicked into gear. Most of the public builders were in negative return range across those months (as was the S&P 500). During 2022, the weaker, riskier names (Hovnanian, Beazer) were slammed as was LGI Homes (LGIH), which was a low ASP growth story about to see a customer growth problem. We saw 11 of the 14 builder names we currently watch post negative returns for this stretch of time from March to Dec 2022.
We usually frame LEN vs. D.R. Horton (DHI), but those two tracked closely over this period from March 2022 to this past week. We thought the comparison to Toll Brothers would highlight how well a builder with a $1.0 million average sales price is doing in this market. The net upshot is that the rich get richer, especially when you can pay cash or put 30% down and afford the monthly payments. TOL is clearly outperforming since March 2022 and is the top performer looking back over the past 1 year and 3 years as detailed in the next chart.
The poor performance of the builders in absolute return levels in 2022 (though not poor in relative terms vs. benchmarks) was before the dazzling homebuilder rally of 2023-2024 as the market saw firsthand how the builders could navigate in a market with overwhelmingly favorable supply-demand characteristics, demographic tailwinds, and record payroll counts looking for places to live.
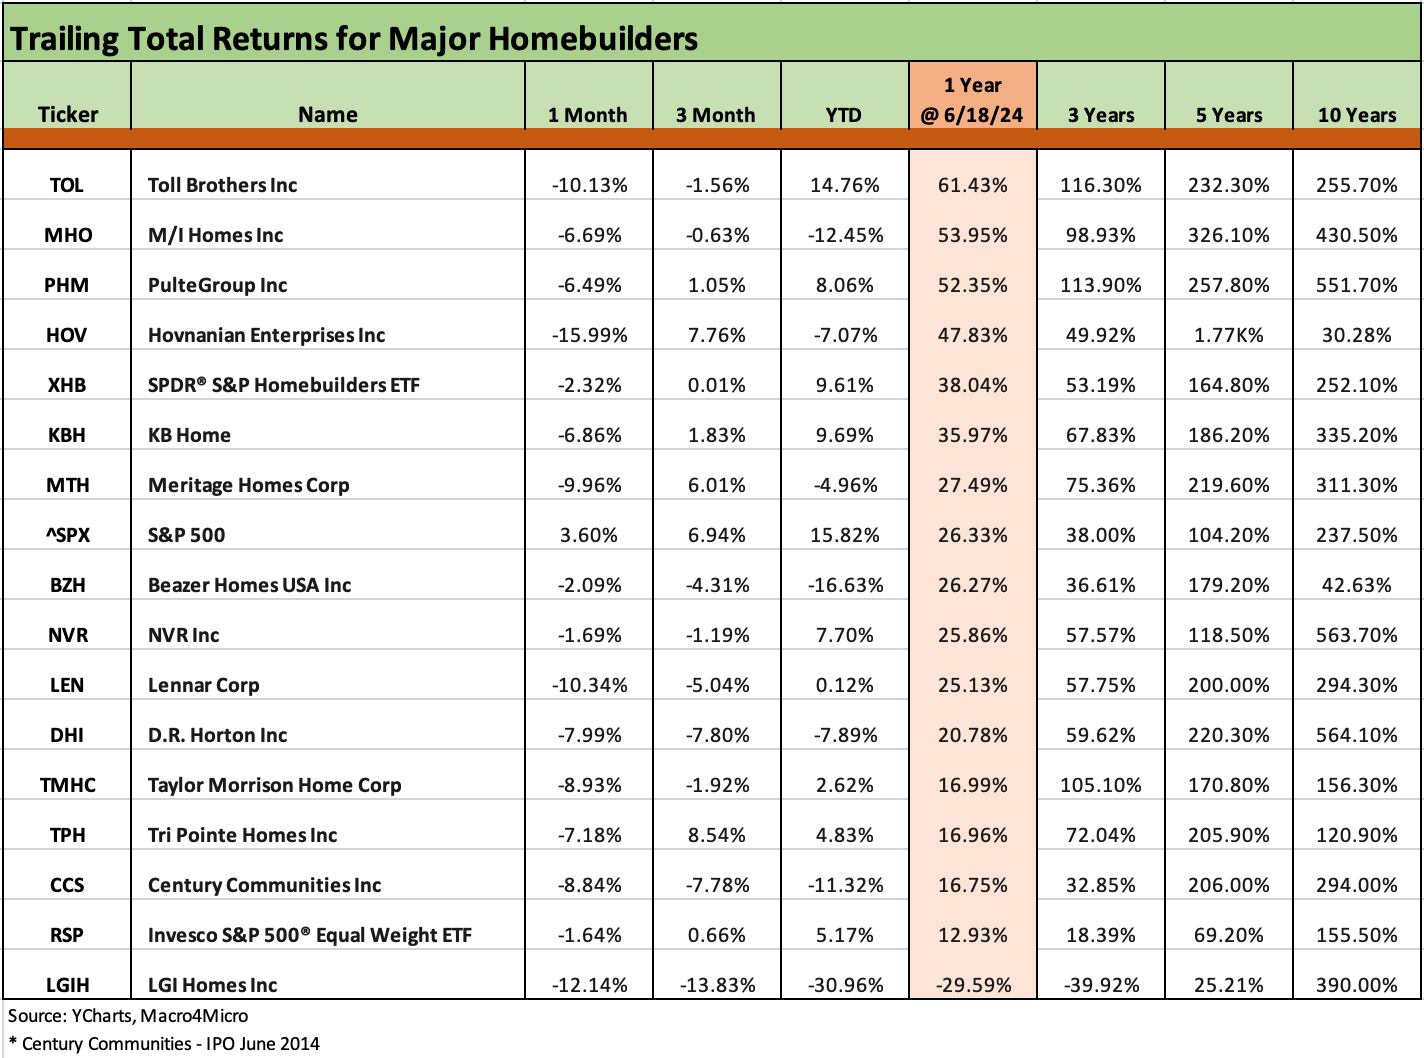
The stock comp chart above lines up the total returns for builder equities across a range of trailing time horizons. We compared the builders to the Homebuilder ETF (XHB) and two broad market benchmarks in the S&P 500 and the Equal Weight S&P 500 ETF (RSP). We line them up in descending order of total return for the trailing year. All the builders except LGIH beat the Equal Weight S&P 500 ETF (RSP) while the market cap weighed S&P 500 was just above the median of the table for LTM. Most of the builders beat the S&P 500 looking back 3 years.
As we cover in the earlier chart at the start of the commentary, it is notable that the #1 performer over 1-year and 3-year horizons (TOL) is the one with the highest price ASP in its luxury segment tier. The builder in last place for the past 1-year and 3-year horizons is the lowest price builder, LGI Homes (LGIH). That relationship on the bottom was predictable and a sign of the times around how the lower end of the consumer tiers face the worst punishment from inflation in relative household cash flow but also given the impact of mortgage rates and monthly payment affordability.
High mortgage rates have been tough on the entry level segments and first time buyers as we cover in our regular housing sector work whether new homes or existing homes. The monthly payments have priced many out of the market even independent of the ASP increases from the pre-COVID period.
Interest rates are the critical monthly payment driver – not ASP. DHI can keep doing well despite being a low ASP homebuilder since DHI has a full arsenal of incentive tools at its disposal to help subsidize customer demand and drive profitable homebuilding activity. LEN’s ASPs are not as low as DHI (see Homebuilders: Average Selling Prices by Company 2-17-23), but the same rule applies in LEN’s performance. LEN also sells a lot of low-price homes and notably in Texas.
The chart above shows very mixed equity performance results for the various builders in recent months. We see some waffling for 1-month and 3-month periods at a time when the broader markets are hitting records (see Footnotes and Flashbacks: Asset Returns 6-16-24).
The next leg of the business line journey with land spin-offs…
The LEN spin-off ideas on land were discussed on the 1Q24 call (Feb 2024 quarter), but it is looking to pull the trigger given what it said on the 2Q24 call (May quarter) as LEN cited a draft registration statement. With NVR a longstanding land-light player and D.R. Horten a bit “lighter” through its use of the Forestar balance sheet (not guaranteed by DHI), the approach on the “land light” strategy is evolving this cycle for the industry. We have seen a much larger use of options compared to past cycles. That was traditionally an NVR template that worked amazingly well (see link below).
More builders are now looking for ways to boost ROEs and mitigate balance sheet risk. The mention of land banks and private equity might indicate this could be one more side effect of all the private credit under management and managers looking for good opportunities with good partners. LEN certainly qualifies as a high-quality counterparty. The plan is a debt-free spin-off, but it is unclear what comes next and whether LEN will add cash to the entity to give it a running start.
There was a limited amount that LEN would say in Q&A, but there was $4.4 bn in land in the $16.1 bn “inventory owned” number at the end of 2Q24, so that is a starting point on the $8 bn land number they cited. Private equity partners could in theory supply a lot more.
Given a $27 bn book value of equity and $3.5 bn in cash (to go with only $2.24 bn in debt as detailed herein), it is pretty hard to unsettle such a rock-solid financial profile at Lennar even if asset distributions are by definition a credit negative. The benefits of a highly profitable and less land-exposed homebuilder of this scale does not raise flags in terms of LEN credit quality, but any pure asset distribution usually begs an explanation on what comes on the other side.
Results of operations…margins hold the line, outlook stable…
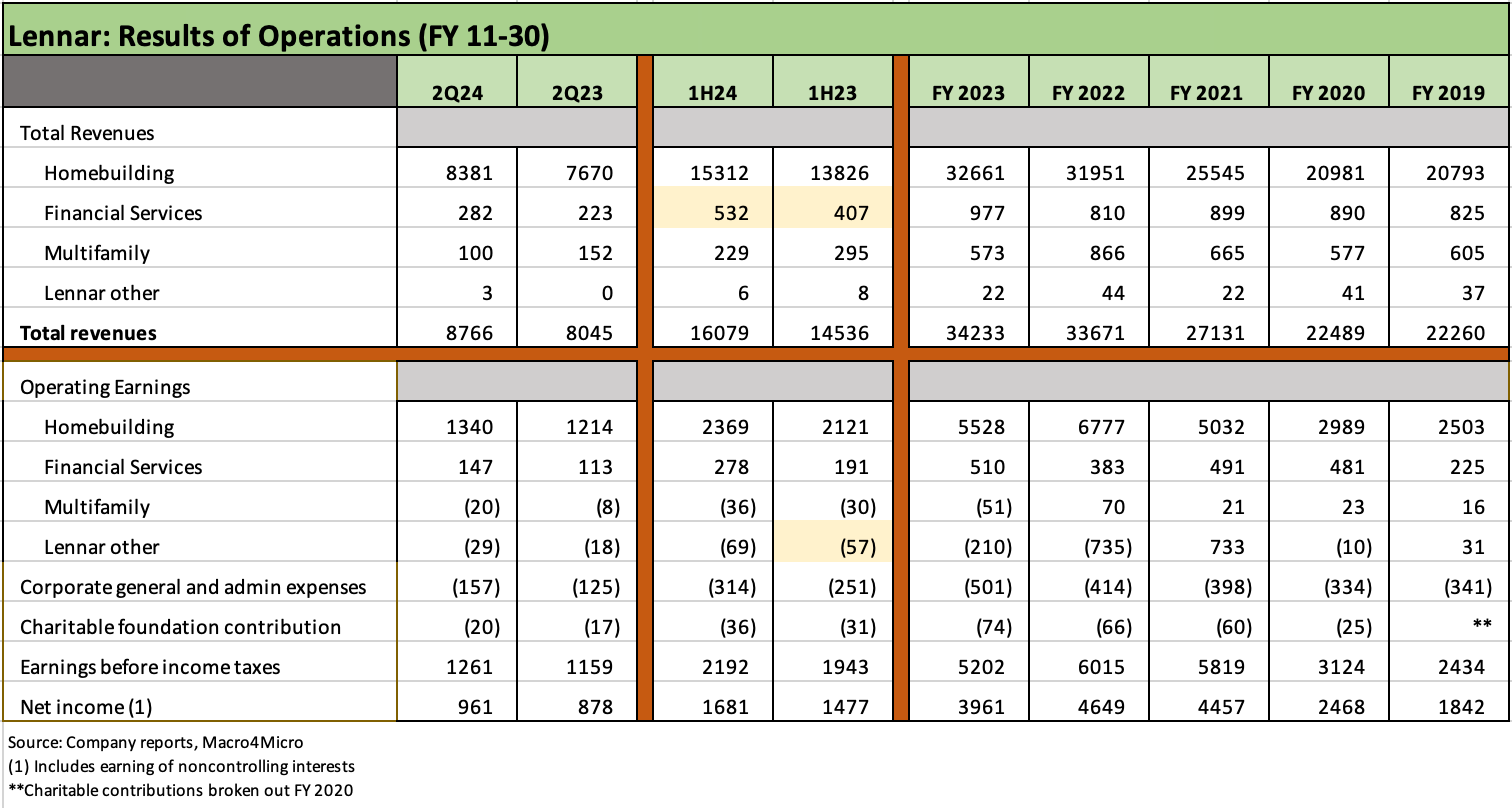
The above chart details the operating results of Lennar through 2Q24. Lennar is a bellwether that has been generating very healthy cash flows in a tough market undermined by mortgage rates that hurt the first time or entry level buyer on affordability strains. The transition to a higher rate backdrop has been a challenge for many pockets of housing services (notably mortgage lenders and brokers). In contrast, homebuilding has seen a steady climb in orders and deliveries into later 2023 and into 2024.
LEN’s mortgage financing, title, and closing services are a steady earner and complementary to the homebuilding operations and strategically important in an incentive heavy market. The debt for the mortgage business is nonrecourse to LEN as detailed further below. Multifamily is also going through some changes with asset divestitures underway into 2024.

The above chart updates the volume trends for deliveries by geographic segment. The steady growth in total deliveries has been a fact of life from 2019 and each year across the pandemic and into the tightening cycle. That is impressive. For 2Q24, every segment posted higher quarterly deliveries YoY and the same is true for 6 months.
For orders (not shown), LEN reported 3 of 4 geographic segments higher with the East segment down very slightly at a fraction of 1%. Texas was up sharply in orders at +40% on units, and it should be noted that Texas has by far the lowest ASP with those orders at a price of $256K vs. the overall order ASP of $432K for 2Q24, down from $457K in 2Q23. The mix shift is always a lens for looking at the overall ASP decline, and that is a lot more low-price Texas units in the mix. The overall deliveries ASP in 2Q24 was $426K, down from $449K in 2Q23. As a frame of reference on ASP by segment, the new orders ASP for the West was $642K or 2.5x that of Texas.

The above segment pie chart details the unit deliveries mix, the dollar value deliveries mix, and the dollar backlog mix. As a major national player, Lennar has a representative mix on the back of its ambitious M&A program since the housing crisis as it grew its presence on the West Coast as well. We look at that history in earlier commentaries (Lennar 4Q23: Buyer Buzz, Curve Support12-15-23, Credit Crib Note: Lennar (LEN) 11-22-23).
The builders vary in how they group states by segment, but for LEN the “East” includes Florida, where LEN is by far the industry leader in Southern Florida but also includes AL, SC, PA and NJ. “Central” runs across states including GA, NC, TN, VA and MD but also across to IL, IN, and MN. The “West” includes the usual suspects including CA, OR, WA, AZ, CO, NV, UT, and ID. That is an impressive footprint relative to the lead players in the industry.

The above chart updates the ASP trends for deliveries across the geographic segments and in total. The total ASP as of 2Q24 is only 6.5% higher vs. 2019. The differentials across product tiers and regions is always an eye opener with the ASP for the West in 2Q24 at 2.4x the ASP of Texas. We also see 3 of the 4 segment ASPs below the total ASP of $426.

The above chart updates the homebuilder balance sheet. The 7.7% Total Homebuilding debt to cap is quite strong even without framing cash in excess of that debt. That leaves net cash of $1.36 bn.
The inventory asset coverage shows owned inventory at 7.2x total debt and “unrestricted cash + owned inventory” at 8.8x. It is hard to see a balance sheet like that as a BBB tier rated credit. The same is true for NVR and D.R. Horton. The plot could thicken on the balance sheet trends if the company spins off over $4 bn in land and contributes cash. Those factors await the filing on the new entity.
LEN reduced debt by $589 mn during 2Q24 including the redemption of the $454 mn of 4.5% due April 2024 and repurchased another $100 mn of the 4.75% due Nov 2027. The company can wait for a friendlier coupon environment before extending liabilities. The capital allocation has been friendly to both credit quality and shareholders with $603 million in stock buybacks in 2Q24. That comes after $506 million in buybacks in 1Q24 after averaging over $1.2 bn in buybacks per year from 2021 to 2023. The dividend rate hover around a 1.34% dividend yield. LEN raised its dividend from $1.50 per share to $2.00 per share in 1Q24.
We see the homebuilders stuck in a time warp on rating criteria. The major builders present less risky business risk than the major banks and leveraged financial services operators as well cyclical, capex-intensive and high-fixed-cost manufacturers. That is especially the case with the more defensive and balance sheet friendly approach to land development and the increased use of lot options to mitigate risk.
A note on financial services…
With respect to the financial services assets and liabilities, these come with the usual asterisks on the major homebuilders’ financial services operations. Per Lennar footnotes (10-Q): “The Financial Services segment uses residential mortgage loan warehouse facilities to finance its residential lending activities until the mortgage loans are sold to investors and the proceeds are collected. The facilities are non-recourse to the Company and are expected to be renewed or replaced with other facilities when they mature. The LMF Commercial facilities finance LMF Commercial loan originations and securitization activities and were secured by up to 80% interests in the originated commercial loans financed.”
We see similar guarantor nuances over in the multi-segment operations at D.R. Horton, where only the homebuilding subsidiaries guarantee the homebuilding debt and not the debt of other business lines (see D.R. Horton: Credit Profile 4-4-23, D.R. Horton: Ramping Up in 2024 Despite Mortgages 4-19-24).
See also:
Credit Crib Note: NVR, Inc. 5-28-24
New Home Sales April 2024: Spring Not Springing Enough 5-23-24
Toll Brothers: A Rising Tide Lifts Big Boats 5-23-24
Existing Home Sales April 2024: Pay More, Get Less, but More Available 5-22-24
Credit Crib Note: Taylor Morrison 5-20-24
Housing Starts April 2024: Recovery Run Rates Roll On 5-16-24
PulteGroup: Strong Volumes, Stable Pricing 4-24-24
Housing Starts April 2024: Recovery Run Rates Roll On 5-16-24
D.R. Horton: Ramping Up in 2024 Despite Mortgages 4-19-24
For Lennar, see also:
Lennar 4Q23: Buyer Buzz, Curve Support12-15-23
Credit Crib Note: Lennar (LEN) 11-22-23
Starts and permits so weak today wonder how low do you think rates will need to drop to kick the building industry back into a strong forward gear? Sure seems like there is great demand guess its really about affordability in both single family and even to some extent multi family...tough to make the math work these days...good to see Lennar keeps moving forward