
Credit Crib Note: PulteGroup (PHM)
We look at the credit quality, financial profile, and operating fundamentals of PulteGroup (PHM).


Credit Crib Note: PulteGroup (PHM)
CREDIT TREND: Positive
After running at cyclical highs in revenues and income before taxes in 2023, PulteGroup (PHM) posted notably higher home sale revenues and net income YTD 2Q24. Gross profit margins came in just under 30% in 2023 and YTD 2Q24 but just missed the 2022 highs of over 30%. Unit closings were down in 2023 vs. the record of 2022 after record orders in 2021, but closings are up again YoY 2Q24 with a slight uptick in average sales prices (ASPs) to $549K in 2Q24. Operating metrics have stayed strong and from here will turn on mortgage rates into 2025.
Even with billion dollar share buybacks in 2022 and 2023 and a billion-dollar annualized run rate in buybacks YTD 2Q24, gross debt leverage is only 12.8% at 2Q24 and net debt leverage only 2.2% (using unrestricted cash). The strong balance sheet liquidity that PHM maintains and additional debt reduction in 2Q24 has kept leverage at exceptionally low levels.
The improved asset coverage when we frame inventory vs. debt now shows cash + inventory at over 8x total debt. That magnitude of asset protection for creditors sums up the strength of Pulte as a very solid BBB tier name that looks more like a single A. With 30Y mortgages in the tightening cycle reaching up into the mid to upper 7% range and touching the 8% level before the latest rally took it down into 6% handles, PHM has demonstrated its resilience across a volatile interest rate cycle.
OPERATING PROFILE
PHM’s strategy around build-to-order vs. spec volumes adapted to the conditions of the housing market in this tightening cycle as PHM efficiently manages a healthy, balanced mix of first-time buyers (39% of units), move-up customers (36%), and their highest margin operation in the “active adult” segment (25%), where the Del Webb brand ranks among the leaders in the space for 55+, age-restricted communities.
First time buyers rose in the mix since 2019 (28% in 2019, 39% 2023) while move-up buyers (46% in 2019) have been restrained by the “locked-in-effect” holding back existing home sellers sitting on low rate mortgages under 4% as we have discussed in our various housing sector commentaries (see Existing Home Sales June 2024: Supply Up, Prices Up, Volumes Down 7-23-24). Lower mortgage rates would be a blessing for both first time buyers in affordability and monthly payments but could also allow more homeowners to free up substantial embedded home equity gains across the cycle for new home move up transactions.
PHM also benefits from a regional mix and product focus that translated into relatively high ASPs in the context of the major builders (see Homebuilders: Equity Performance and Size Rankings 7-11-24). As an example, PHM posted ASPs over $600K in 3 of its 6 geographic segments with the Northeast at $680K followed by the West ($635K) and Florida ($602K).
FINANCIAL TRENDS
As discussed in the Credit Trend section, the low book debt/cap levels on a gross and net basis and very strong inventory coverage of total debt make for a compelling, low risk financial profile. PHM’s prudent approach to working capital management offers reassurance on cash flow risk even if mortgage rates reverse course after the recent rally and rise again above 7%. Declining volumes would hurt earnings but support free cash flow via inventory liquidation. It is an impressive stabilization factor in the homebuilder business risk profile.
With supply-demand imbalances in the housing market’s low existing home sales, the builders have picked up market share of total home sales while PHM has demonstrated an ability to grow its volumes and post sustained high gross margins ahead of the peer group. The recession anxiety comes with an asterisk for builders such as Pulte since mortgage rates and monthly payment sensitivity can bring out more buyers who have the down payment and steady employment.
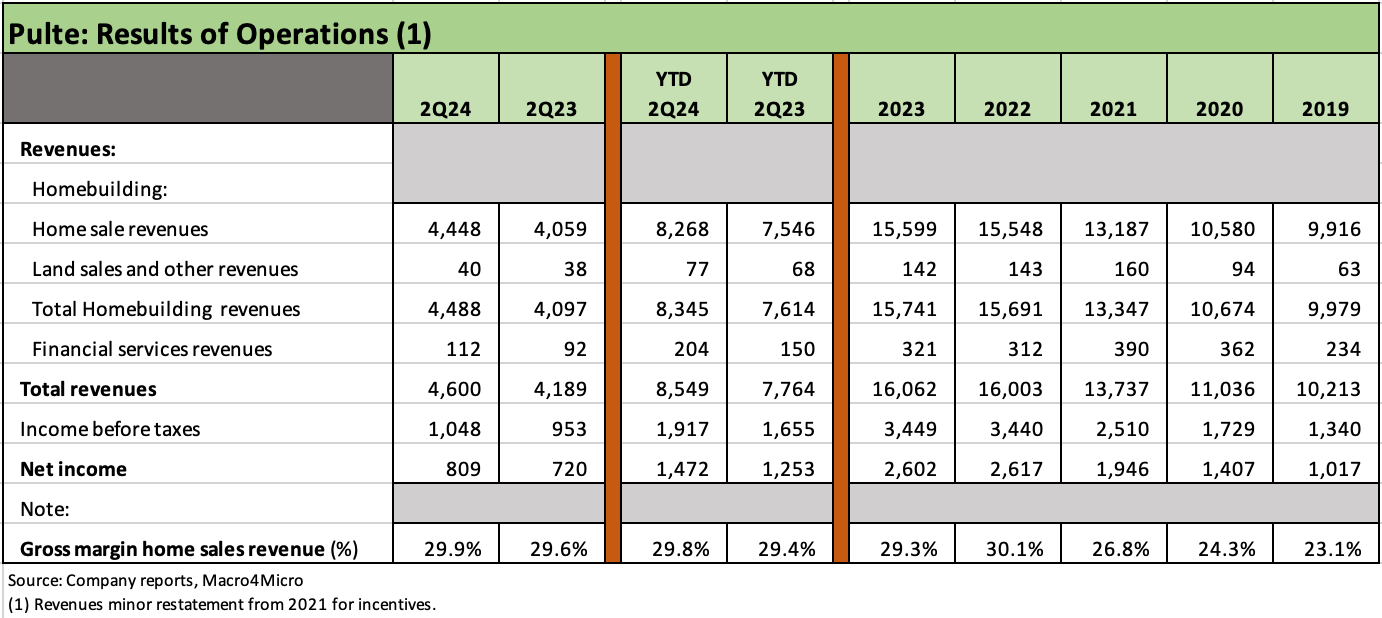
Rising home sales revenues and strong profits tell a very reassuring credit story across such a volatile period in interest rates and the ongoing uncertainty around monetary policy.
The directions of gross margins on home sales from the 23%/24% area in 2019-2020 to the current 29% neighborhood is impressive and ranks at the top end of the major builder peer group.
In the charts that follow, we detail profitability across geographic reporting segments in homebuilding and look at the sustained strength of volumes and ASPs even in the face of high mortgage rates. Favorable volume and price variances offer a good starting point for the bullish cash flow and liquidity fundamentals.
The financial services unit does not need too much detail here, but it is a critical part of the homebuilding strategy in this market given the creative use of incentives such as mortgage buydowns and fee relief that help drive homebuyer flow through the core business. The “capture rate” (loan origination as a % of loan opportunities) is up to over 85% in closing mortgages with PHM customers (average FICO score YTD of 750).
A parallel to the use of mortgage credit by the builders is the use of captive finance operations with auto manufacturers. Like Auto OEMs, major homebuilders use all the tools to capture customers while making a healthy profit on top of it before selling the mortgages into the market. Financial segment profitability at PHM was up by +73% to $104 mn YTD 2Q24. The 2Q24 income before income taxes was +36% to over $62 mn. Financial Services is accretive to earnings as well as being an essential competitive advantage in closing home sales.

The homebuilding geographic segment earnings are broken out above, and the critical role played by Florida and Texas is reflected in the fact that they get their own segments with Florida by far the most profitable region.
The diversity across regions is impressive even with over 1/3 of profits in Florida in 2023. We look at the closings unit mix separately, but a strong competitive position in Florida and Texas is essential to any national scale builder.

The above table shows the trends in price and volume as well as in orders and backlogs across a very volatile period in mortgage rates and cyclical uncertainties even if some views on recession probabilities are more certain than others. Many were “certain but wrong” in 2022 on the timing of a recession (see Unemployment, Recessions, and the Potter Stewart Rule 10-7-22).
The record closings in 2022 came after record orders in 2021 when the mortgage market was supported by the last full calendar year of ZIRP and 2021 brought record low mortgage rates.
ASPs were materially lower in the 2021 record order year before existing home inventory was squeezed by mortgage rates during the tightening cycle and existing home inventory for sale was pressured lower.
The supply-demand imbalances coming out of COVID favored the upward rise in ASPs whether new or existing homes as we cover in our housing sector research. The spike in Dec 2020 housing starts to 1.3 million (highest since that date) is a reminder of the demand when rates were low.
Some builders have seen mixed to weaker pricing trends into 2024, but PHM’s pricing so far has stayed remarkably resilient even if any ASP trend comes with the asterisk of regional and product mix variances.
The $549 in 2Q24 ASP and $544 YTD ASP were both very slightly higher YoY while closings were higher with YTD 2Q24 closing volumes up by over 9% in units.
Orders rebounded sharply in 2023 and into 2024 after the 2022 plunge with YTD 2Q24 orders higher in units and dollars through six months. We see a small dip in order volumes by units in the 2Q24 3-month period while the dollar volumes ticked higher.
Overall, backlogs are higher since year end but flattish YoY at levels north of $8 bn, which is higher than run rates seen pre-COVID but well below the 2021 boom in orders and units.
There will be much to play out during the fall season around potential fed funds cuts and a recurring debate over whether lower fed funds can translate into a lower UST 10Y as well. That debate over the potential for a reversal of the inversion and flattening or steepening in turn gets tied up in the question of UST supply and liability management (i.e. where to fund or term out along the UST curve).
Myriad other issues such as what tariffs and inflation threats and what those could mean for fed policy make for a challenge ahead for builders, lenders, buyers and sellers of existing homes. Handicapping (or conclusions) are wrapped around election predictions that include stark policy differences.

The closing volumes by homebuilder segment tells a straightforward story with volumes higher in 2Q24 and YTD 2Q24 after dipping in total for FY 2023 vs. 2022 levels.
The chart highlights the wide diversity and healthy regional balance across units with the one exception of the small Northeast market that as a region is a much smaller new home market than the rest of the nation as highlighted in the monthly housing sector data.
The YTD 2Q24 closings were higher in 5 of 6 regions with only Texas down slightly. That comes after 4 of 6 regions saw closing unit volumes decline in FY 2023.
Florida has regularly been a volume leader and is one of the 3 regions with ASPs over the $600K threshold along with the West and the small Northeast market.
The Southeast came in at a strong #2 in volumes YTD 2Q24 and joins the Midwest in the ASP rankings with both over the $500K ASP bracket.
Texas at #3 YTD 2Q24 in closings has the lowest ASP of the segments at $396K in a state with extraordinary diversity across the submarkets inside Texas.

We have spent some time framing the working capital cash flow dynamics of the builders in various commentaries including industry leader D.R. Horton the past week (see Credit Crib Note: D.R. Horton 8-8-23).
Considering the chaos that unfolded since 2019 across COVID, household uncertainty around employment, supplier chain disruptions, bouts of manpower shortages, an inflation spike, and the most aggressive monetary tightening cycle since the Volcker years, it is safe to say the homebuilders have had a real world stress test with high and low mortgage rates and a test in how that would flow into cash flow and credit risk.
The cash flow histories from pre-COVID to today are extremely reassuring for credit risk in this sector. Stocks have been exceptional performers even as we see a steady upward migration of credit quality in a sector that still strikes us as carrying credit ratings too low for the strong credit metrics and lower business risk vs. issuers in the BBB tier.
The industry has been in an expansion phase in building out inventory levels, posting strong earnings and using excess cash flow to buy back shares and in some cases to raise dividends. We see that in the line items in the above chart.
The challenge is gauging when the supply-demand imbalance in housing favoring builders at the expense of existing home sales will start to dissipate and what the transmission mechanics will look like (e.g., Lower mortgage rates and rising existing home inventory to push prices lower? Explosive growth in demand at lower mortgage rates still raises orders and closings? More move up demand for new homes once existing home sales volumes free up home equity values for moving?)
We see major builders such as Pulte as well positioned under most any scenario other than stagflation. For builders with their stabilizing working capital dynamics, they will still present less business risk in a worst-case stagflation scenario than manufacturing, medium grade energy, and asset-lite services companies that are dependent on the consumer. Stagflation is intrinsically bad (very!), but that scenario still needs to be put in portfolio context vs. other holdings. Basically, who gets hit the hardest? It is not the builders.

The balance sheet trends are self-evident with high balance sheet liquidity, low leverage, and high asset coverage in the form of inventory excess at a material multiple of total debt levels.
The preferred balance sheet metric in bank lines is “old fashioned” debt to cap with a fixed charge coverage metric along with it in credit agreements.
The Debt/EBITDA metric (total or net) is less useful for evaluating builder risks even though the lowest tier credit names tend to deliver that to the HY community that lives and dies by debt/EBITDA. We agree with the banks on this one.
We like to frame leverage using debt/cap while leaning on asset coverage in the form of “Inventory/Total Debt” and or “Cash + Inventory/Total Debt.” Much of the financial activity at builders runs through the funds flow statement with increases and decreases in inventory.
The buildup/liquidation of house, lot, and land inventory is what drives cash flow with good times potentially leading to decreases in working capital adjusted cash flow and leaner times in building leading to increases in working capital adjusted cash flow. It is just accounting and common sense. How much more cash flow the builder can drive on high earnings and high gross margins is the “gravy” for credit risk trends.
As of 2Q24, Cash + Inventory is 8.3x total notes payable vs. 3.2x to end 2019. The excess inventory relative to debt levels offers a high degree of comfort around PHM’s ability to generate cash in slower markets or to take impairments in a housing market crash while still generating cash flow well in excess of debt. The high gross margins offer a lot of room for price and lot/land value “corrections.”
If you believe that there will be a shortfall in supply vs. demand in the market and that a builder has shown an effective strategy around spec vs. build-to-order, manages its start cadence prudently, and has a sound plan on community product and pricing strategy, it is very easy to get comfortable with materially higher leverage than the very low leverage currently seen at PHM. We see all those favorable attributes at PHM, and it shows up in the relative stock performance of PHM in recent years.
HIGHLIGHTS & HISTORY
Pulte merged with Centex in 2009 around the peak of the crisis in a stock-for-stock transaction. The merger of the #2 builder (Pulte) at the time and the #3 builder (Centex) based on LTM units was big news during a post-bubble market crisis. Pulte was only behind D.R. Horton at the time, and the deal pushed Pulte to #1 on both LTM revenues and units pro forma for the deal.
D.R. Horton took back the top ranking as DHI just kept on growing while Lennar kept on expanding/acquiring, so in 2024 Pulte now holds the #3 ranking (see Homebuilders: Equity Performance and Size Rankings 7-11-24).
The Pulte family of brands includes Pulte, Centex, Del Webb, DiVosta, American West, and John Wieland Homes. These brands and local name recognition allow PHM to cut across regions and product tiers from first time buyers to active adult leadership to the luxury tier.
As of July 2024. Pulte had the 4th highest average sales price based on the most recent quarter behind Toll Brothers, Tri Pointe, and Taylor Morrison.