
New Homes Sales Jan 2024: Homebuilders Feeling Cyclical Signals?
New Home Sales shows consumer nerves creeping up again.


Feeling high anxiety in housing again…
Weak home sales numbers in Jan 2024 follow upward revisions for Dec 2024 leading into a sequential decline for new home sales but with a much higher median home price of $446.3K, the highest since fall 2022 and well above the sub-$400K median of Nov 2024. Such prices always come with the asterisk of “mix” by price tier and geography.
A sequential decline of -10.5% in new single family home sales was only -1.1% YoY with the critical South region (includes TX and FL) down -14.8% from Dec 2024 but still up by +6.8% YoY. The South is just under 60% of sales.
Mortgage rates usually take the fall on housing, but there is more to the consumer angst story at this point beyond partisan clashing with the budget taking shape and one headline after another on tariffs. The latest tariff cited on a long list is copper (Chile as 52nd state? Peru #53?). Copper shows up in NAHB commentaries on supplier chain risks pressure (with all the appliances, etc.). Tariffs on copper would not help.
Cyclical anxiety also comes with some hints of a more defensive, quality focus in the face of high valuations showing up in the UST market. That trend is coming on the heels of DOGE headlines and tariff threats against Autos, Pharma, Semis, Steel, and Aluminum even before factoring in Canada and Mexico tariffs teed up to start next week (see Auto Tariffs: Japan, South Korea, and Germany Exposure 2-25-25 and links below).
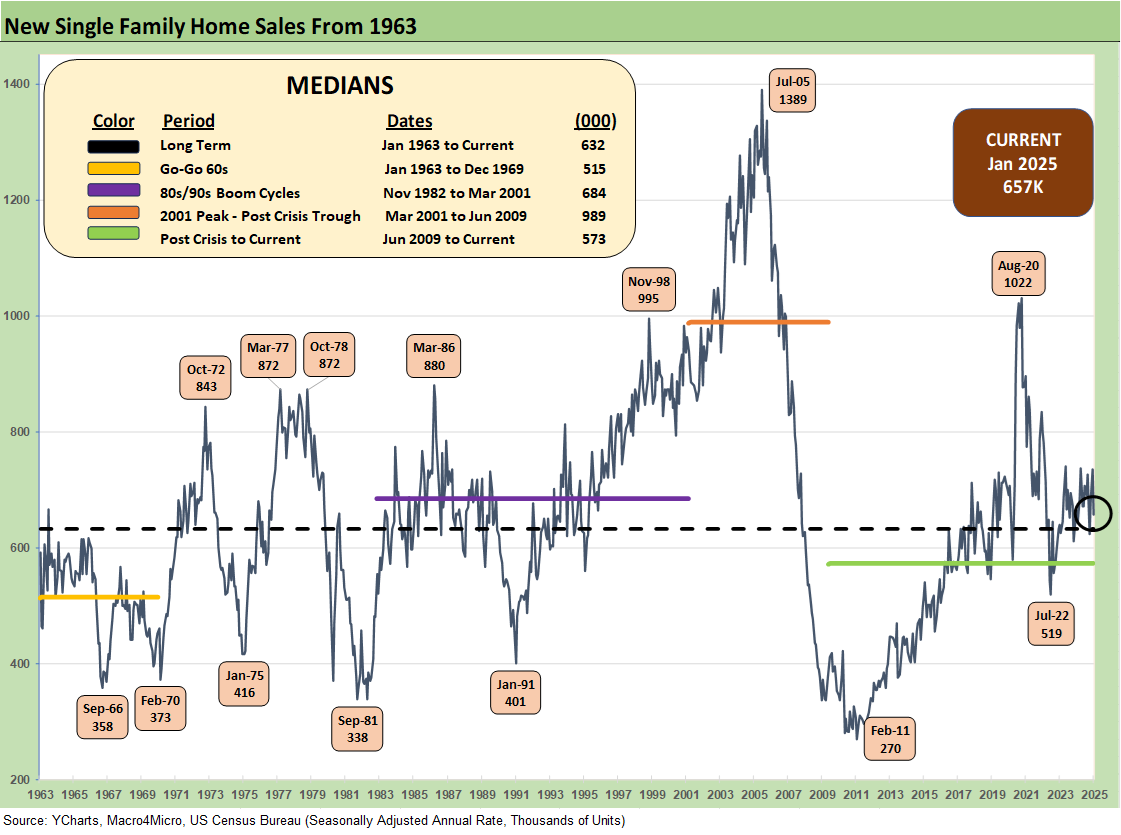
The current 657K on new single family home sales is above the long-term median of 632K and in the area of the median seen during the 1980s/1990s economic expansion booms. That said, the demographic demand now for family homes requires a much higher supply of affordable homes. The housing starts and new home sales right now are dwarfed by the housing bubble years with a median new home sales rate of 989K back in the March 2001 to June 2009 cycle.

The above chart updates the mix of total single family home sales captured by new vs. existing home sales. Existing homes typically dominate in the high 80% to 90% area, but the homebuilders have seen their share of total sales rise and currently stands at 13.9% vs. the long-term median of 11.3%.
The pain of high mortgage rates running in a 200 bps range since the fall of 2023 keeps buyers on the fence (or out of the market) in existing home sales as monthly payment pain combined with high home prices keeps many priced out the market or waiting for lower rates (see Existing Home Sales Jan 2025: Prices High, Volumes Soft, Inventory Up 2-21-25).

The above two-sided chart shows the sales pattern for the new home sales line since 2000 vs. median prices. The fact that prices are higher is a clear challenge, but the sensitivity of monthly payments is married to mortgage rates, which remain the primary driver of weaker volume in the lower price tiers in both new and existing sales.

As noted earlier in the bullets at the top, the spike in the median home price to $446.3K sends us back to an outlier month during fall 2022 for a higher price. Tight existing home sales and builder fears of higher materials and supplier chain costs are not going to do much to relieve homebuilders in their pricing strategies as they try to frame how they can get into a gross margin zone that keeps stockholders happy. We can expect a sustained high rate of stock repurchase activity from the builders.

The above chart gives a different visual angle on the median home prices from early 2022. That is a lot of $400K handles with one outlier in Nov 2024.

This time series updates the new single family home sales across the cycles since 1973 for the #1 and #2 regions of the South and the West. The 392K for the South is around 60% of the total of all single family new home sales (SAAR) while the West at 167K is over 25% of the total. For the month, the South was -14.8% sequentially and +6.8% YoY. The West was +7.7% sequentially and +3.1% YoY.

The timeline of new home sales for the smaller Midwest and much smaller Northeast market is detailed above. The Midwest (11% of total) was -16.7% sequentially and -13.6% YoY. The Northeast market (4% of total) was -20.0% sequentially and -48.1% YoY.
The explanations around weather and fires clearly have to factor into traffic patterns by region, but the tone coming out of 4Q24 and 1Q25 earnings season and in the starts numbers have been guarded at best. The overall color from the builders and in broader consumer macro indicators have recently flowed into very negative stock market reactions after homebuilder valuations had soared through 3Q24 (see Footnotes & Flashbacks: Asset Returns 2-23-25).
See also:
Footnotes & Flashbacks: Credit Markets 2-24-25
Footnotes & Flashbacks: Asset Returns 2-23-25
Footnotes & Flashbacks: State of Yields 2-23-25
Existing Home Sales Jan 2025: Prices High, Volumes Soft, Inventory Up 2-21-25
Housing Starts Jan 2025: Getting Eerie Out There 2-19-25
New Home Sales Dec 2024: Decent Finish, Strange Year 1-28-25
Existing Home Sales Dec 2024: Another “Worst Since” Milestone 1-24-25
Housing Starts Dec 2024: Good Numbers, Multifamily Ricochet 1-17-25
Homebuilders:
Toll Brothers 1Q25: Performing with a Net 2-20-25
Credit Crib Note: Lennar Corp (LEN) 1-30-25
D.R. Horton: #1 Homebuilder as a Sector Proxy 1-28-25
KB Home 4Q24: Strong Finish Despite Mortgage Rates 1-14-25
Toll Brothers: Rich Get Richer 12-12-24
PulteGroup 3Q24: Pushing through Rate Challenges 10-23-24
KB Home: Steady Growth, Slower Motion 9-26-24
Lennar: Bulletproof Credit Despite Margin Squeeze 9-23-24
Credit Crib Note: PulteGroup (PHM) 8-11-24
Credit Crib Note: D.R. Horton (DHI) 8-8-24
Homebuilders: Updating Equity Performance and Size Rankings 7-11-24
Credit Crib Note: KB Home 7-9-24
Lennar: Key Metrics Still Tell a Positive Macro Story 6-20-24
Credit Crib Note: NVR, Inc. 5-28-24
Toll Brothers: A Rising Tide Lifts Big Boats 5-23-24
Credit Crib Note: Taylor Morrison 5-20-24
PulteGroup: Strong Volumes, Stable Pricing 4-24-24
D.R. Horton: Ramping Up in 2024 Despite Mortgages 4-19-24
D.R. Horton: Credit Profile 4-4-23
Tariff links:
Auto Tariffs: Japan, South Korea, and Germany Exposure 2-25-25
Mini Market Lookback: Tariffs + Geopolitics + Human Nature = Risk 2-22-25
Reciprocal Tariffs: Weird Science 2-14-25
US-EU Trade: The Final Import/Export Mix 2024 2-11-25
Aluminum and Steel Tariffs: The Target is Canada 2-10-25
US-Mexico Trade: Import/Export Mix for 2024 2-10-25
Trade Exposure: US-Canada Import/Export Mix 2024 2-7-25
US Trade with the World: Import and Export Mix 2-6-25
The Trade Picture: Facts to Respect, Topics to Ponder 2-6-25
Tariffs: Questions to Ponder, Part 1 2-2-25
US-Canada: Tariffs Now More than a Negotiating Tactic 1-9-25
Trade: Oct 2024 Flows, Tariff Countdown 12-5-24
Mexico: Tariffs as the Economic Alamo 11-26-24
Tariff: Target Updates – Canada 11-26-24
Tariffs: The EU Meets the New World…Again…Maybe 10-29-24
Trump, Trade, and Tariffs: Northern Exposure, Canada Risk 10-25-24
Trump at Economic Club of Chicago: Thoughts on Autos 10-17-24
Facts Matter: China Syndrome on Trade 9-10-24