
Credit Crib Note: Taylor Morrison Home Corp (TMHC)
We look at the financial and operating fundamentals of Taylor Morrison, the #6 builder by revenues, and summarize its history since the 2013 IPO.

CREDIT TREND: Positive
Credit quality at TMHC is improving as reflected in recent upgrades by Moody’s and another in the fall from S&P. The gross margin and balance sheet leverage trends make achieving BBB tier investment grade ratings a good prospect by the end of 2025 given the intrinsic lagging nature of the rating agencies on the builders. The current BB tier composite is at least biased higher.
The relative business risk of homebuilders has been demonstrated as “low” over the course of the tightening cycle and the tangible demonstration of a market with high demand but also one that is materially undersupplied. The credit markets are steadily pricing in more evidence of lower cyclical risk in both debt and equities even if ratings criteria tend to lag.
The UST curve is a mortgage rate wildcard for upside scenarios for revenues and cash flow from first time and move-up buyers alike. Cash flow growth will also be a major factor in how management trades off debt reduction with share repurchases. TMHC can and will deleverage organically through growth – not debt reduction. Debt reduction has already happened.
Pushing through the mortgage headwinds…
TMHC has performed well despite mortgage strain undermining some key market segments such as the first time buyer, who still feels the headwinds of affordability. TMHC reported a solid 1Q24 period ahead as the peak selling season is underway, and the company raised full year guidance on fundamentals and the recently announced Indianapolis acquisition. Gross margins around 24% are well ahead of pre-COVID levels. Financial services profits are solid and steady and offer tools and flexibility to draw in more home buyers as we have seen broadly with the larger public builders.
Balance sheet strength is a major positive factor in the credit story with TMHC boasting much lower leverage and higher margins than before and during the COVID peak. Inventory coverage is strong and hit a multiyear high in 2023.
Given the trajectory of recent years and sustained strength of demographic demand and golden handcuffs impact on the supply-demand balance of new homes vs. existing homes, we remain positive on the credit quality of the homebuilders in the BBB and BB tiers. These are low risk credits in the context of cyclical handicapping, balance sheet trends, and cash flow fundamentals.
OPERATING PROFILE:
TMHC has made a push to grow its national footprint and improve its competitive position across the major US homebuilding markets. TMHC has made great progress in a peer group that has seen a lot of organic and M&A driven growth as TMHC held steady at the #6 ranking based on revenues (using the most recent quarter data for the public builders).
TMHC has demonstrated its ability to keep on growing its markets through a range of deal sizes that have all been prudently financed such as the William Lyon Homes deal (closed Feb 2020) and AV Homes (2018). Total assets have doubled since 2017 with gross margins notably higher from the 17% area of 2019-2020 to around 24%.
Volume growth has recently stalled in FY 2023, but closings and orders are picking up again in 2024. Volumes had declined with mortgage rates after the cyclical peak for unit volumes in 2021. FY 2022 was the peak year for dollar revenues as selling prices rose to new highs. TMHC is now posting YoY declines in prices on a combination of factors, but margins held in well for 1Q24 vs. 1Q23. ASPs are expected to come in over $600K in 2024. Material increases in orders (+29% 1Q24 YoY) at lower ASPs is consistent with trends seen in the broader peer group.
FINANCIAL TRENDS:
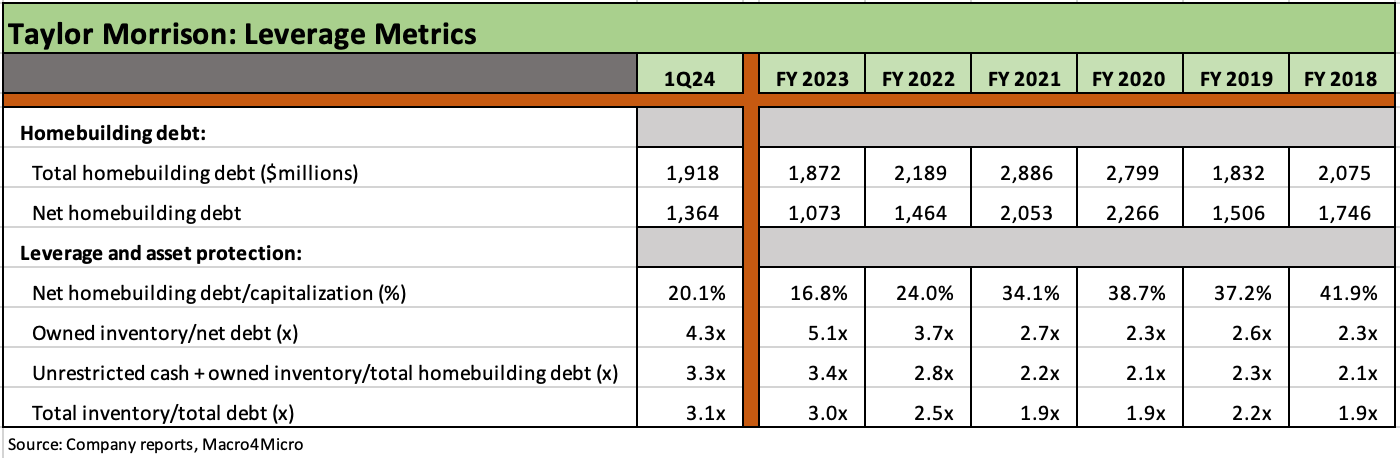
Leverage metrics to end 2023 were materially lower than the prior fiscal years with Net homebuilding debt % capitalization at 16.8% at 4Q23 vs. 24.0% at FY 2022 and as high as 41.9% at the end of 2018. Total homebuilding debt has declined since FY 2021 by $968 million to $1.9 bn at the end of 1Q24. Leverage declined each year before the recent sequential uptick at 1Q24 to 20.1%. Asset protection as framed by inventory coverage of homebuilding debt is strong but not in line with the BBB tier names yet. Owned inventory is now over 4x net homebuilder debt.
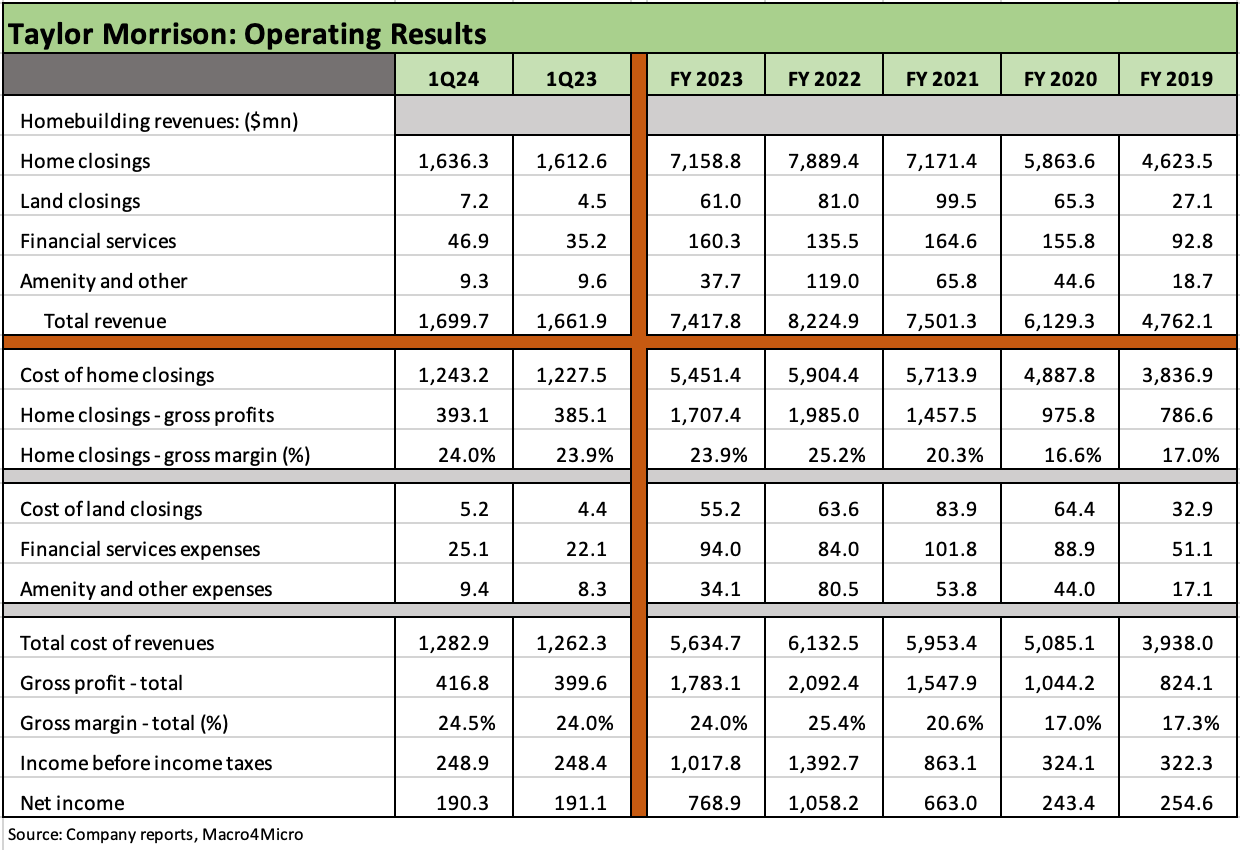
The above table plots the income statement trends for the years from 2019 through 1Q24, and we see a materially higher base of revenues vs. 2019-2020 from both organic growth and M&A as detailed herein.
Rising gross margins from 2019-2020 were impressive and was the overriding and favorable trend for TMHC results. Gross margins rose from 17.0% in 2019 to over 25% in 2022 and trimmed back to 23.9% in FY 2023.
We have seen some price and margin erosion across numerous major builders but still strong financial performances overall.
Net income hit a peak in 2022 despite the early stages of the tightening cycle on a mix of contractual lag effects, material price increases, and more robust mortgage availability ahead of the rapid rise of mortgage rates into 2023.
The mortgage funding operations posted a strong capture rate of 87% in 1Q24 and boasts an average credit score of 751 and average downpayment of 23% for a customer with an average income of $176K.
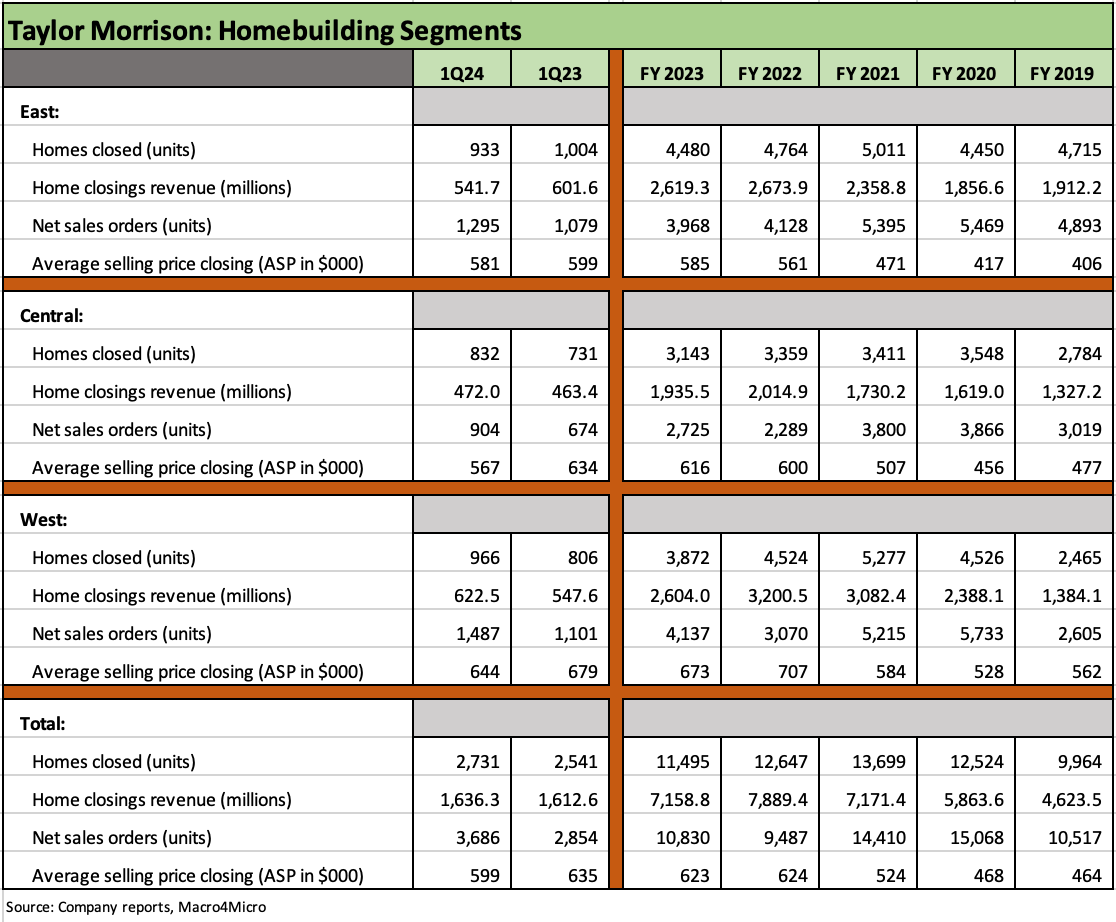
TMHC operates across 3 geographic homebuilding segments detailed above. As of 1Q24, that cut across 11 states before factoring in the Indianapolis plans.
Financial Services is also a materially profitable business segment ($75.5 million profit in FY 2023) but much smaller than the building segments.
The East includes Atlanta, Charlotte, Jacksonville, Naples, Orlando, Raleigh, Sarasota, and Tampa. The East posted gross margins of 26.6% in 1Q24 and 27.0% in FY 2023.
Central includes Austin, Dallas, Denver, and Houston. Central posted gross margins of 26.0% in 1Q24 and 25.2% in FY 2023.
The West includes operations designated as the Bay Area, Sacramento, and Southern California along with Las Vegas, Phoenix, and Seattle/Portland (acquired with William Lyon). The West posted the lowest margins of the three in 1Q24 at 19.9% and 19.1% in FY 2023.
During 1Q24, TMHC saw a strong sales pace (a bullish 3.7 per community) and better-than-expected gross margins. TMHC is expecting to achieve low 3 handle rates for sales pace vs. the traditional 2 handles. The development of newer, larger communities was cited as a key variable by management.
TMHC has accelerated its starts rate to keep pace with its sales rate and meet its closings target. The 3.7 pace was the highest since 1Q21 for the company. Cancellation rates were also cut in half YoY to 7% in 1Q24 from 14%.
Volumes were helped by the heavier use of specs in this cycle than would usually be the case at TMHC, and that strategy mirrors similar experiences at other builders who were more built-to-order business models. The benefits of a shifting mix to more move-in ready homes has supported volumes across an erratic mortgage market in 2023 and 2024.
TMHC ended 1Q24 with 38% of homes under construction in the form of spec homes (vs. built-to-order) given the need to meet expected demand from the pent-up first-time buyer base. That can increase risk if mortgage rates keep rising or move back to over 8% again. The swing factor is incentives and prices.
Sales order rates are up substantially in all regions with closings in 1Q24 materially higher in Central and West but down slightly in the East.
TMHC was able to effectively raise prices during 1Q24 in 60% of communities by reducing incentives.
First time buyers are facing more affordability pressures, but TMHC has utilized incentives to capture volumes. TMHC indicated that 1/3 of 1Q24 closings required incentives and half of those were first-time buyers.
TMHC is targeting 10% annual growth rates in closings in 2025 and beyond, which is an aggressive forecast.
TMHC currently has 6.5 years of lot supply controlled with 3.1 years of that owned. TMHC has increased the average size of its underwritten communities to 150 lots from 100.
The presentations are understandably heavy on “builder speak” (after all, they are builders), but they are making their case on how they can drive growth in closings after a rate spike stall as they take these soaring order rates and translate it into more revenue growth.
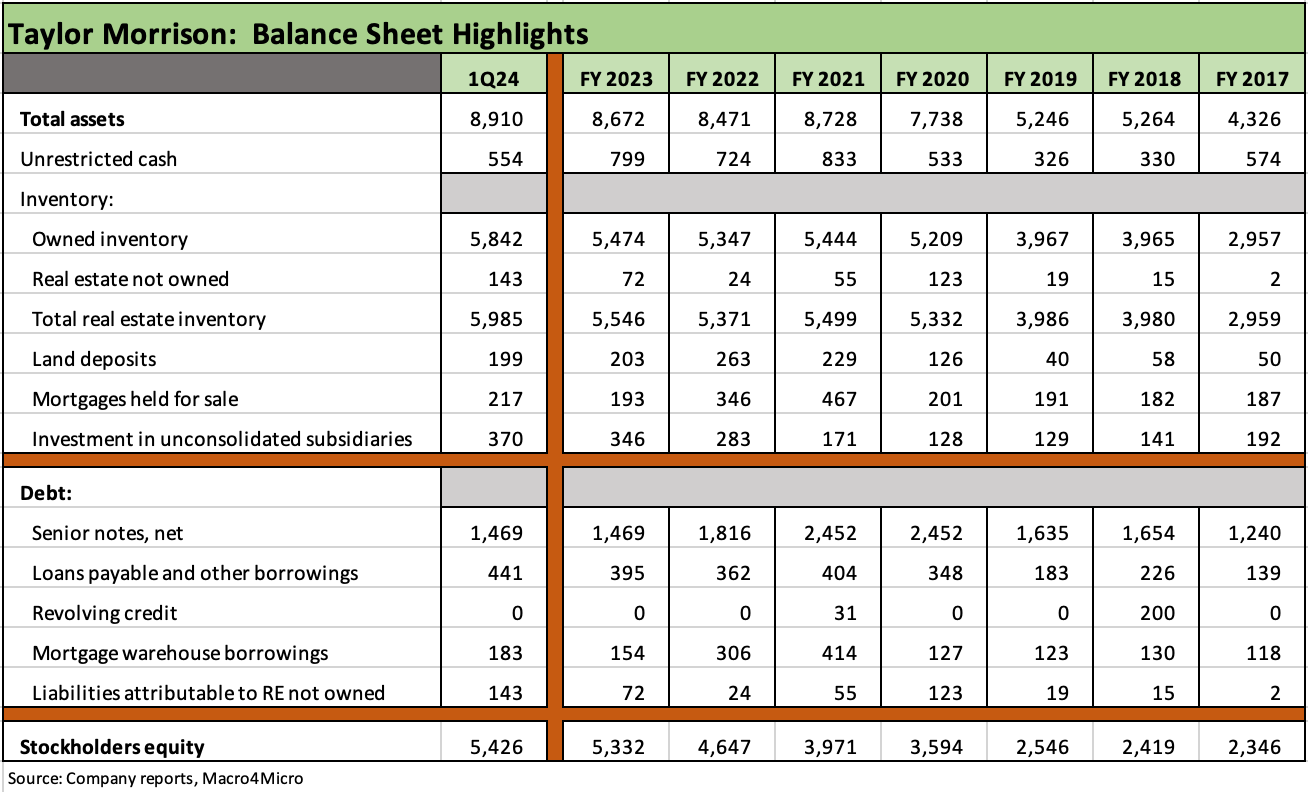
The trend line in the balance sheet since before COVID has been one of growth in the asset base but with material debt reduction evident since 2021.
The “inventory not owned” line is something we tend to see more in HY builders looking to grow and who use a range of structures to optimize their risks and capital costs. TMHC seeks to control the lots but without simply buying expensive lots from developers. They focused on the earnings call on their interest in using more “self-developed land parcels.”
We see total assets at 1Q24 more than double that of 2017 and up by 70% from FY 2019 while homebuilding debt is up by less than 5% from 2019. We break out all the debt lines above and lock in on “homebuilding only” debt in the next chart.
TMHC had $1.6 bn in liquidity at 1Q24 including an undrawn $1.1 bn revolver.
The book equity base has more than doubled across the timeline on high earnings retention and despite steady stock buybacks across the period. TMHC cites the fact that it has repurchased 50% of its beginning shares outstanding at a cost of $1.5 bn since 2015.
TMHC repurchased a cumulative $785 million in shares from 2021 to 2023 vs. a recent market cap of $6.36 billion for a 3-year tally of over 12% of its current market cap. TMHC plans to buy back a total of $300 mn in 2024. That is a balanced capital allocation in a homebuilder industry doing substantial buybacks with their free cash flow.
The high rate of earnings retention and growing book equity base has made for a favorable trend in net homebuilding debt to capitalization. Book debt to cap is the metric of choice used by bank lenders in framing builder balance sheet risks.
Framing leverage for homebuilders is one of those rare deviations from Debt/EBITDA as the best metric for most industries in HY. As an industry that uses cash as it invests for growth in inventory and generates cash as inventory liquidates, banks tend to focus on asset protection (and fixed charge coverage) given the intrinsic liquidity of the primary asset base, i.e., inventory.
We have covered the leverage issues in other commentaries, but the migration of the cash flow focus over to the cash flow statement from the income statement during market slowdowns is a well-traveled dynamic in the case of builders. There is a reason the banks focus on book leverage, and we agree with these reasons with plenty of ammo supplied by the housing bubble and ensuing cash flow histories.
We plot the cash and inventory coverage in the above table, and the “owned inventory” ratio at over 4x net homebuilding debt is a very solid base of asset coverage, up from 2.7x in 2021. The 3.3x multiple of “cash + owned inventory” over total homebuilder debt vs. 2.2x in 2021 also tells a favorable story of TMHCs upward migration along the credit spectrum.
HISTORY AND HIGHLIGHTS
April 2013 IPO from a prior LBO…
TMHC went public through an IPO in April 2013 with the principal shareholders being TPG, Oaktree, and JH Investments (private Canadian investment firm). The IPO was priced at $22 vs a recent $60+ price (5-17-24).
After its IPO, TMHC became the #5 or #6 public builder (depending on the criteria) with a breadth of geographic market range showing TMHC with higher concentrations in the 3 largest markets (CA, TX, FLA) including major markets such as Orange County, Sacramento, Phoenix, and Tampa where it ranked #4 in each. Other material market shares at the time included Austin at #6, San Jose at #6, and Sarasota at #6. At the time, the IPO soundbite was “Top 10 market share in 13 of our 16 markets.”
Across 2017 to 2018, TMHC engaged in an eventual reorganization of its legal structure into a holding company across a period that included seven public stock offerings with the proceeds used to repurchase the interests of “Former Principal Equityholders” as their stakes decreased to zero by Jan 2018 when TMHC became a “fully floated public company.”
Acquisition history…
TMHC acquired AV Homes in Oct 2018 for around $535 mn with the deal expanding TMHC’s presence in 5 overlapping markets (Phoenix, Dallas-Ft. Worth, Charlotte, Raleigh, and Orlando). The deal was valued at 1x book value and included over $400 mn in assumed senior notes. The AV deal left TMHC in a position where it held a Top 5 position in 10 of its then-14 markets. AV expanded its position in the first-time buyer segment.
The big bang acquisition for TMHC was the acquisition of William Lyon Homes (WLH, announced Nov 2019, closed Feb 2020) for $1.1 bn estimated at 90% stock and 10% cash with legacy TMHC shareholders controlling 77% of the equity and WLH shareholders 23%.
The WLH deal made TMHC #5 based on deliveries and #6 on revenues. The combined TMHC and WLH made for a more diverse operation with enhanced market positions in some of the largest MSAs where both already operated. The commercial for the deal was “Top 5 positions in 16 of 23 markets.”
We covered William Lyon (WLH) in prior lives as a HY issuer and a regional builder. WLH had been a crisis-era LBO that fell into Chapter 11 (filed Dec 2011, emerged Feb 2012) after a brief and very smooth reorganization. The onset of the housing crisis came as WLH had too much debt and excess concentration in Southern California, but it was in fact a very successful operating company with bad LBO timing.
After its Chapter 11 exit, WLH embarked on a very successful expansion outside of the California market that had comprised almost 90% of its revenues in 2010 with Arizona and Nevada in the mix. WLH expanded in Colorado with a 2011 deal (Village Homes) and a major move into the Northwest (Seattle, Portland) when it acquired Polygon Northwest in Aug 2014 for $520 mn in cash). That left WLH in 6 state markets, up from its previous 3.
Evolution of the business mix…
TMHC is dominated by the single family home operations with such brand names as Taylor Morrison, Darling Homes, and Esplanade. As of 1Q24, the operations cut across 11 states and what will soon be 12 with the recently announced Indianapolis deal where TMHC acquired Pyatt Builders.
The range of product tiers from first time buyers across first time and second time move-up and resort style offerings (Esplanade) rolls up into a diverse range of offerings that has cushioned the struggles of the first time customer segment.
The company maintains a major wholly-owned mortgage unit with title services and insurance operations. That is typical of the major players who use those units for incentives to drive homebuilding volumes but also to drive ancillary revenue streams. The homebuyers credit quality and borrower profiles are high quality as detailed by TMHC.
The building operations have extended into the build-to-rent space under the Yardley brand name. TMHC also engages in some commercial and multi-use construction and development activities and multifamily under the Urban Form brand.