
Toll Brothers: A Rising Tide Lifts Big Boats
We update Toll Brothers, where the 2Q24 results were a material beat but the equity market sold off hard. Financial risk remains very low.


Lovey, there is no Toll Brothers here!
Toll Brothers posted strong results, offers solid financial risk metrics, holds investment grade ratings, and generated favorable YoY growth even if the guidance did not bring any new positive surprise to the upside.
Toll always gets credit for the franchise value of the brand (and the asset value protection that comes with that) as the leader in the high price luxury segment that is also growing faster in 2024 on the existing home side of the market as well (see Existing Home Sales April 2024: Pay More, Get Less, but More Available 5-22-24).
A material gain on property sale of $124.1 million boosted the headline results, but net income rose by over 11% ex-the gain, signed contract value was up 29%, and contracted homes (units) was up +30%.
In terms of credit quality, there is still a gap in balance sheet strength between Toll as a BBB tier name and the premier BBB tier builders such as NVR, D.R. Horton, and Lennar.

Toll weighed in with a strong 2Q24 and “beat” with impressive YoY growth in both signed contract value and in units. The stock reaction was ugly, however, at a -8.46% price sell-off. Despite the sell-off, the fact remains Toll has still been a very solid performer vs. major peers as well as the Homebuilders ETF (XHB). As detailed in the chart above, TOL stock returns had trounced the S&P 500 across the period from ZIRP (2021), the onset of the tightening period (2022), and the stubbornly protracted spike in mortgages (2023-2024). That is even after the sell-off we saw yesterday as reflected in the chart.
The post-earnings sell-off from the above heights could be more about lack of more excitement in the guidance. It also could be about those looking to time a potential plateau in optimism and how that might impact sell-off risk. The natural target would be to pick the best performer(s). As we detail in the peer group stock chart below, Toll was the #1 performer over the past year (even after yesterday’s swoon). Given the trends in the luxury segment into the spring so far, it is hard to worry about Toll’s prospects, and they are still guiding to 28% adjusted gross margins for FY 2024 (10-31 FY).
Peer group stock returns…

The chart above details peer group stock performance over multiple time horizons. The good numbers in the Toll 2Q24 earnings report lacked material new bullish guidance, so perhaps the decision for some was that it had outrun the pack by too much and the question of valuation. The market thus saw some triggers pulled (vulnerable, chips off the table, etc.).
That TOL price action does not change the fact that TOL has been an exceptional performer along with some larger cap names such as Pulte over the last year. As we cover in our asset return publications (see Footnotes & Flashbacks: Asset Returns 5-19-24), the Homebuilders (XHB) broadly have been the story of the past year even if just by beating a range of tech bellwethers and benchmarks.
The financial profile of Toll benefits from its leading market position in luxury and lower exposure to mortgage rate pressure given its high-quality customer base. The relative cyclical resilience that comes with such an operating history (see Credit Crib Notes: Toll Brothers (TOL) 9-11-23) allows Toll to hold a unique position with its product set in this peer group of builders.

The above chart breaks out the average delivered price by region. As always, the Pacific is the highest of the high prices. These all rolled up to $1.0 million for the quarter. It is worth highlighting that Toll has been diversifying its product mix with FY 2023 showing 31% of its deliveries with a base sale price of $1 mn to $2 mn while 31% was in the $500K to $750K bucket. $750 to $1 mn was 24%. Over $2 mn was 6%. Those are still high prices, but it is not as asymmetric to the million dollar club as some assume.
The mortgage headwinds have not been as important a factor for Toll as many other major builders. Toll saw 27% of its buyers pay all cash for the homes. Toll attracts a buyer base that can pay cash and wait on the yield curve if they wish to apply leverage later to lock in lower rates. The all-cash mix in 1Q24 was 25% and the long-term average is 20%. Toll also has a lower loan-to-value in its buyer base with an average of 31% down for those who used a mortgage with the purchase.
Interestingly, Toll’s buyer base included 30% first time buyers. That is a reminder that a “first time buyer” designation can include some affluent buyers such as former high price urban renters. The cancellation rate for Toll was only 2.8%, another distinctive sign of the quality of their customer profile and Toll’s competitive edge in this product tier.
Other notable management comments in the quarter included the fact that 54% of orders and 46% of deliveries were from spec inventory. “Specs” in this case include homes under construction so the buyers can still influence the final design subject to the stage of construction. Specs have a modestly lower margin than the built-to-order units.
The “spec” process begins with a foundation in the ground and covers the full span of time to completion. They offered up the color that 1/3 of specs get sold up until framing and another 1/3 from framing to completion. The last 1/3 after completion. These last completed specs tend to have more incentives.
The company updated its strategy to increase supply of “affordable” Toll homes (“affordable” in relative terms for the Toll mix). These actions highlight management confidence in this market even with mortgage rates around 7%.
Toll by the numbers…

The above chart details the time series for revenues and income from 2019 to 2Q24. The peak in units was reached in FY 2022 in a pattern seen for a number of builders as contracts closed at a lag and prices rose sharply in 2022-2023. The volume peak in units was 2022 while peak dollar revenue totals for home sales was in FY 2023. The peak for signed contract value was 2021.
Meanwhile, dollar revenues keep rising. The 6M FY 2024 home sales revenues detailed above were up YoY and the same for the 2Q24 period for home sales. Gross margins for home sales were up FY 2023 and again for 6M 2024 but narrowed slightly for 2Q24.
The 2Q24 home sales revenue line was +6.3% accompanied by a big ticket land sale line of $190.5 million in 2Q24 vs. only $16.9 million in 2Q23. The one-off major land sale was property sold to a data center in Northern Virginia.

The above chart highlights the regional breath of the high price luxury market to combat the perception that only a select group of MSAs rule the mix (as with the brief run of the City Living segment). It is not just the dreaded “coastal elites.” The West Coast is always a region with higher prices, but the South region was #1 for 6M 2024 and the Mountain region was #1 in FY 2023 and FY 2022.
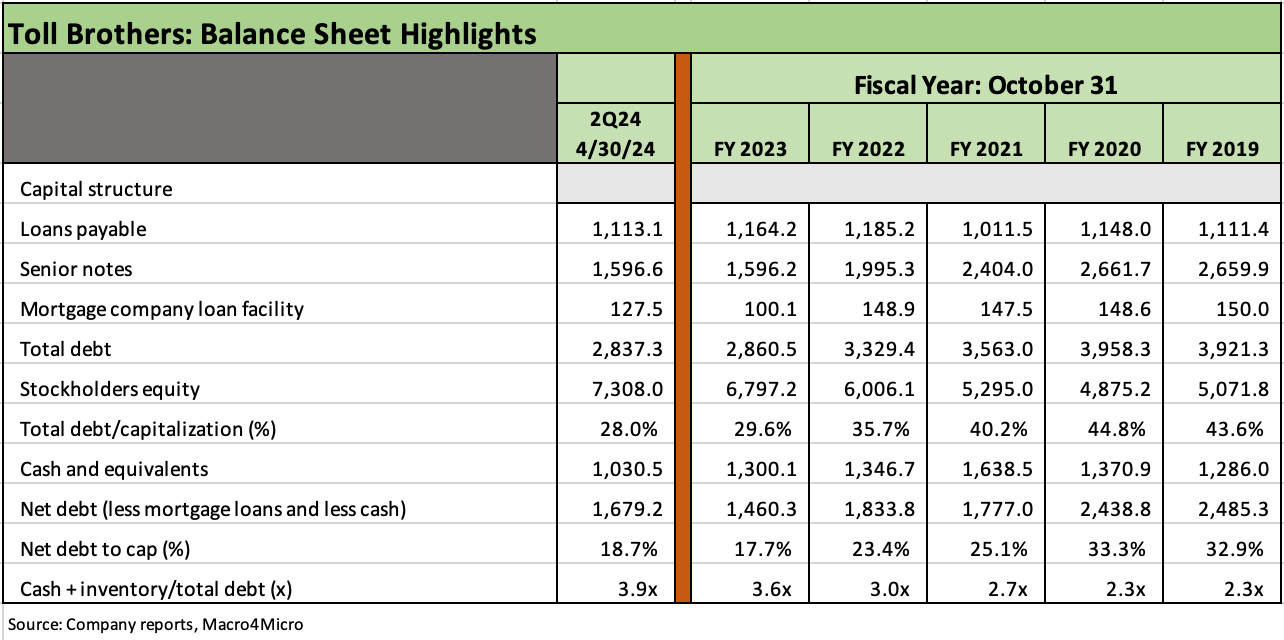
The above chart frames the cash and debt trends for Toll with net debt leverage (total debt less mortgage debt less cash) at only 18.7%. We see cash + inventory at almost 4x total debt. That is a very strong balance sheet in historical context even if not on par with NVR, D.R. Horton, and Lennar.
See also:
Other Housing:
Existing Home Sales April 2024: Pay More, Get Less, but More Available 5-22-24
Credit Crib Note: Taylor Morrison 5-20-24
Footnotes & Flashbacks: State of Yields 5-19-24
Housing Starts April 2024: Recovery Run Rates Roll On 5-16-24
PulteGroup: Strong Volumes, Stable Pricing 4-24-24
New Home Sales March 2024: Seasonal Tides Favorable 4-23-24
D.R. Horton: Ramping Up in 2024 Despite Mortgages 4-19-24
Existing Home Sales March 2024: Not Something Old, Something New 4-18-24
Other Toll Brothers:
Credit Crib Notes: Toll Brothers (TOL) 9-11-23
Industry Comment: Homebuilders Still Feeling the Love with Toll Brothers Results 5-28-23