
CPI March 2025: Fodder for Spin
The CPI numbers for March have that “before the storm” feel. The storm forecast is on pause even if we know it is coming.

Is that $64 trillion? Sum of GDP for Asia, EU, Canada and Mexico?
The favorable MoM CPI trends are good for mental calisthenics, but the real game lies ahead as tariffs kick in. The tariffs that are operating now are rolling into transactions and will work their way along the chain from the seller to the “buyer” and then across the wholesale/retail chain to the end market customer. Someone will pay higher prices or higher costs. Lower volumes are a risk for some as elasticity kicks in.
Trump and too many GOP leaders deny the fact that the “buyer pays” and dance around the topic. I was watching Jason Smith (GOP Chair of House Ways and Means Committee) on CNBC yesterday ducking a direct factual question on “Who pays the tariff.” After some awkward pauses he essentially said, “the seller does by cutting their prices” (Invite him back during the summer). There was a time long ago when “Ways and Means” was the most powerful committee in Congress.
We are now essentially in a full-on trade war with the #2 importing nation of 2024 (China, Mexico was #1). The #1 importer overall (the EU as a bloc) is in slow (temporarily paused) retaliation mode and the USMCA partners are facing a mix of tariffs for key products from Mexico (autos), Canada (aluminum, steel, autos, lumber and more to come). Some will now just see a delay while others charge ahead.
For March, the headline CPI YoY of +2.4% is down from 2.8% in Feb 2025 with Core CPI of 2.8% down from 3.1% in Feb. Energy came in with a MoM -2.4% including -6.1% for Energy Commodities (-9.5% YoY) and Gasoline at -6.3% MoM (-9.8% YoY) with lower oil in part tied to the forecasted demand pain from tariffs and weaker economies (including the US). OPEC supply decisions also added to the oil weakness.
It is worth noting that new vehicles at +0.1% MoM and 0% YoY are in the 25% import crosshairs while used vehicle deflation of -0.7% MoM is will see inflation head much higher under the new vehicle tariff regime. Meanwhile, Medical Care Commodities came in at -1.1% MoM and +1.0% when Pharma is a highlight of the Trump tariff plans.
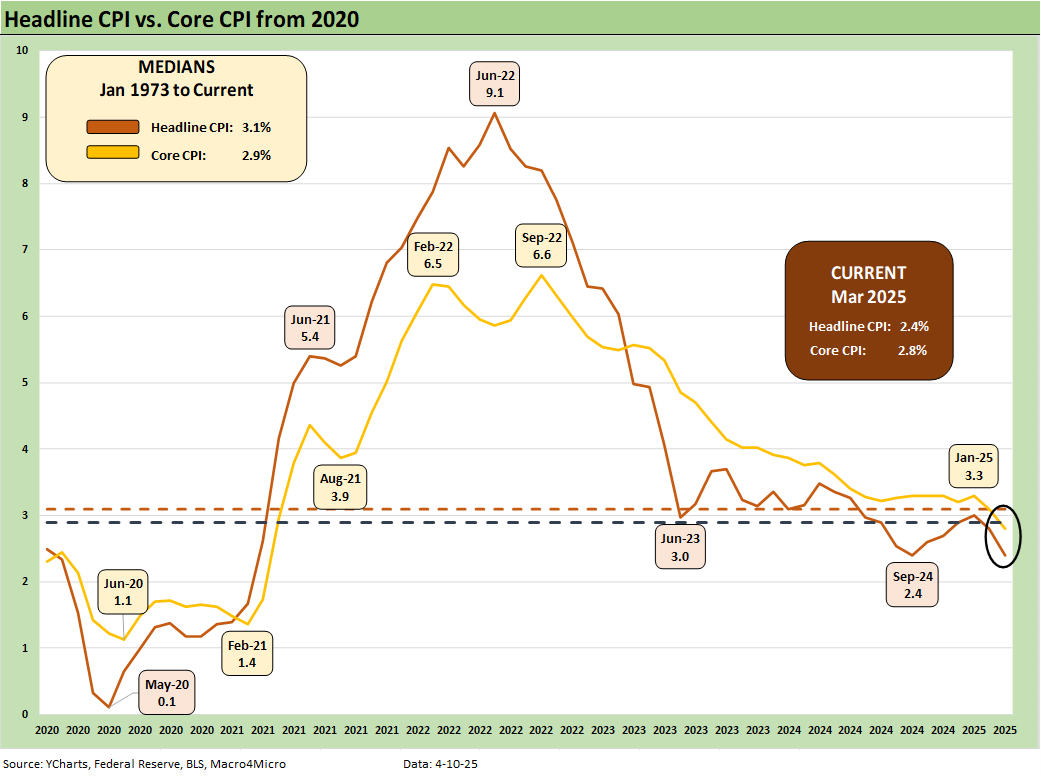
The wild CPI ride is captured above, and the market is now at a pivotal transition point as product and services sellers try to figure out what their cost structures will look like as these tariffs enter the period of actual transaction flows. Those affected are only just starting to feel the tariffs in place after the above March CPI numbers.
As noted in the bullets, the disinformation police have barricaded themselves inside a cell and are letting the talking heads of political interests run amok. Many are still representing that tariffs are paid by the seller in a continuation of their magic frictionless wheel sales pitch. Trump posted yet again this week that China pays the tariffs. After a while, the whole process gets absurd. The disinformation was partially echoed by some senior congressional types to the extent the media has the guts to even ask them such a simple question” “Who pays?”
Price increases are coming, and costs are rising. You can run, but you cannot hide. Looking at a few lines from the March CPI are worth considering:
New vehicles: New vehicles posted +0.1% MoM (SAAR) and 0% YoY (unadjusted). The 25% tariff on auto imports brings assured supply-demand imbalances that will be felt as time passes. There was a binge of new car pre-buying to stock up for spring selling season, and retail vehicle sales also took off in 1Q25 and into March. The lower cost, pre-tariff inventory at dealers will run down and pricing decisions by OEMs and dealers will get tougher.
Used vehicles: The used vehicle CPI deflation MoM was -0.7% and +0.6% YoY, but that will change dramatically looking ahead. The market view on side effects of high auto tariffs were immediate with the expectation of a material supply-demand imbalance in both new and used with used vehicle prices potentially driving double-digit increases for used. The Section 232 tariff for autos is already on the books, so used cars will rise even more than new vehicles on affordability. That marks a major departure from the March 2025 used vehicle CPI numbers. We checked out CarMax earnings and the investor call today, and they were getting a lot of questions on double-digit price upside for used vehicles. Sourcing vehicles will also get competitive.
Durables: The aggregate Durables CPI line in Table 3 of the CPI shows Durables at +0% MoM (SAAR) and YoY deflating at an unadjusted -1.0%. That Durables CPI will head higher on tariffed products as well as on input costs (materials). “Durables” tend to evoke the images of steel, aluminum, copper, and lumber. Some are already under heavy tariffs (steel and aluminum) with copper and lumber both immediate targets. Lumber from Canada already faces significant duties and they are going higher even before the additional tariffs. Copper is already in the Section 232 national security “reverse engineering shop” where the opinion goes in, and the research support comes out the other side.
Health care commodities: Pharma is the #2 import into the US just behind autos and is the #1 import from the EU. Meanwhile, China is a major supplier of medicines and medical supplies. Medical care commodities (basically “goods” including pharma) weighed in at -1.1% MoM and +1.0% YoY. That will be heading materially higher based on the tariff talk whether tariffs on the leading nations or on any potential special tariffs on a range of pharma goods. That will flow into household costs, employee benefit packages (co-pays, etc.) and will beat up Medicare and Medicaid costs. It takes a special kind of cruel and stupid to go down that path.
The fears around China cutting off the supply of various pharma ingredients gets whispered in back rooms and by some tagged as alarmists. It tends to come up with Taiwan war game chatter and the massive economic fallout that would come with that. There are trade weapons to apply on supply chains that are not tariffs. You can bet China has thought those through.
Apparel: The apparel line is one that got more focus in this recent bout of tariff panic when more people realized what such tariffs could mean to clothing and footwear (see Tariffs: Some Asian Bystanders Hit in the Crossfire 4-8-25). Textiles are on the list of industries on the secular offshoring list and include a high component of labor cost realities that will keep those products offshore. With Apparel MoM (SAAR) down from 0.6% in Feb to 0.4% in March and YoY at 0.3% (2.6% weighting), the clear direction of tariffs would take that Apparel CPI higher.
In the end, raw material costs roll into the “cost of sales” lines for manufacturers and higher inventory costs on tariffed goods will roll into the cost line of retailers. That is true whether an imported BMW or a plastic guitar from China “over in aisle 9.” That product is on a shelf 100 yards away in the giant Walmart in Someplace, USA.
Whether Walmart or Amazon, that merchandise retail store is packed with goods that depend on a low-cost sourcing strategy that is being badly impaired by Trump Tariffs which seek to undermine corporate low-cost sourcing and consumer choice for lower priced products. Barry Goldwater’s hand is sticking up from the dirt while Ronald Reagan is spinning in his grave in their race to come back and straighten this out.
Raising material costs via tariffs also is not a great way to support US manufacturing even if it helps some such as domestic steel. It hurts vastly more US business lines that use such raw materials. That is straight from the GOP-heavy trade groups who want low-cost materials sourcing even just domestically. Tariffs on raw materials is a disincentive for many manufacturing companies to build in the US even if it starts fresh steel investment.

The above chart details our favorite lines from the Special Aggregates table of the CPI release. “All items less shelter” at 1.5% is always a nice one to calm nerves since the Shelter lines (35.4% of the CPI) come with too many asterisks around how line items such as Owner’s Equivalent Rent” or “OER” (26.1% of CPI) tie into (more to the point do not tie into) household cash flow. Rent does directly impact checkbooks, but OER is a theory.
The Services CPI line brought some good news moving under 4% to +3.7%. That was joined by a number of the other “Service ex” lines as noted in the chart. As discussed above, Durables was still deflating YoY at -1.0% but with a major threat ahead in the form of tariffs and material cost increases that will need to be recovered somewhere along the line. Nondurables were also lower and dipped from 1.3% to +0.5%. Nondurables less food posted -2.2% (not shown here). That is 11.7% of CPI.

The above chart updates the Fed Fund Effective Rate (FFER) vs. the Headline CPI as a matter of comparison on how “real” the real fed funds rate is even though the more common comparison is fed funds vs. Core PCE given the FOMC preference for PCE (see PCE Feb 2025: Inflation, Income, Outlays 3-28-25). With the fed funds effective rate at 4.3% and CPI at 2.4%, the relationship is in a proper balance in historical context (not always the case).

The above chart breaks out the Big 5 buckets we look at each month that dominate the CPI index. We include a customized bucket for Automotive that more accurately profiles the relative scale of importance that autos hold in household budgets even before gasoline (see Automotive Inflation: More than Meets the Eye 10-17-22).
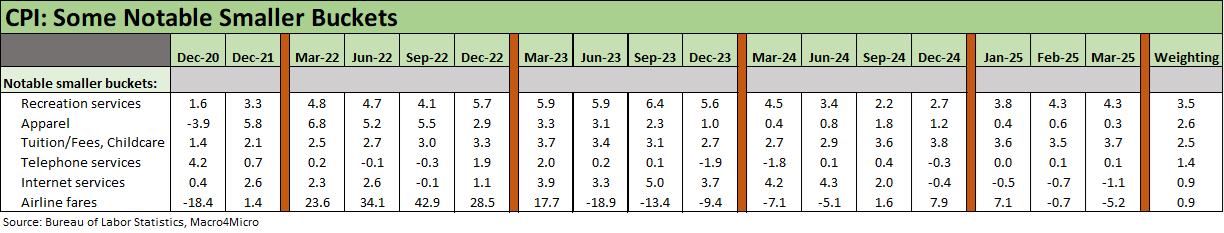
The above table updates 6 product and service buckets near and dear to many households. We see 3 with lower CPI, 2 flat, and 1 higher. Only “Tuition/Fees, Childcare” was higher.
We discussed the likely CPI pressure on Apparel above and how that ties into tariffs. High tariffs on “labor cost arb” nations will only cause inflation both from the tariffs and based on the likely outcome of offshore retrenchment as volumes decline. Crushing Cambodia and Indonesia would seem like a low priority on the “Cut and Sew” line when the trade deficit with such nations is so rational and logical – unlike the tariff policy formula.
The Recreation Services CPI and Airline Fares are interesting not only in the context of the consumer cycle and how tariffs could affect those lines, but the tourist trade is getting debated more around the “angry at America” angle such as we see in the Canadian media. There are also some questions about where various currencies are heading as the dollar soared and then started to weaken. Airline Fares are tied to demand and to jet fuel prices and those two may go in different directions in coming months. Delta reported earnings this week, and they cited soft domestic travel and “main cabin” weakness. Premium continues to do well.
Other Inflation Related:
Employment Cost Index 4Q24: Labor Crossroad Dead Ahead 1-31-25
Inflation: The Grocery Price Thing vs. Energy 12-16-24
Inflation Timelines: Cyclical Histories, Key CPI Buckets11-20-23
Automotive Inflation: More than Meets the Eye10-17-22
See also:
Footnotes & Flashbacks: Credit Markets 4-6-25
Footnotes & Flashbacks: State of Yields 4-6-25
Footnotes & Flashbacks: Asset Returns 4-6-25
Mini Market Lookback: A Week for the History Books 4-5-25
Payroll March 2025: Last Call for Good News? 4-4-25
Payrolls Mar 2025: Into the Weeds 4-4-25
Credit Snapshot: AutoNation (AN) 4-4-25
Credit Snapshot: Taylor Morrison Home Corp (TMHC) 4-2-25
JOLTS Feb 2025: The Test Starts in 2Q25 4-2-25
Credit Snapshot: United Rentals (URI) 4-1-25
Mini Market Lookback: The Next Trade Battle Fast Approaches 3-29-25
PCE Feb 2025: Inflation, Income, Outlays 3-28-25
Auto Tariffs: Questions to Ponder 3-28-25
4Q24 GDP: The Final Cut 3-27-25
Durable Goods February 2025: Preventive Medicine? 3-26-25
New Homes Sales Feb 2025: Consumer Mood Meets Policy Roulette 3-25-25
KB Home 1Q25: The Consumer Theme Piles On 3-25-25
Lennar: Cash Flow and Balance Sheet > Gross Margins 3-24-25
Mini Market Lookback: Fed Gut Check, Tariff Reflux 3-22-25
Existing Homes Sales Feb 2025: Limping into Spring 3-20-25
Fed Action: Very Little Good News for Macro 3-19-25
Industrial Production Feb 2025: Capacity Utilization 3-18-25
Housing Starts Feb 2025: Solid Sequentially, Slightly Soft YoY 3-18-25
Retail Sales Feb 2025: Before the Storm 3-17-25
Mini Market Lookback: Self-Inflicted Vol 3-15-25
Credit Spreads: Pain Arrives, Risk Repricing 3-13-25
Tariff and Trade links:
Tariffs: Some Asian Bystanders Hit in the Crossfire 4-8-25
Tariffs: Diminished Capacity…for Trade Volume that is…4-3-25
Reciprocal Tariff Math: Hocus Pocus 4-3-25
Reciprocal Tariffs: Weird Science Blows up the Lab 4-2-25
Tariffs: Stop Hey What’s That Sound? 4-1-25
Tariffs are like a Box of Chocolates 4-1-25
Auto Tariffs: Questions to Ponder 3-28-25
Fed Gut Check, Tariff Reflux 3-22-25
Tariffs: Strange Week, Tactics Not the Point 3-15-25
Trade: Betty Ford Tariff Wing Open for Business 3-13-25
CPI Feb 2025: Relief Pitcher 3-12-25
Auto Suppliers: Trade Groups have a View, Does Washington Even Ask? 3-11-25
Tariffs: Enemies List 3-6-25
Happy War on Allies Day 3-4-25
Auto Tariffs: Japan, South Korea, and Germany Exposure 2-25-25
Mini Market Lookback: Tariffs + Geopolitics + Human Nature = Risk 2-22-25
Reciprocal Tariffs: Weird Science 2-14-25
US-EU Trade: The Final Import/Export Mix 2024 2-11-25
Aluminum and Steel Tariffs: The Target is Canada 2-10-25
US-Mexico Trade: Import/Export Mix for 2024 2-10-25
Trade Exposure: US-Canada Import/Export Mix 2024 2-7-25
US Trade with the World: Import and Export Mix 2-6-25
The Trade Picture: Facts to Respect, Topics to Ponder 2-6-25