
Credit Crib Note: D.R. Horton (DHI)
We summarize the financial and operating trends for D.R. Horton.


Note: As we go to print with this latest D.R. Horton Credit Crib Note, DHI priced a $700 mn bond deal (5.0% of 10-15-34) at +115, which in our eyes splits the difference between what is a high BBB composite and a name which should be an across-the-board single A tier issuer.
CREDIT TREND: Positive
D.R. Horton is at the top of the credit ladder (with NVR) among the major builders at a composite high BBB credit rating, but the risk profile of DHI is more like a single A when factoring in extremely low net debt, high balance sheet liquidity, low consolidated debt leverage, exceptional asset coverage (homebuilding inventory vs. homebuilding debt), and the cash flow flexibility that is intrinsic to its working capital cycle.
DHI has been tested by a wide range of cyclical and yield curve backdrops and came out the other side stronger than the peer group. DHI still ranks #1 in revenues and volumes even without being a participant in some of the large-scale M&A along the timeline since the housing bubble and mortgage crisis years. While DHI will roll up private builders as we see with others in the peer group, DHI so far has not been a big bang buyer of public builders as we have seen with Lennar and Taylor Morrison among others. We do expect more consolidation across the builders.
DHI’s demonstrated ability to grow both sides of its balance sheet while rewarding shareholders has been proven across various economic backdrops including the most aggressive Fed tightening cycle in four decades. With considerable monetary and top-down economic governance uncertainty ahead (taxes, tariffs, attacks on investment funds for buying homes, etc.), DHI makes for a good core holding in the credit markets. The company can essentially choose its balance sheet strength at its discretion, and DHI has struck a very favorable balance for its stakeholders across equity and debt.
OPERATING PROFILE
As the #1 US homebuilder, DHI has the broadest range of geographic market exposure with one of the lowest average sale price levels in the major builder peer group with only LGI Homes slightly lower. The favorable demographic trends for housing demand and how that demand dovetails with US median income levels for affordable homes bode well for future volumes at DHI given its track record in its core homebuilding operations and its market share in so many leading MSAs.
DHI boasts reliable supplier chain relationships established over years given DHI’s ability to deliver reliable business flow in single family markets as well as in its growing rental operations. The supplier chain uncertainty experienced in 2020-2021 could flare up again in 2025 subject to tariff risks and trade disruptions.
The financial and operating profile is dominated by its legacy single family homebuilding operations, but DHI has very successfully integrated financial services, single family and multifamily rental construction, and land/lot development operations into its extended business mix. The financial services operations are especially important to DHI’s ability to creatively expand its buyer base using incentives during the Fed tightening cycle (see D.R. Horton: Credit Profile 4-4-23).
FINANCIAL TRENDS
High inventory coverage of homebuilder debt as well as low consolidated debt leverage presents an impressively low credit risk profile relative to the BBB tier composite ratings. DHI combines low leverage metrics, high balance sheet liquidity, and strong discretionary free cash flow generated by its homebuilding operations that allow DHI to expand its operations while rewarding shareholders via buybacks and dividends.
DHI bondholders have materially stronger protection than the consolidated numbers indicate given the guarantor structure that offers additional protection (or less dilution risk) to the homebuilding creditors than might at first be obvious in the consolidated numbers. DHI and the building subsidiaries do not guarantee the other borrowing entities, which are stand-alone borrowers. It is a structural positive, but the consolidated entity and all its business lines are doing well regardless.
We view the major builders’ ratings criteria as too harsh relative to the demonstrated financial resilience of the homebuilder group across a wide range of markets and different types of cycles. Homebuilders have superior operating cash flow dynamics relative to high fixed cost manufacturing operations and better asset protection than leveraged “asset-lite” borrowers. They also offer less commodity price risk than large cap BBB tier energy names.
The variable cost structure of the major builders serves as an “ace in the hole” in recession scenarios. One unusual twist in the recession scenario is that long rates could (should) move lower and allow DHI to tap into the high base of pent-up demand for housing. A recession would be set against a backdrop of modestly higher unemployment than current levels, but the macro payroll counts have a lot of room to maneuver with a long-term unemployment median over 5% (see Payroll July 2024: Ready, Set, Don’t Panic 8-2-24).
Even in a downturn, demographics favor sustained high housing demand and notably if the recession brings lower mortgage rates. A slowdown has the effect of generating high free cash flow at the builders as inventory goes into liquidation and downsizing mode. That is a fact of the working capital cycles. In other words, DHI has less risk than investment alternatives in a downturn.
The worst outcome for the entire economy and market would be a stagflation scenario, but even there the builders are better positioned vs. BBB and low single A tier comps in such a macro setback. Inventory will still liquidate, and the question will be “at what margin.” High fixed cost, capex-intensive issuers in other industries will feel that pain more and especially in cash flow.

DHI operating results have held in very well during the tightening cycle in terms of revenue growth and profit margins, but the 2022 numbers are still the record for gross profit margins. The FY 2022 numbers saw contracts roll into a new set of economic headwinds for homebuyers as the year progressed with orders plunging in 2022 ahead of the 2023 and 2024 rebound in orders.
Weaker gross margin comps YoY in 2023 vs. 2022 are still posting higher margins in historical industry context than the low 20% handles of 2019 vs. the current 23-24% range for YTD 3Q24. The 2022 record margins almost reached 29%.
In looking at the profit margin transition from FY 2022 into FY 2023, it is important to remember that DHI has a 9/30 fiscal year and that the more serious pain on rates set in during late calendar 2022 and into 2023. The UST curve was moving fast from the fall of 2022 into the last hike in July 2023 that saw mortgages eventually flirting with 8% before the high 6% range of recent weeks.
DHI and numerous other major builders have seen a favorable turning point in sales order rates after a brutal period as the “sale orders” line above started climbing again in FY 2024 after plunging during later 2022 with higher mortgage rates.
We see the backlog decline in 2023 and declining again YTD 2024 as order growth rates start to level off, building cycles shorten, and the affordability challenge “linger for longer” than many had anticipated in the high 6% range for 30Y mortgages (see Footnotes & Flashbacks: State of Yields 8-4-24). The buyers in many cases are waiting for better rates and lower monthly payments and especially in lower price ASP tiers.
We see mild weakness in average selling prices in FY 2023 vs. FY 2022 and again YTD 2024 with a slight increase in ASP in the 3Q24 period.
Overall, higher volumes in closings with modest movement in prices has worked well for DHI in stabilizing margins in a narrow band in the 23%-24% area.

The business segment profitability is broken out above and is the first layer of disclosure for profitability before we get into the regional homebuilding segment profit reporting (the next two charts).
The segment pretax income broken out above shows YTD 3Q24 pretax income higher for homebuilding as the most critical and overwhelming segment line in the picture but also higher for Forestar and Financial Services. Only Rental was lower given the lumpy nature of the Rental projects and sales timing.
Segments for homebuilders are usually dominated by the geographic reporting of the single family building operations, but DHI boasts profitable stand-alone business lines across Rental, Lot/Land Development (Forestar), and Financial Services that allows those operations to borrow without any guarantees from DHI and the homebuilding debt guarantors.
As evident in the chart, pretax income is dominated by Homebuilding (88% of YTD 3Q24 pretax earnings), and the homebuilding operation in turn supports the success of Financial Services and Forestar through DHI homebuyer volumes.
The Rental operations leverage DHI’s local market knowledge and ability to budget and build to a price and cost structure appropriate for the local market.

The above chart details volume trends for “homes closed” and record volume mix across the various reporting regions.
South Central is dominated by Texas while the Southeast is led by Florida. The “East” includes Georgia, the Carolinas, and Tennessee. The Southwest includes Arizona, California, and Nevada among others. The Northwest includes the usual suspects of Washington and Oregon but also includes Utah and Colorado. The “North” is a laundry list but includes states such as Pennsylvania, Virginia, Maryland, Ohio, Minnesota, and Illinois among others. DHI is not unusual among major builders in its creative designation of groupings by region.
The main takeaway from the chart above is that total closed home volumes hit a record in FY 2023 and are up again YTD 3Q24 by +10%. All six regions are higher in volume YTD.
We don’t break out the ASP details by region in this commentary, but for some Hi-Lo flavor for the YTD 3Q24 period, the highest ASP for homes closed was the Northwest at $504K and the lowest was South Central at $325K. Over half the DHI closing volume was in the combined totals of South Central at $325K and Southeast at $361K.
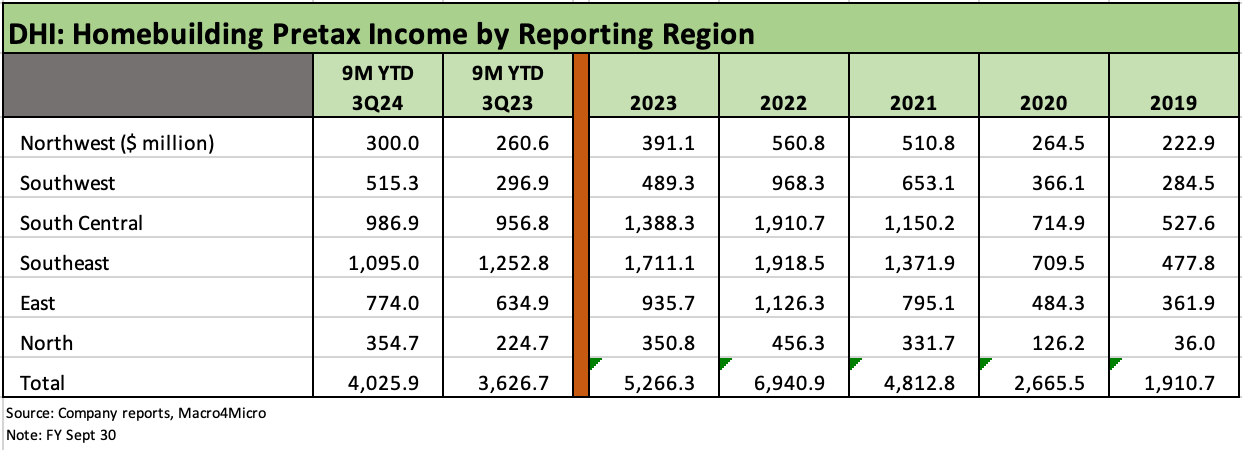
The homebuilding segment breaks out profitability by reporting region above, and the regional mix offers some more granularity on how different regions have seen profits fall from the peak FY 2022 numbers.
Every segment posted a decline in pretax income during FY 2023 vs. FY 2022, but 4 out of 5 have posted higher income YTD 3Q24 with only the Southeast modestly lower.
The Southeast was the most profitable geographic region in both YTD periods as well as in the prior 3 full fiscal years from 2021 to 2023.

The inherent cash flow resilience of the builders comes with a high variable cost structure, low fixed costs, and natural cash flow generation from working capital downsizing if the market slows down and inventory is gradually liquidated into cash.
The cash flow statement highlights why a focus on working capital is more important than EBITDA in framing balance sheet risks. That funds flow dynamic is why banks use book value leverage paired with interest coverage in structuring their bank covenants (capitalized interest gets baked into the analysis as well).
The chart above shows some important and very large moving parts of the cash flow story with the running deltas in construction-in-progress and finished homes and investments in lots and land spend (development or acquisition).
In DHI’s case, you also see how the homebuilding cash flow (that gets its own disclosure line each quarter) underwrites spending in other business lines where those units also have their own stand-alone borrowing programs (i.e. not guaranteed by the homebuilding operation).
The above chart highlights the cash flow and reinvestment dynamics of DHI as the homebuilding operation provides excess cash flow for investment in Rental operations and buying back stock and funding dividends.
The free cash flow from the single family homebuilding operation generated the excess balance sheet liquidity and cash hoard, and that liquidity comfort zone has allowed DHI to execute on stock buybacks over the $1.1 bn level in both 2022 and 2023. DHI has already surpassed those levels at $1.23 bn through 9 months YTD 3Q24.

DHI has a rock-solid balance sheet that is single A quality at worst, but the DHI ratings get trimmed by the agencies for theoretical business risk into a high BBB tier rating despite the healthy excess asset coverage and inherent cash flow flexibility. Fitch has justifiably broken from the gang of two with a low single A.
Net homebuilder operations debt was $83.5 million at 3Q24, and total homebuilding debt was $2.25 bn vs. homebuilder cash of $2.17 bn.
Consolidated total debt leverage was 18.5% (18.8% ex-noncontrolling interests) and net leverage was 9.7%.
Very healthy asset coverage is evident in the Homebuilder Inventory/Homebuilding Debt ratio running at a high over 9x as of 3Q24.
Purchase contracts comprise 76% of lots controlled, limiting balance sheet risk and loss exposure to land impairments.
The financial risk of DHI’s homebuilding debt is even lower than the overall consolidated entity given how DHI has configured its guarantor and recourse exposure across its business units.
We see financial debt distributed across its land/lot development subsidiary Forestar, its financial services business, and its growing single family and multifamily rental operation. Those entities have their own debt and are not guaranteed by DR Horton. The operations outside the homebuilding segments are also distinctly profitable in their own right.
The debt obligor mix, guarantor mix, and nonrecourse structural nuances across the family tree of companies underscores DHI’s priority of protecting the credit risk profile of the core homebuilding segment that generates over 93% of revenues through 9M YTD FY 2024.
Highlights and History
DHI ranks as the #1 US homebuilder ahead of Lennar at #2 with Pulte a distant #3 based on home sales (see Homebuilders: Equity Performance and Size Rankings 7-11-24).
DHI boasts a broad national footprint and strong position in leading single family markets such as Texas, in the Southeast, and in the Southwest. DHI has been especially well situated in the states where secular trends in population growth are most favorable.
The company has regularly flagged that it is #1 in 15 of the Top 50 markets and #1 in 4 of the Top 5 markets. DHI boasts significant market share leadership in metros such as Dallas, Houston, Atlanta, Phoenix, and Austin over the last decade.
DHI product offerings run the full range of product tiers from entry level to luxury, but its regional breadth and strategy still leaves it at the low end of average selling prices as a builder. In a world of uncertain mortgage rates, the low ASP is a positive, and especially as mortgage rates come down.
Forestar is a 62% owned land developer with close operational ties to DHI but operates as a stand-alone, publicly traded equity and bond issuer (low BB tier not guaranteed by DHI).