
PCE Inflation Oct 2024: Personal Income & Outlays
The PCE release showed PCE inflation in line, flat to Sept MoM, but sequentially higher for YoY headline and Core PCE.


Not enough for inflation? Maybe we should get the tariff blowtorch?!
The Oct 2024 Personal Income and Outlays release showed the PCE price index in line with expectations but also slightly higher as the Services price index YoY came in at +3.9%, up sequentially from +3.7% in Sept and the highest since May’s +3.9% and April’s +4.0%.
Disposable personal income in current dollars rose more on a MoM basis than consumption and savings rates ticked higher sequentially to 4.4% from +4.1%.
Goods remain in deflation mode YoY for both Durables (-1.6%) and Nondurables (-0.6%) with Services still the culprit at +3.9%.
Earlier in the day, the second estimate of 3Q24 GDP showed the PCE price index for the 3Q24 period at +1.5% and Core at +2.1%, so the +2.3% headline for Oct and Core of +2.8% are small setbacks in the FOMC easing derby.

The above chart updates the running differential between fed funds and the Core PCE Price Index from 1973 through the current release. The purpose is to give a proxy for relative tightening based on real fed funds and frame the current 2.0% differential in the context of a range of macro backdrops that include the inflationary 1970s and the Volcker inflation wars.
The long-term median differential of +1.3% gives some room to maneuver as we head into 2025 subject to how one views the realistic need to hit a 2.0% inflation target (outright or based on recent annualized run rates, etc.). As of today, the odds of a -25 bps cut are back to around 70% after dipping into the 50% handle range in recent days.
We detail some timeline medians along the way in the box above, and the discipline of the mid-1980s to late 1990s stands out during what was two decades of bull markets. The current differential of +2.0% is wide to the housing bubble median and the post-crisis market.

The above chart updates the PCE and Core Price indexes for a memory jogger of what inflation looked like across the cycles. We include a history box for some notable themes and events across the years.
The 1970s were clearly painful as was the 1979 to 1982 whipsaw. The 1990 spike was wrapped around oil and the impending Gulf war while the summer of 2008 was a record oil spike just ahead of the crisis implosion in subprime and structured credit and derivative markets.

The above chart updates the differential across the decades for PCE vs. Core PCE as the differential swung around typically based on oil market volatility. Currently, oil has helped deflate headline PCE from Core with Services as the problem.
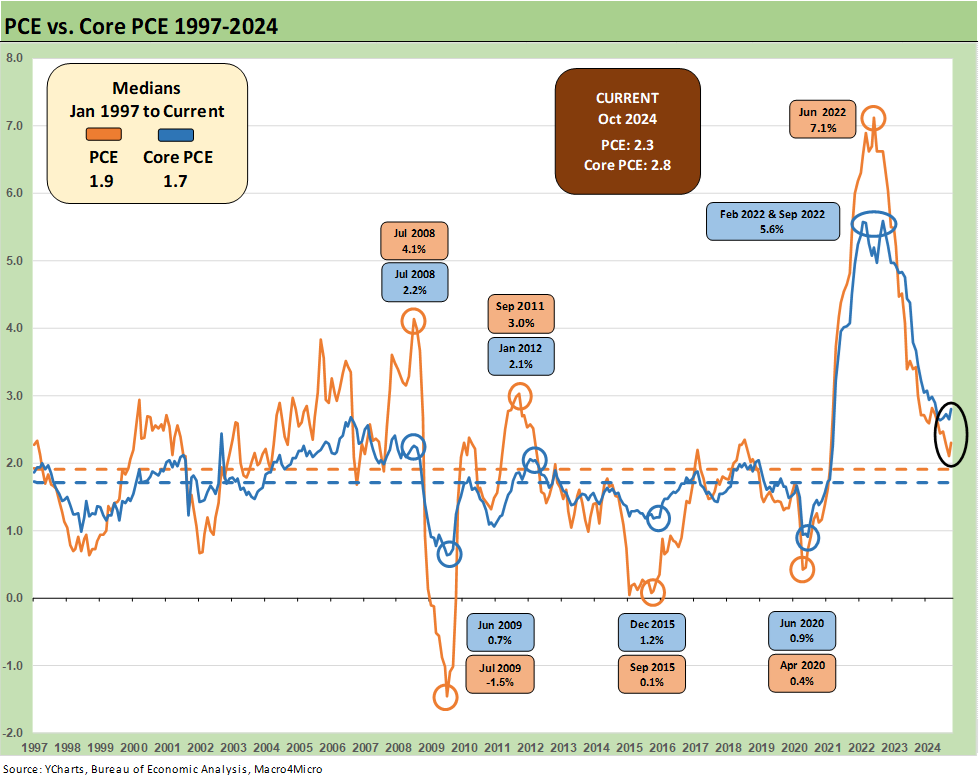
The above chart shortens up the timeline and median from 1997 for PCE vs. Core PCE in a reminder that sub-2% PCE numbers are possible at the median for headline and core. The asterisk on those levels in the defined time period is that “all you need” is a systemic bank crisis and a 100-year flood (as in a mass pandemic).

The above chart plots MoM Disposable Personal Income vs. PCE as a read on how wild things got during and right after the pandemic peak. This is a replay chart we use each month to flag the DPI swings that came with the three COVID relief/stimulus packages with two under Trump and one under Biden.
As a reminder, Trump signed the CARES Act in March 2020 (shows up in the DPI in April 2020) and Trump also signed the Dec 2020 legislation disbursed in Jan 2021 (he never seems to mention that one!). Biden signed the American Rescue Plan (disbursed in March 2021). The DPI and PCE wave tied to each of those shows up in the chart above.
The vaccine was just announced in early Nov 2020. That was soon a factor in PCE patterns and lag effects. The typical blame game from some is to lay all the cause-and-effect on the March 2021 disbursement. The idea is that a single stimulus plan signed by Biden in early 2021 was the cause of all inflation. That is a mix of partisan and dumb and certainly “politically axed,” but the Biden plan certainly made things worse from the demand side.
People were still debating who to blame for the bouts of 1970s/early 80s inflation decades later with the econ professors of the period now dead and buried. This will be no different. Trump fans tend to forget the stimulus bill that he signed in Dec 2020 disbursed in Jan 2021 and the invasion of Ukraine by Russia in Feb 2022 that also drove the ensuing spike in inflation to a June 2022 CPI high 9.1%. For their part, Biden fans tend to forget that “New Deal syndrome” was in fact a challenge for the Democrats in early 2021.
Our memory back to the 1970s tends to point at supply-demand imbalances as the natural explanation. The “money supply only crowd” is not as loud now as they used to be, and those discussions never get resolved anyway.
Inflation debates will be back in action in 2025 around what tariffs mean if prices get reset in a few big moves based on tariff cost spikes. The idea that a few big moves and pricing is not “sustained inflation” is the latest “economist as wordsmith” game. Low current inflation did not make the repriced menu from 2021 any easier. Neither will tariffs.

The above chart shortens up the timelines to just before the end of ZIRP and the tightening cycle for a sense of how that pattern of DPI vs. Consumption unfolded.
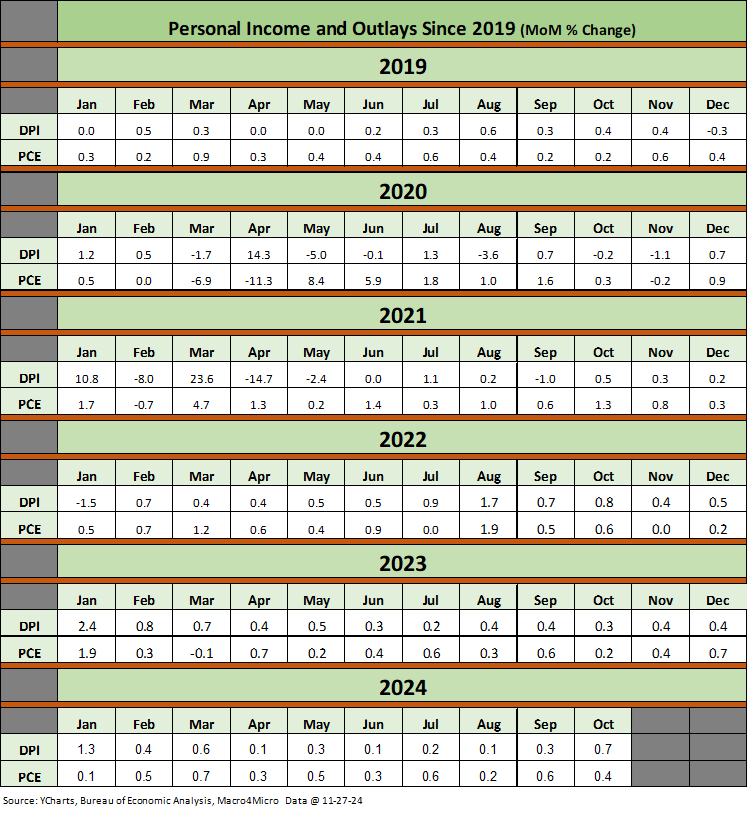
The above table is a cheat sheet for framing the DPI vs PCE swings from 2019 to this latest release. Watching where sustained PCE moves occurred relative to income can be useful for the direction of the consumer cycle vs. more defensive saving.
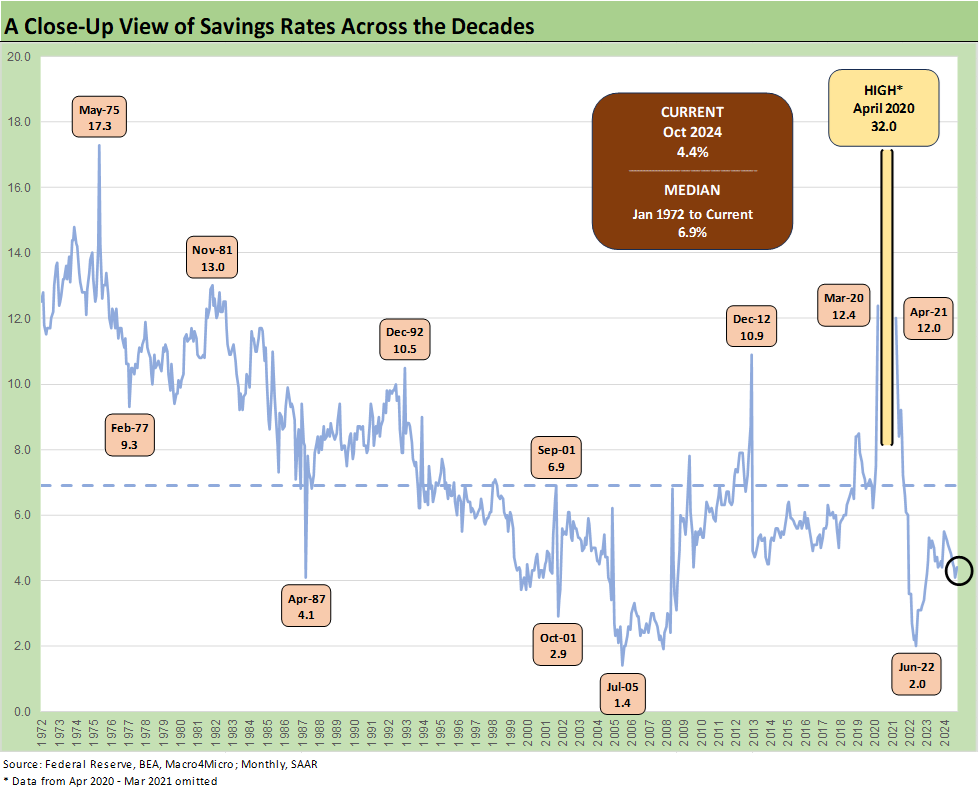
The above chart updates the saving rate history across the cycles from 1973 to the latest release. The current savings rate of 4.4% is running below the long-term median of 6.9%.
See also:
3Q24 GDP Second Estimate: PCE Trim, GPDI Bump 11-27-24
New Home Sales Oct 2024: Weather Fates, Whither Rates 11-26-24
Mexico: Tariffs as the Economic Alamo 11-26-24
Tariff: Target Updates – Canada 11-26-24
Footnotes & Flashbacks: Credit Markets 11-25-24
Footnotes & Flashbacks: State of Yields 11-24-24
Footnotes & Flashbacks: Asset Returns 11-24-24
Mini Market Lookback: Market Delinks from Appointment Chaos… For Now 11-23-24
Credit Crib Note: Ashtead Group 11-21-24
Existing Home Sales Oct 2024: Limited Broker Relief 11-21-24
Housing Starts Oct 2024: Economics Rule 11-19-24
Mini Market Lookback: Reality Checks 11-16-24
Industrial Production: Capacity Utilization Circling Lower 11-15-24
Retail Sales Oct 2024: Durable Consumers 11-15-24
Credit Crib Note: United Rentals (URI) 11-14-24
CPI Oct 2024: Calm Before the Confusion 11-13-24
Mini Market Lookback: Extrapolation Time? 11-9-24
The Inflation Explanation: The Easiest Answer 11-8-24
Fixed Investment in 3Q24: Into the Weeds 11-7-24
Morning After Lightning Round 11-6-24
Payroll Oct 2024: Noise vs. Notes 11-2-24
PCE Inflation Sept 2024: Personal Income and Outlays 10-31-24
Employment Cost Index Sept 2024: Positive Trend 10-31-24
Tariffs: The EU Meets the New World…Again…Maybe 10-29-24
Trump, Trade, and Tariffs: Northern Exposure, Canada Risk 10-25-24
PulteGroup 3Q24: Pushing through Rate Challenges 10-23-24
Trump at Economic Club of Chicago: Thoughts on Autos 10-17-24