
Footnotes & Flashbacks: Asset Returns 12-15-24
Another rough week saw a heavily negative tally across the benchmarks/ETFs as duration and equity valuation took a beating.


Disinformation and fact denial forges a ponderous chain…
The crosscurrents of 2025 policy expectations and the moving parts of the tariff, deportation, and trade issues are keeping the UST curve off balance with another bear steepener move and all bond ETFs coming up negative last week.
A few bellwether Tech names took center stage with Broadcom ringing up a +25% week and Tesla also in double digits with the NASDAQ being the only broad market benchmark in positive range (barely). The S&P 500, Dow, Russell 2000, and Midcaps were negative.
The total return score for the 32 benchmarks/ETFs we track was 5 positive, 1 at zero, and 26 negative. The 1-month time horizon posted 19-13 and the 3-month was 20-12 in a mixed wind-down to the year relative to the 31-1 YTD and 31-1 LTM with only the long duration TLT in the red for those longer trailing periods.
A reasonable (but not particularly helpful) CPI and warmer PPI will see the PCE price index added to the inflation scorecard this week with a slew of pre-Christmas releases on the calendar with (in chronological order) Retail Sales, Industrial Production, the FOMC meeting/dot plot, Home starts, Existing Home sales, the final 3Q24 GDP reading, and Friday’s PCE report.

The above chart updates our high-level benchmarks for the debt and equity line items we track. We line them up in descending order of YTD total returns. Even though we are in mid-December, the YTD and LTM differential still show the strength of the wild finish to Dec 2023 as the strong Nov-Dec 2023 posted quite a rally in both the US debt and equities (see Footnotes & Flashbacks: State of Yields 1-1-24), Footnotes & Flashbacks: Asset Returns 1-1-24).
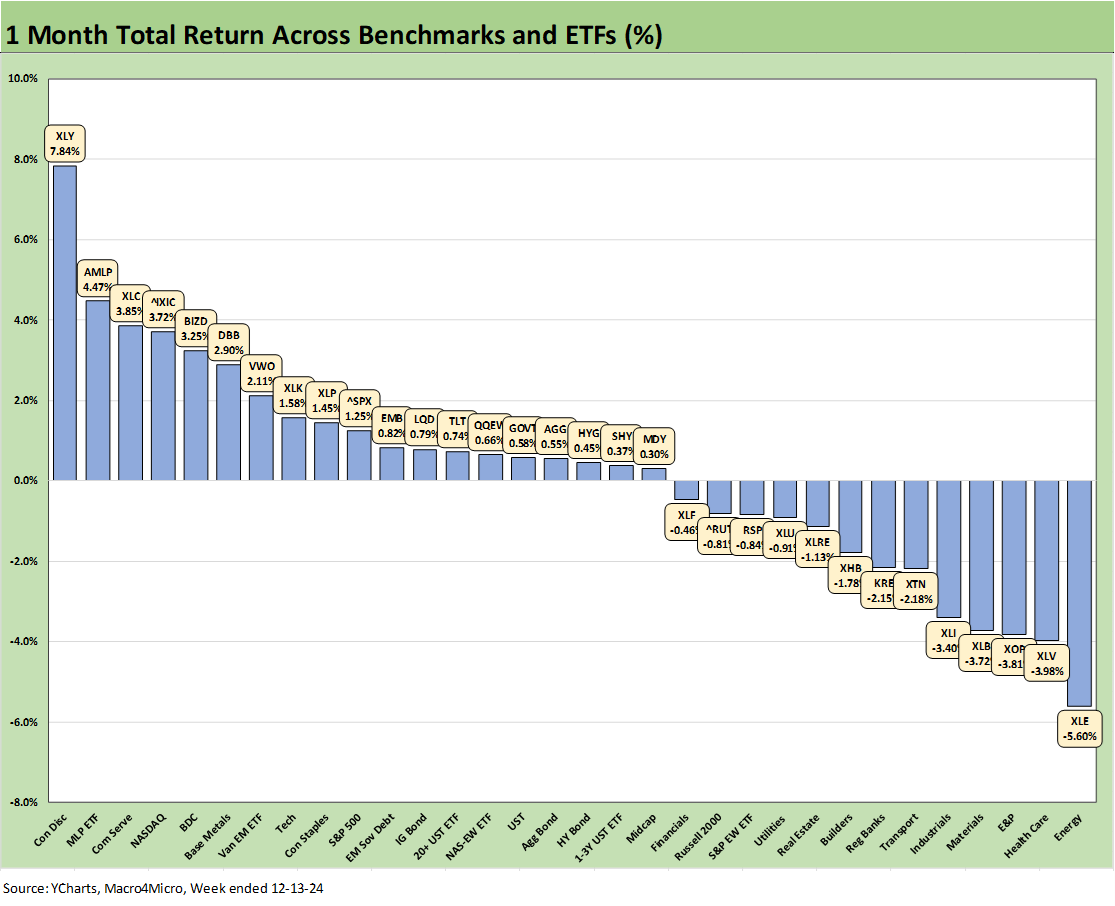
For the 1-month period, we see the fade in the Dow and Russell 2000 in negative range but also see the leadership of tech. The rolling 3-month returns in equities remain impressive with the dazzling post-election bounce still showing the NASDAQ as especially hot.
Over in debt, the curve struggles are evident and notably over 3 months with UST and IG Corporate both in the red but HY riding coupons and spread compression to positive returns.
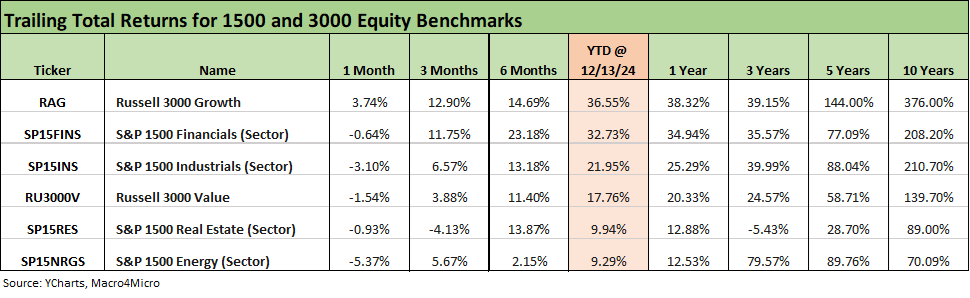
The 1500 and 3000 series is updated above, and the sudden adverse shift in equity market breadth is evident with 5 of 6 lines back in the negative zone for the 1-month time horizon. January 20 “Day 1” actions keep getting announced, so that will be a very busy 24 hours. Tariffs are at the top of our list.
The odds around the lineup of nominees getting confirmed have been improving over the past week, and that would necessarily create uncertainty given the nature of the lineup, qualifications, experience, and apparent priorities. Some of the lead nominees are objectively unqualified and lack experience to take on some of the most challenging roles anywhere. That is more fact than opinion given the profiles.
The priorities as voiced to date are worrisome. One this week included rolling decisions of FDIC up under the US Treasury to control “who gets what” in the depositor ranks in the event of another regional bank crisis. Some of the other stated priorities include arresting the opposition, purging military leadership, banning many vaccines (Polio tasting menu anyone? Nestled on a bed of listeria…).
We just hope the Project 2025 ambitions on downsizing the manpower dedicated to economic data (BLS, BEA, Census broadly) is not part of the plan. It would be one way to avoid accountability by undermining the data used by the markets to objectively evaluate the impact of these policies.
The rolling return visual
In the next section, we get into the details of the 32 ETFs and benchmarks for a mix of the trailing periods. Below we offer a condensed 4-chart view for an easy visual on how the mix of positive vs. negative returns shape up. This is a useful exercise we do each week looking for signals across industry groups and asset classes. We also have a YTD version that we include in the broader commentary on the time horizons further below.

The main takeaway from the above collection is the relative shift to the right (more negative bias) in the 1-week, 1-month, and 3-month periods as the year winds down. The rolling YTD and LTM numbers are overwhelmingly positive at 31-1. The shifts offer a reminder that, once you keep hitting all-time highs, the ability to push incremental returns has the intrinsic challenges of math but also the need for more catalysts to drive higher multiples, higher earnings growth, lower interest rates, or tighter spreads. That is easier forecasted than delivered with many equity multiples getting compared to prior bubble peaks and the same for credit spreads.
The good news is that a wide range of favorable EPS growth forecasts for 4Q24 and FY 2025 are getting delivered in year-end reviews. The trick is in the assumptions around what Trump 2.0 will bring in trade (record tariffs, retaliation, currencies, export weakness, etc.), mass deportation (labor fallout and wage inflation), budget deficits (record supply, questions on China UST holdings, record interest expense, etc.), health care (ACA repeal, premium increases, uncertain vaccine coverage by insurers, household financial stress on loss of coverage, etc.). There is of course more to come with the EU tariff game plan still a Truth Social waiting to happen.
The Magnificent 7 heavy ETFs…
Some of the benchmarks and industry ETFs we include have issuer concentration elements that leave them wagged by a few names. When looking across some of the bellwether industry and subsector ETFs in the rankings, it is good to keep in mind which narrow ETFs (vs. broad market benchmarks) get wagged more by the “Magnificent 7” including Consumer Discretionary (XLY) with Amazon and Tesla, Tech (XLK) with Microsoft, Apple, and NVIDIA, and Communications Services (XLC) with Alphabet and Meta.
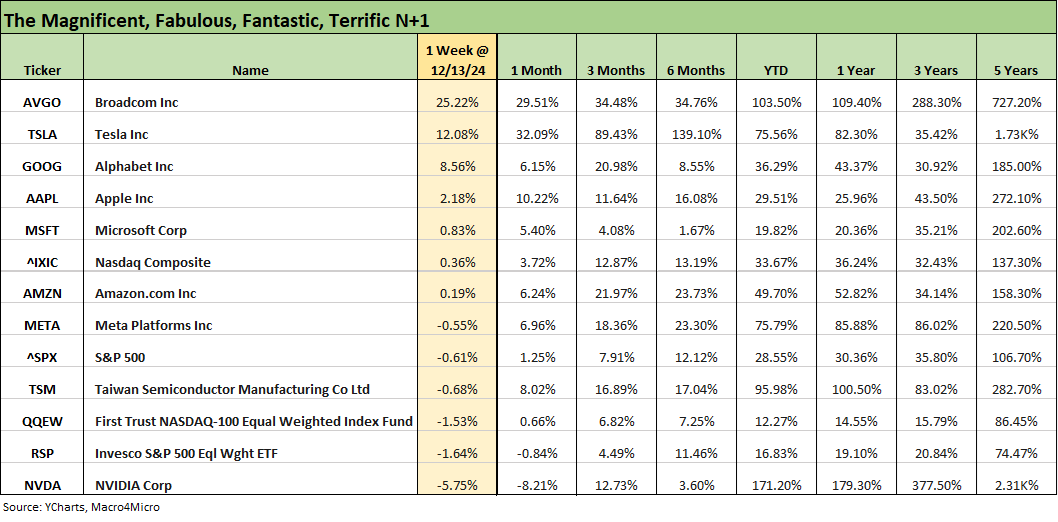
We already covered the bigger stories in the tech bellwethers in Mini Market Lookback: Macro Grab Bag 12-14-24. The monster move by Broadcom (AVGO) was more about its guidance on the spending plans of its customers as we excerpted in the Mini Lookback posted earlier.
The flip side of the strong tech performance is that market breadth has tanked. Both the S&P 500 and the Equal Weight S&P 500 ETF (RSP) are in negative range. We saw 9 of 11 S&P 500 sectors in the red. Midcaps and Small Caps were also both negative.

We got a head start in the Mini Lookback on the 1-week numbers, but the main takeaway is so few lines in positive range. We see only 5 positives, 1 at zero, and 26 negative. That follows last week’s 15-17 that came after 29-3 the prior week. That 29-3 followed back-to-back 31-1 weeks. The honeymoon might not be totally over, but a few things have been unfolding since then such as 25% tariff threats and a nominee checklist only a mother could love (with some apparent exceptions).
The tone gives the sense that extremism and excess and even purges might be the order of the day. Staying at the top of the headlines and maximizing tension has its price in market confidence.
The actual events and policy actions will only come with the clock running off. We like to read the Canadian news (Globe & Mail, Financial Post) and the tariff news has dominated the headlines in Canada with wide-ranging views and many very strong feelings on preparing to retaliate. The trade battle is unfolding with an election year in Canada in 2025.
Belittling a G7 nation and partner in NATO and NORAD as “the 51st state” and trash talking and embarrassing Trudeau (“Governor” of that 51st state) injects a heavy element of Canadian domestic political ire into the process. That is a catalyst for anger with the largest and highest value-added US export market and largest supplier of commodity goods, notably in crude oil and natural resources (see Tariff: Target Updates – Canada 11-26-24). Imagine Canada and Mexico both retaliating on US ag products at the same time (see Mexico: Tariffs as the Economic Alamo 11-26-24).
The 1-month scoresheet is 19-13 with all 7 bond ETFs in positive range even after rough week. That means equity/sector ETFs were 12-13. As we show in the next chart with the 3-month period, that 1-month comes off a stretch where 6 of 7 bond ETFs were negative for 3 months with only HYG at +1.17%. The ride off the Sept UST curve lows (10Y at 3.6%) now sees the 10Y back closer to 4.4% by late Friday after a +7 bps move Friday in 10Y and +6 bps in the 2Y UST. Friday was noisy.

The 3-month ride to mid-Dec includes a lot of yield curve action from the FOMC’s first easing in Sept (effective Sept 19). We see 6 of 7 bond ETFs in the red with HYG edging into a positive return on spread compression from HYG. As a frame of reference, HY OAS was +325 bps on 9-17-24. The HY index closed Friday at +268 bps. That is -57 bps tighter.
The winners from the election rally and fundamental news during earnings season and election rally show Tech and Financials well represented in the top quartile mix. Midcaps, the S&P 500, and Small Caps are clustered on both sides of the dividing line between the top and second quartiles.
For tech-centric and Mag 7 heavy benchmarks, we see Consumer Discretionary (XLY) at #1 with Tesla generating a +89% return (noted in earlier table) and +22% on Amazon. The top tier also includes the Communications Services ETF (XLC) at #3, the NASDAQ at #5 and the Tech ETF (XLK) at #7. Regional Banks (KRE) at #2 and Financials (XLF) at #6 were part of the Trump trade (regulation retrenchment) and easing bullishness. Big banks also had a good earnings season. The Transports ETF (XTN) boasted impressive airline returns.

The YTD numbers have been easy to recap lately with a 31-1 score and only the long duration UST ETF (TLT) in the red. It took 25% to make the top quartile. The big winners YTD are heavier on the tech-centric side of ETFs and benchmarks wagged by the Mag 7 (NASDAQ, S&P 500).
The top quartile has 4 with a tech flavor, 2 financials, Utilities (XLU), and 1 income heavy energy name in the Midstream ETF (AMLP) at #8. The XLU performance could even be seen as related to the tech boom with so much power demand being generated from tech plays such as AI or with Trump throwing full support behind crypto (including government crypto stockpile ambitions).
Communications Services is in the lead at #1 with +40% while Consumer Discretionary (XLY) is at #4 with +32.5%. The broad Financials ETF (XLF) is #3 and Regional Banks (KRE) at #6 for reasons we have been tracking in recent months.
A good earnings season for banks and the “Trump factor” of much less regulation plus FOMC easing all brought tailwinds to financials. The recent rumors around the FDIC could raise some questions around the politicization of depositor protection if decisions are rolled up into the US Treasury Department. The punchline might be “move deposits to Florida banks.” The March 2023 actions of the Fed headed off a potential bank system panic. That could have ended very badly if not for the smart moves by Powell.
Powell and Mnuchin tag teamed to head off a credit market and funding crisis during COVID. Mnuchin did not get the credit he deserved from Democrats on that performance. Similarly, Trump should send Powell a Christmas card and not hate mail. In the case of Mnuchin and Powell, that offers a reminder of why experience and competence matter.
For the lower end of the return rankings, YTD returns show bond ETFs comprising 5 of the 8 in the bottom quartile joined by the E&P ETF (XOP), Health Care (XLV), and Materials ETF (XLB).
On a side note, XLB is dominated by chemicals in the top ranks but also includes metals (base metals and precious) and some niche players such as aggregates (Vulcan, Martin Marietta). In terms of two that have struggled, the E&P ETF (XOP) could remain volatile if “drill, drill, drill” does in fact spike supply and send oil prices lower. The pharma heavy Health Care ETF (XLV) could possibly face the inherent risks of the RFK Jr factor as well as potential repeal of the ACA. XLV also includes some bellwether names such as United Health and suppliers.

The LTM period still includes some stub weeks from the major Nov-Dec 2003 rally. We see the same 31-1 score as the YTD. For the LTM period, we see bond ETFs comprising the bottom 5 ETFs. The HY ETF (HYG) and EM Sovereign bond ETF (EMB) put up decent LTM numbers across the line in the bottom of the third quartile with HYG at +9.3% and EMB at +8.5%. Those are solid returns for a bond ETF and especially considering 2024 UST deltas. We will be updating the UST trends in the Footnotes publication on State of Yields to be posted later today.
See also:
Mini Market Lookback: Macro Grab Bag 12-14-24
Toll Brothers: Rich Get Richer 12-12-24
CPI Nov 2024: Steady, Not Helpful 12-11-24
Footnotes & Flashbacks: Credit Markets 12-9-24
Footnotes & Flashbacks: State of Yields 12-8-24
Footnotes & Flashbacks: Asset Returns 12-8-24
Mini Market Lookback: Decoupling at Bat, Entropy on Deck? 12-7-24
Credit Crib Note: Herc Rentals (HRI) 12-6-24
Payroll Nov 2024: So Much for the Depression 12-6-24
Trade: Oct 2024 Flows, Tariff Countdown 12-5-24
JOLTS Oct 2024: Strong Starting Point for New Team in Job Openings 12-3-24
Footnotes & Flashbacks: Credit Markets 12-2-24
Footnotes & Flashbacks: State of Yields 12-1-24
Footnotes & Flashbacks: Asset Returns 12-1-24
Mini Market Lookback: Tariff Wishbones, Policy Turduckens 11-30-24
PCE Inflation Oct 2024: Personal Income & Outlays 11-27-24
3Q24 GDP Second Estimate: PCE Trim, GPDI Bump 11-27-24
New Home Sales Oct 2024: Weather Fates, Whither Rates 11-26-24
Mexico: Tariffs as the Economic Alamo 11-26-24
Tariff: Target Updates – Canada 11-26-24
Mini Market Lookback: Market Delinks from Appointment Chaos… For Now 11-23-24
Credit Crib Note: Ashtead Group 11-21-24
Existing Home Sales Oct 2024: Limited Broker Relief 11-21-24
Housing Starts Oct 2024: Economics Rule 11-19-24
Mini Market Lookback: Reality Checks 11-16-24
Industrial Production: Capacity Utilization Circling Lower 11-15-24
Retail Sales Oct 2024: Durable Consumers 11-15-24
Credit Crib Note: United Rentals (URI) 11-14-24
CPI Oct 2024: Calm Before the Confusion 11-13-24
Mini Market Lookback: Extrapolation Time? 11-9-24
The Inflation Explanation: The Easiest Answer 11-8-24
Fixed Investment in 3Q24: Into the Weeds 11-7-24
Morning After Lightning Round 11-6-24