
Footnotes & Flashbacks: State of Yields 12-15-24
We frame one more bad week for duration as another UST bear steepener sinks bond ETF returns.


Christmas time brings out the best in the worst… maybe…
The UST shapeshifting and rate moves continue to make life a challenge for bond bulls with another smackdown this week of long duration bonds.
The CPI release and warmer PPI did not lend support to the UST stabilization story line and this week’s calendar is packed with (in chronological order) Retail Sales, Industrial Production, the FOMC meeting/dot plot, Home starts, Existing Home sales, the final 3Q24 GDP reading, and Friday’s PCE report.
We look at the 3M to 10Y UST slope in historical context, and history is not very supportive of a 10Y UST rally.

The above chart updates the historical UST yield curve from the Carter inversion of 1978 across the 1980 inflation spike, the 1989 credit cycle peak before the bridge loan implode-a-thon, the 2000 period just as TMT was about to spiral down, and the 2006 peak calendar year for the credit cycle before the bubble popped on the way to the late 2007 recession start. We chose these dates as pivotal cyclical transition periods. What followed those periods was no picnic.
The pre-2008 cycles are more relevant to today’s markets than the ZIRP and QE distorted markets after the crisis of 2008 unfolded. The current UST curve vs. those earlier periods offer a stark reminder of how extraordinarily low UST rates are today. Those promising materially lower long-dated rates have history working against them. The Fed can ease on the front end, but the market decides the long.
As we highlight in our weekly UST slope updates, the natural state of affairs is upward sloping. This week we look at 3M UST to 10Y UST, where the median slope across the cycle is +159 bps. With the current 3M UST at over 4.3%, even if we shave off 100 bps from the 3M, the 10Y with a median slope still ends up closer to 5% than 4%. In the case of 2Y to 10Y, the median slope is +93 bps. You can play “fun with numbers” for 2Y to 10Y, and it is hard to get the 10Y down much from that vantage point also.
Obviously, it is not that simple (if only), but it does signal a challenge. The headwinds of record UST issuance is one factor, but the market faces more than a few inflationary influences (as much as they might be debated) such as tariffs, deportation labor pressures, or unit cost pressure on supplier chains that might need to get passed through to consumers. The costs could be tied to any expense variable (materials, wages, power, etc.), so the UST curve battle will not lack excitement.

The above chart updates the UST deltas from the peak date of the 10Y UST (10-19-23) and from 12-31-23 for a YTD delta. The shapeshifting YTD is flatter from the front end of the curve with the easing (about to get flatter this coming week with another -25 bps) but steeper and higher beyond the 2Y UST. That was certainly not the consensus at this time last year.

The above UST curve time series takes us to the Friday close from the end of 2021. The migration across 2022 was fast and pronounced while the downshift during the March 2023 period reflects the regional bank crisis effect. The downshift is one way to get rates lower (have a crisis). Powell navigated that mini-crisis very successfully and got the Biden administration out of a jam (likely not pleasing Trump) just as Powell and Mnuchin got Trump out of a predicament in March 2020 (for which Trump showed little gratitude).
The convergence of the 10Y UST levels of 12-31-22 and 12-31-23 despite 100 bps of fed funds difference offers a data point that challenges the idea that fed funds and the 10Y should move in lockstep (that was a big theory in the summer on the way to the Sept easing).
There will be another 100 bps fed funds differential (give or take) this coming week if (when) the Fed moves on its latest -25 bps. There is no easy way to make a case for the UST curve not staying steeper unless there is fundamental change for the worse in the macro picture or a sharp decline in inflation. The inflation challenge has been rooted in Services and that is hard to see changing near term.
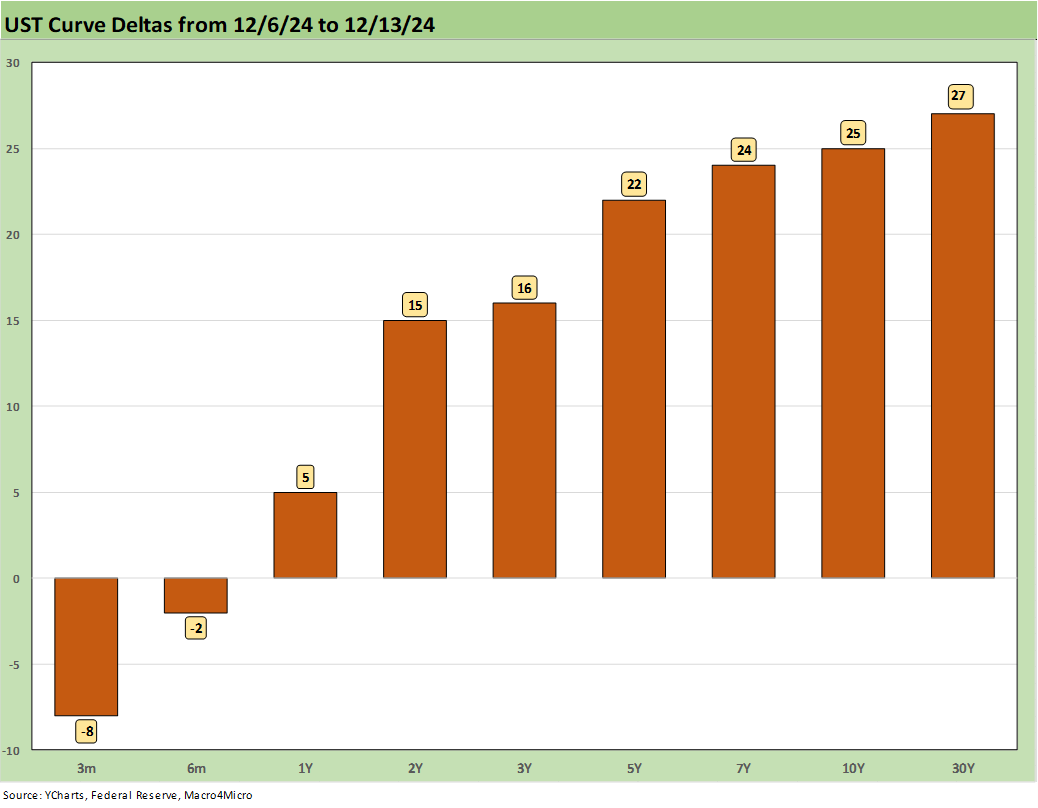
The above chart offers an easy visual on the 1-week UST delta. We see another bear steepener beyond 1Y and another bad week for bond returns and duration.

The YTD UST deltas show the split decision on rates with the short end lower and steeper and beyond 2Y UST higher and steeper.

The running deltas from the 10-19-23 UST peak are updated above. The bullish performance of the UST curve was front-loaded with the monster rally of Nov-Dec 2023 (see Footnotes & Flashbacks: State of Yields 1-1-24).

The above chart updates the Freddie Mac 30Y mortgage benchmark (released on Thursday at noon). As we covered in the Mini Lookback commentary, mortgage rates kept getting hit through Friday close. While it has a different mix, the Mortgage News Daily survey was above 6.9% by Friday.
The above chart includes historical comps for both Freddie Mac (horizontal lines) and the related UST curve for those dates including for the peak homebuilding year (2005) and for mid-2006 when RMBS quality was coming under scrutiny and the credit cycle was nearing a peak and fears of a subprime bubble were rising in some quarters.
The most interesting aspect of this chart is that the current UST curve remains quite low relative to all-in mortgage rate comps for the various dates. The 10Y UST for Dec 2005 and Dec 2024 is close, but mortgage rates remain stubbornly higher for 2024 vs. 2005. The mid-2006 period shows the UST curve materially higher but only slightly higher for the Thursday Freddie benchmark level. As we into the new week, the mortgage rate would presumably be biased higher while awaiting the PCE and economic news of the week. Retail sales usually carries some weight as well early in the week.

The above UST slope for 3M to 10Y covers the period from 1984 through Friday close. The current +6 bps vs. a long-term median of +159 bps underscores how anomalous the current curve is right now and especially during an ongoing expansion with steady growth and inflation now well below median. We also include the other UST curve segments we like to track, and the adjustment period is aiming the UST slope toward flat on the front end and upward sloping on the longer.

The shorter historical timeline for the 3M to 10Y above highlights the rapid climb from ZIRP to the peak steepness of +227 bps (May 2022). We next see a peak inversion of -189 bps in May and June of 2023. The current +6 bps slope is a long way from the +159 bps median.

We wrap with the running UST deltas from March 1, 2022 date just before the end of ZIRP (effective March 17, 2022) through this past Friday. We also include the 12-31-20 UST curve and 10-19-23 UST curve (peak date on the 10Y UST). The bear UST inversion from the short end is slowly working its way back toward something that is in the direction of offering a positive term premium. Given the struggle on the long end, many investors have not felt the need to rush.
See also:
Footnotes & Flashbacks: Asset Returns 12-15-24
Mini Market Lookback: Macro Grab Bag 12-14-24
Toll Brothers: Rich Get Richer 12-12-24
CPI Nov 2024: Steady, Not Helpful 12-11-24
Mini Market Lookback: Decoupling at Bat, Entropy on Deck? 12-7-24
Credit Crib Note: Herc Rentals (HRI) 12-6-24
Payroll Nov 2024: So Much for the Depression 12-6-24
Trade: Oct 2024 Flows, Tariff Countdown 12-5-24
JOLTS Oct 2024: Strong Starting Point for New Team in Job Openings 12-3-24
Mini Market Lookback: Tariff Wishbones, Policy Turduckens 11-30-24
PCE Inflation Oct 2024: Personal Income & Outlays 11-27-24
3Q24 GDP Second Estimate: PCE Trim, GPDI Bump 11-27-24
New Home Sales Oct 2024: Weather Fates, Whither Rates 11-26-24
Mexico: Tariffs as the Economic Alamo 11-26-24
Tariff: Target Updates – Canada 11-26-24
Mini Market Lookback: Market Delinks from Appointment Chaos… For Now 11-23-24
Credit Crib Note: Ashtead Group 11-21-24
Existing Home Sales Oct 2024: Limited Broker Relief 11-21-24
Housing Starts Oct 2024: Economics Rule 11-19-24
Mini Market Lookback: Reality Checks 11-16-24
Industrial Production: Capacity Utilization Circling Lower 11-15-24
Retail Sales Oct 2024: Durable Consumers 11-15-24
Credit Crib Note: United Rentals (URI) 11-14-24
Mini Market Lookback: Extrapolation Time? 11-9-24
The Inflation Explanation: The Easiest Answer 11-8-24
Fixed Investment in 3Q24: Into the Weeds 11-7-24
Morning After Lightning Round 11-6-24