
Existing Home Sales Oct 2024: Limited Broker Relief
The first YoY sales increase since July 2021 comes with a steady streak of higher prices and rising inventory after some brief mortgage rate support.


Realtor relief…or maybe just some lower mortgage rates?
A window of mortgage relief in late Sept/early Oct and the recurring uncertainty on whether mortgage rate relief would get better brought more sellers and buyers off the sidelines in Oct existing home sales even as inventory rose again along with median prices.
Every region saw higher volumes YoY as the first increase since July 2021 saw all region participate.
With 1.37 million units for sale, that inventory position brings the anomalous trend of “inventory up, prices up” as mortgage rates this past week were back closer to 7%.
In a sign of the times on selling prices and mortgage-impaired affordability, the rate of % growth was positive for 4 of the 6 price tiers with the two lowest price tiers negative. The higher % increases were seen in the 4 highest price tiers with the largest tier ($250K to $500K) up by 8.6% and the 1+ million bracket up by +23.

The above chart is a variation of the price tier volume mix that we address in the final chart. The above shows the rich not only get richer but they also can pull the trigger quickly when rates are friendlier. We see 4 of the 6 tiers posting positive YoY % changes in volumes with the higher % growth in the pricier brackets. The % volume changes move lower in descending order of price tier for the 4 in positive range and 2 in negative range as seen on the right side of the chart.
We heard a fair amount early in the Presidential campaign about homebuilder affordability (see Harris Housing Plan: The South’s Gonna Do It Again!? 8-28-24). The ability of policy - as opposed to mortgage rates tied to UST trends – to bring relief might end up as more hope than reality for a sustained rebound in existing home sales. It will still revolve around rates, expectations, and basic monthly payment math. We had a sharp decline and then notable rise in mortgage rates in Sept-Oct. As the window opened, more sellers and buyers in the existing home market grabbed opportunities in Oct.
The UST curve has been stubborn and home prices high. It takes a bigger supply of new homes to be built to sell at low prices. In existing home sales, it takes a willingness of potential sellers to cut prices or buyers to capitulate. That will come in doses but seems more of a pipe dream for a major reversal. There will be buyers unwilling to wait out the mortgage challenge with a need to buy with a down payment in hand and a price and mortgage payment they can afford. If they can meet the income test for the mortgage, they will still surface as this month’s numbers show. The test will be in the spring selling season as tariffs roll in, deportations hit the headlines, and the market gets a taste of the inflation and interest rate backdrop.
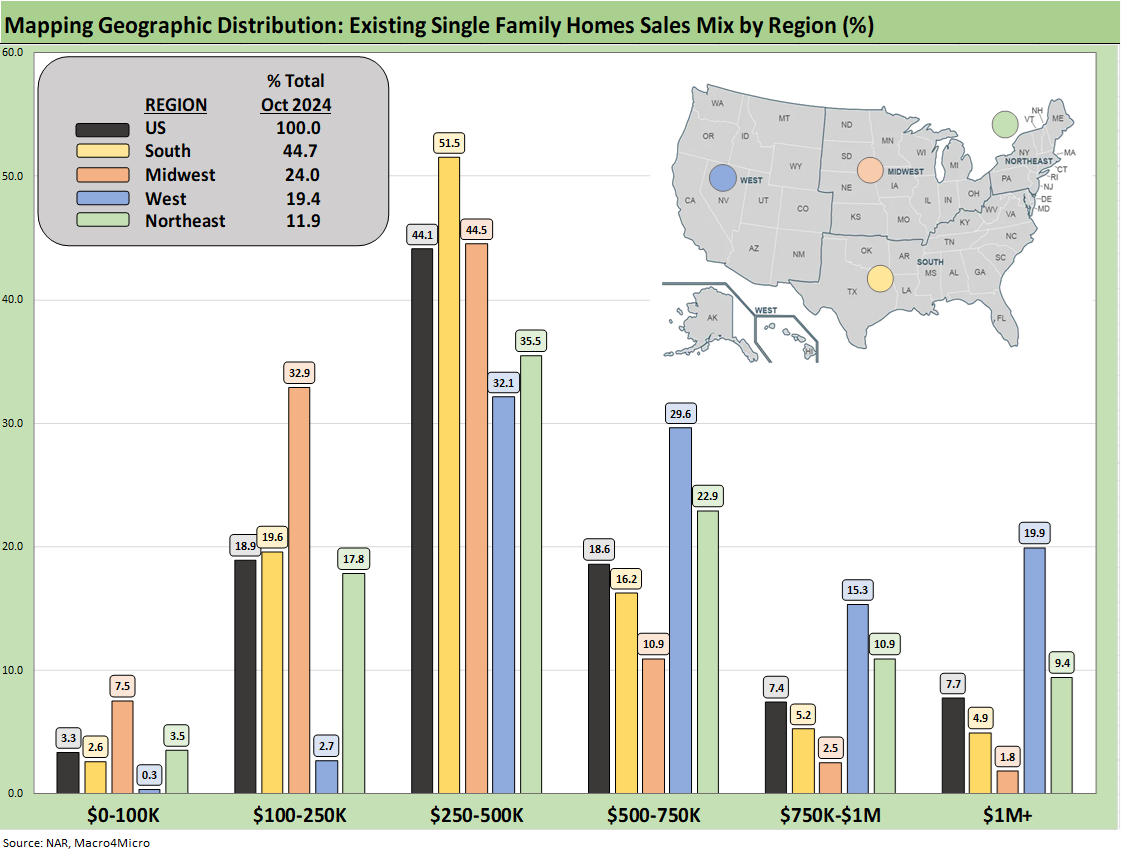
The above chart shows the geographic mix of volumes and details on price mix by region. The South is the main event in single family volumes whether new or used at almost 45% of volumes for existing. For the bar chart, we break out the mix for each region by price tier. For example, the South shows 51.5% of its existing home sales volume in the $250k to $500K bracket and 16.2% of its sales in the $500 to $750K bucket. The bars for each region add up to 100% (occasionally a rounding miss!). The high cost of homes in the West (notably California) is clear enough in the West price mix just by glancing at the bar chart % details.
We see a big concentration in the $250K to $500K bracket for all regions and a heavy weighting in the $100K to $250K bracket for the Midwest. The map explains what states are in each Census region, and there is a wide range of home price profiles in the West and Midwest.
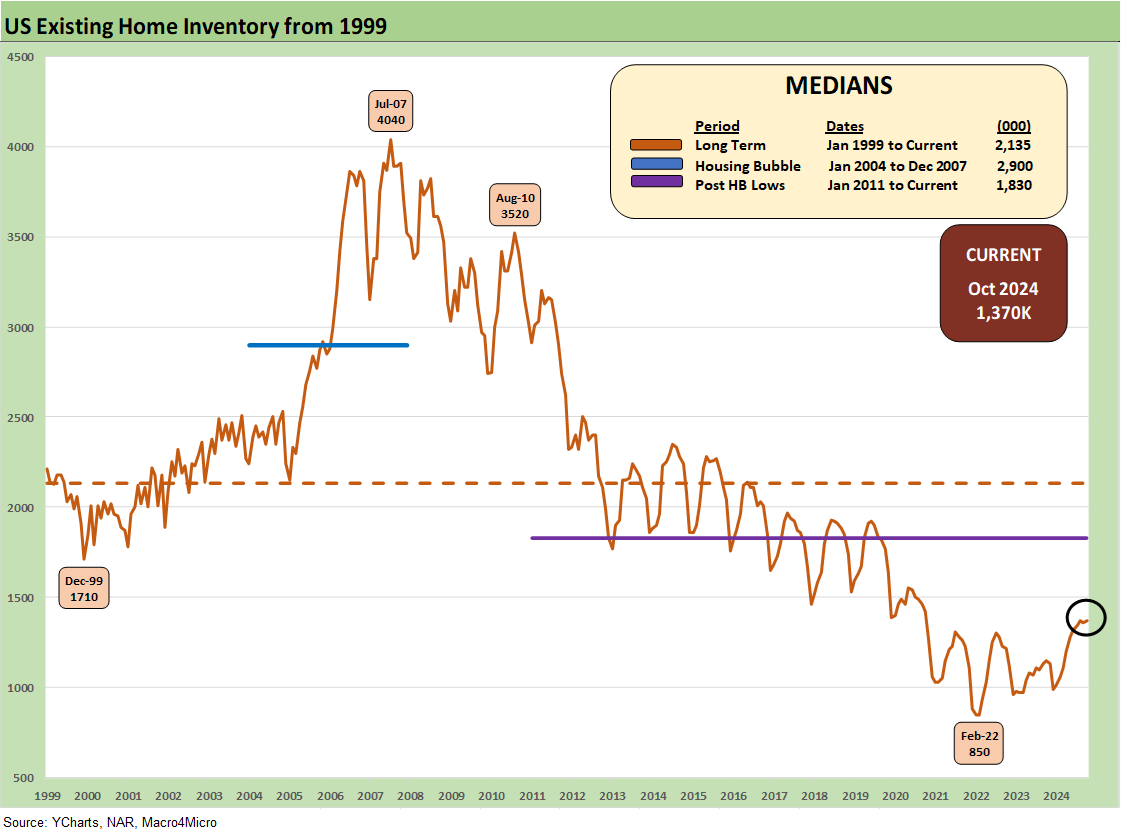
The existing home inventory trend is bouncing off the lows and kept on rising to 1.37 million this month from the 850K just before the tightening cycle kicked into gear in March 2022. The 1.37 million inventory is up by +19.1% YoY and by +0.7% sequentially.

The above two-sided chart updates the trend line in total existing home sales vs. new single family homes. We look at this trend each month in the New Home Sales release when the two are on the same month (the above chart is Sept for new and Oct for existing). New home sales for Oct will be released next Tuesday.
The main point is that builders have an advantage in being able to use their mortgage finance operations as incentives (mortgage buydowns and fee relief, etc.) to close more sales. The builders have thus picked up market share of total home sales. Existing home sales volumes always dominate the total, but at the margin builders have been winning since they can design, price, and deliver the homes at a healthy profit margin and on terms the buyer can handle. The existing home seller does not have that luxury.
This topic has been covered across this cycle in our other housing sector and single name work. It is worth repeating since builders have held up very well in the high rate market as we cover in our weekly asset return commentaries (see Footnotes & Flashbacks: Asset Returns 11-17-24).

The above chart breaks out the timeline for single family alone of 3.58 million vs. total existing home sales of 3.96 million, which is well below the long-term median (from Jan 1999) of 5.25 million for total existing homes. The lower line is ex-condo/ex-co-ops. We saw 380K in condos and co-ops in Oct 2024, up from 370K in Sept and down from 390K in Aug.

The above chart updates the median price for existing single family homes at $412.2K. Though down from the June 2024 high of $432.9K, the median price remains well above the $308K back in Jan 2021 when mortgage rates were near record lows.
Higher mortgage rates and near record prices were the double whammy, but mortgage rates heavily drive the monthly payment burden. Potential sellers and buyers had some recent mortgage relief in the low 6% range in late Sept and early Oct (see Footnotes & Flashbacks: State of Yields 10-6-24). The market quickly was hit by rates in the following weeks.

The above chart updates the monthly existing home sales across the timeline from Jan 2021 through Oct 2024. The market is a long way from the mid-6 and high 5 million handles of 2021 and then into early 2022 when many homeowners refinanced, and new buyers locked in low mortgages. ZIRP ended in March 2022 and then the UST migration began. The Oct 2024 total of 3.96 million is below the May 2020 COVID trough of 4.07 although we had a few more sub-4 million handles along the way as noted in the chart.

The above chart revisits the topical area addressed earlier on the existing home sales deltas by price tier. The largest tier is $250K to $500K at just under 45% of sales volumes, and that was up by +8.6%. The challenge for the lower tier buyer is evident in the decline of -1.4% in the $100K to $250K tier that comprises almost 18.9% of volume while the $500K to $750K tier at just under 18.6% of the market rose by +16.2%.
Trump has promised to do something for the lower price tiers. These numbers are released each month. We will see. None of the candidates could fight math but only one now has to deliver. The UST trend line and notably the 10Y UST will be the main event for mortgages.
See also:
Footnotes & Flashbacks: Credit Markets 11-18-24
Footnotes & Flashbacks: State of Yields 11-17-24
Footnotes & Flashbacks: Asset Returns 11-17-24
Mini Market Lookback: Reality Checks 11-16-24
Housing:
Housing Starts Oct 2024: Economics Rule 11-19-24
New Home Sales: All About the Rates 10-25-24
PulteGroup 3Q24: Pushing through Rate Challenges 10-23-24
Existing Home Sales Sept 2024: Weakening Volumes, Rate Trends Worse 10-23-24
PulteGroup 3Q24: Pushing through Rate Challenges 10-23-24
Housing Starts Sept 2024: Long Game Meets Long Rates 10-18-24
KB Home: Steady Growth, Slower Motion 9-26-24
Lennar: Bulletproof Credit Despite Margin Squeeze 9-23-24
Harris Housing Plan: The South’s Gonna Do It Again!? 8-28-24
Credit Crib Note: PulteGroup (PHM) 8-11-24
Credit Crib Note: D.R. Horton (DHI) 8-8-24
Credit Crib Note: KB Home 7-9-24
Lennar: Key Metrics Still Tell a Positive Macro Story 6-20-24
Credit Crib Note: NVR, Inc. 5-28-24