
Footnotes & Flashbacks: State of Yields 7-27-25
A mild UST week now heads into another FOMC meeting and a wave of economic releases.

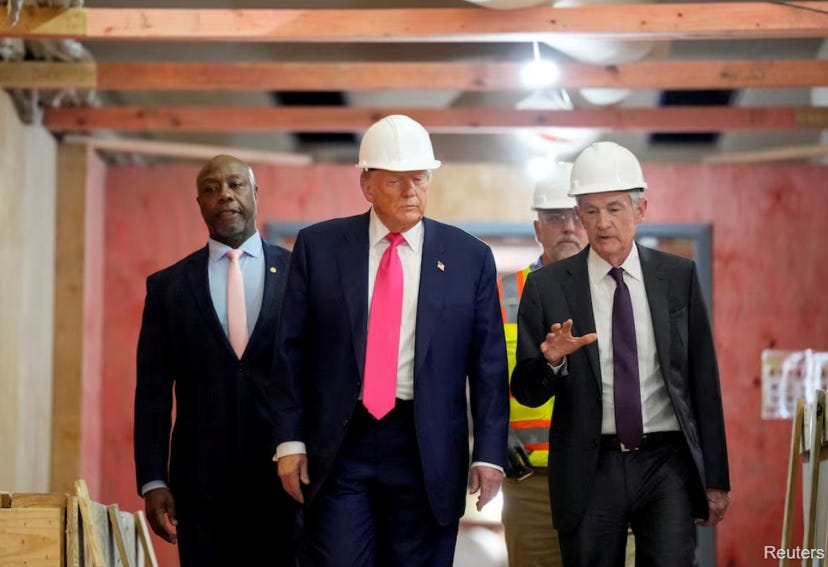
Powell joking with the boys: “A tyrant, an extremist and a sycophant walk into a bar…”
Some forward progress in avoiding trade wars still brings the process further into the next stage of tariffs as the reciprocals roll into effect with the Aug 1 key date arriving this week, the murky EU deal now in the headlines, Japan teed up (sort of), but with the two largest “trade partner nations” of Canada and Mexico still open items.
This week brings some major action in critical events and data with an FOMC meeting, PCE inflation, Income and Outlays, the first 2Q25 GDP estimate, and JOLTS and payroll. We also see a wave of earnings including 4 of the Mag 7, some bellwether autos (Ford, Stellantis, some major suppliers and dealers) that can weigh in on tariffs.
We look at the 3M to 10Y UST segment slope as the fear of steepening still lurks. The post-Sept 2024 UST shift offers a reminder that cutting fed funds is not the passport to paradise for longer rates and the housing markets.
The following updates our rolling weekly State of Yields commentary.
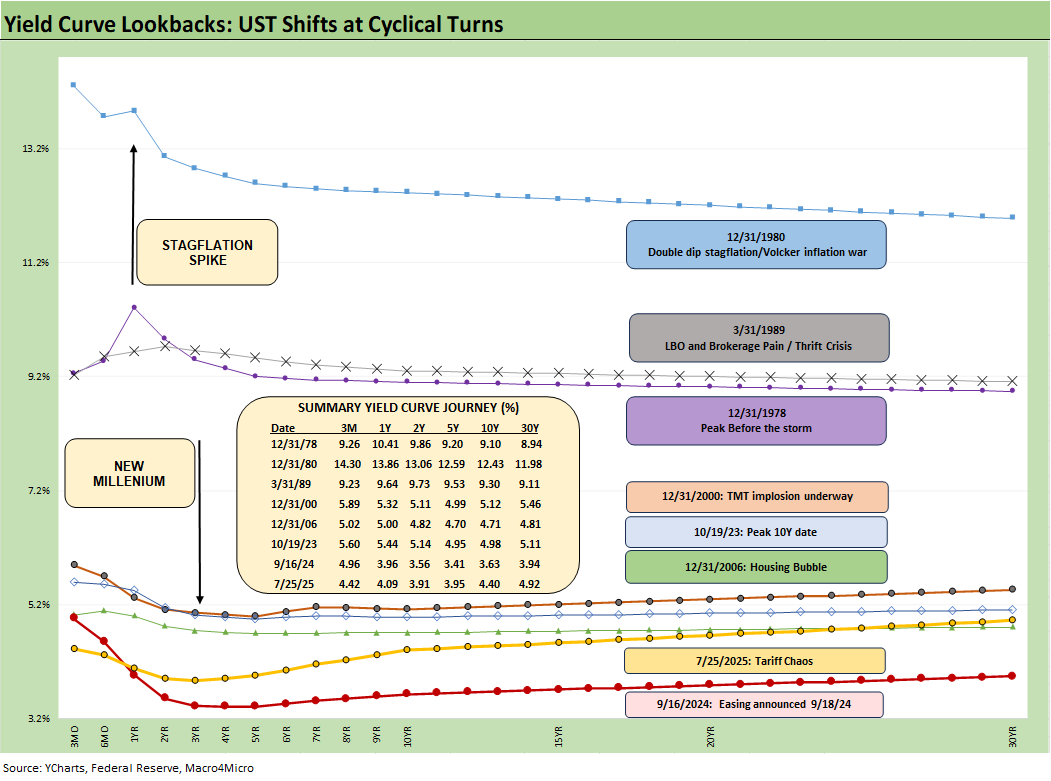
The above chart plots some key cyclical transition periods which underscore that today’s interest rate backdrop features very low rates in historical context and especially when you look outside the crisis years of ZIRP and QE. Those pre-crisis UST curves are also worth keeping in mind as recent comments from UST Secretary Bessent and Russell Vought of the OMB angle to put Project 2025 into practice in restructuring the Fed. As a reminder, Vought was the lead architect of Project 2025 and a co-author. On a side note, he was a Political Science major at a small midwestern Evangelical College, and it appears he lacks capital markets experience or economics training.
We heard echoes of the Fed overhaul ambitions from both Vought and Bessent again in recent days. We would recommend a read of Chapter 24 in the Project 2025 tome that was dedicated to the Federal Reserve. It is a topic for another day, but the desire to have White House control over the Fed and reduce its mandate to “price stability only” is a pandora’s box of topics that everyone should start watching more closely. Think back to events like the 2008 crisis, COVID, the run on the regional banks in March 2023, and the scenarios can get ugly very quickly on what a “price stability only” backdrop could mean. Add in the very “low quality” of dialogue we have been hearing in Washinton on tariffs and economic effects and there are plenty of reasons to worry.
Historical UST curves…
In the above chart, the yield curves plotted span from Carter inversion of 1978 across the Volcker years, the1980s credit cycle peak in 1989 (note the 9.2% 3M UST), the TMT cycle faltering in 2000 (on the way to a massive Greenspan easing in 2001), and the housing bubble in 2006. During the 2004 to 2007 period, leveraged derivative exposure and structured credit were out of control and counterparty risk was soaring. Worth highlighting is that the current 3M UST is notably lower than the pre-crisis, pre-ZIRP 3M UST levels from those past credit cycle peak years.
The chart then jumps from 2006 to 2023, which takes the market beyond the crisis period and the ZIRP years and COVID. Both the post-credit crisis period and COVID prompted the Fed to deliver a wave of market liquidity support and confidence building programs that helped save the capital markets and supported the banks. That period brought plenty of QE and normalization distortions to the yield curve shape.
The market saw a massive move lower and bull flattener to end 2023 after the 10Y UST peaked in Oct 2023 as we review below. Steeper and higher was not the forecast to start 2024 as the market expected flatter and lower. During 2024, the curve moved in an adverse direction with a bear steepener until a major UST rally alongside the Sept 2024 easing. That soon brought us a fresh steepening with some rallies and sell-offs along the way.
The tariff drama and uncertainty continue from here…
The current market is facing a balancing act with tariffs finally rolling into the working capital cycles and thus raising inflation risk. On top of those tariffs already in place, the market now faces waves of newly set tariffs with the “reciprocal tariff pause” coming to an end and tariffs essentially being assigned with the Aug 1 target date. EU headlines on Sunday and recent Japan headlines checked off a few major items that still leave little transparency, but the main item was 15% tariffs as the new focal point (with some variations for Section 232).
The dilemma between inflation and stagnation raises the ultimate specter – stagflation. We have not seen a bout of stagflation since the 1980-1982 double dip, so it will be a new variable for many in the markets in a much more globalized economy.
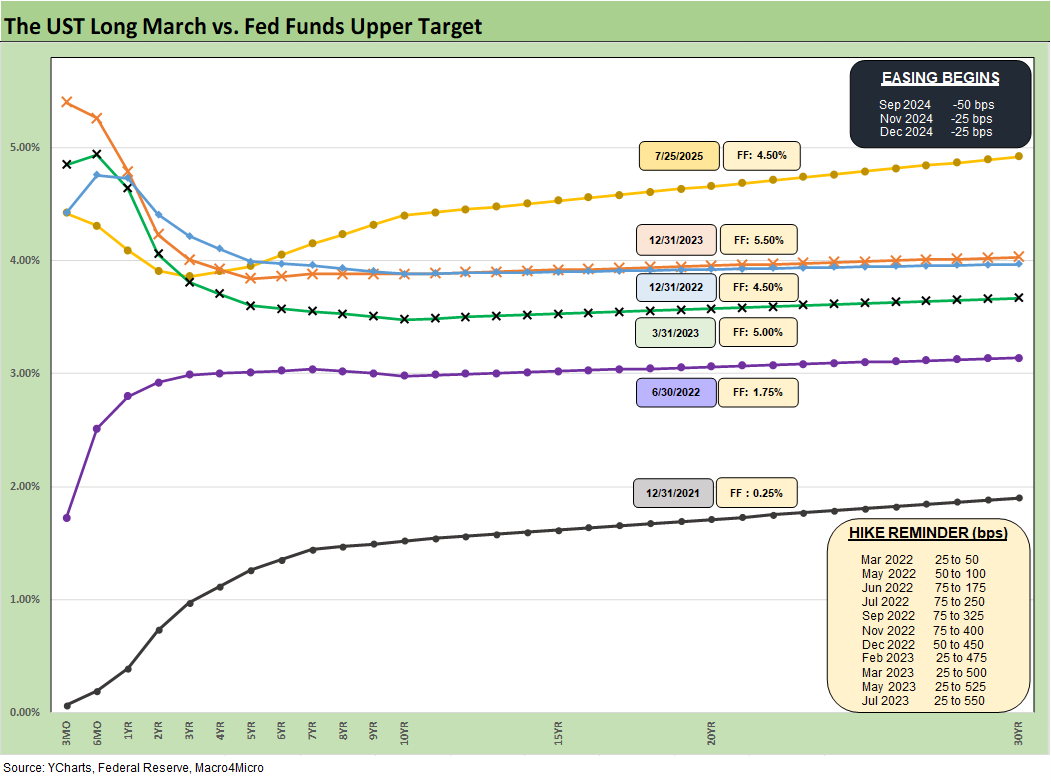
The above replays our weekly chart detailing the migration of the UST curve from 12-31-21 with a memory box detailing the tightening dates and magnitude and more recently the easing. The UST curve seems to intermittently mix bear steepening patterns and flattening rallies since the Sept 2024 lows, but market fear was creeping into the shapeshifting after Liberation Day before calming down with the pause.
Recent days brought the end of the pause and more unilateral assignments of tariffs by Trump with a few variations negotiated along the way such as Vietnam among a few others (see US-Vietnam Trade: History has its Moments 7-5-25).
A Japan “deal” was a breakthrough on avoiding bigger trade battles, and the EU now appears to have backed down (however they spin it) as of Sunday. It appears the EU leaned on Japan’s 15% deal as a focal point. That leaves Canada and Mexico as the biggest potential breakdown risks ahead.
FOMC and PCE inflation on deck, Aug 1 tariff date, and 2Q25 GDP numbers…
The market will face the FOMC this week with the September FOMC meeting now showing 60% chance of a -25 bps cut and 38% odds of unchanged. This coming week’s FOMC decision is showing odds of 97% for unchanged.
The tension between the White House and Powell flared up again this week when Trump brought some “backup” to the Fed tour, which was more a media stunt and political posturing than anything of substance. It ended up as a clown show. Tim Scott’s “eloquence” on the need for lower rates on the tour did not move the needle or say much of anything. Neither did Russell Vought, the Evangelical Nationalist head of the OMB with zero experience in capital markets.
Vought was highly visible on CNBC the next day stating very little of substance but slamming the Fed. Trump did not exactly bring his A Team on markets to the fed tour with Vought his attack dog and Tim Scott attending for no apparent reason and offering little value. Trump dramatically misquoted the cost overrun on live TV, and Trump was corrected live and real time by Powell. That should do wonders for the relationship.
The last FOMC meeting in June saw another round of no action by the Fed with an increase in the number of votes for “no change in 2025” rising to 7 from 4 in the “Gang of 19” dot plot (see FOMC Day: PCE Outlook Negative, GDP Expectations Grim 6-18-25). The consumer metrics of late (notably May income and outlays) turned soft, so June data delivered in July (this week )and July data delivered in Aug will be critical inputs for the market as well as the FOMC before the September meeting. The reality is those FOMC decisions are made by a committee. Similarly, the very weak GDP forecasts and rising PCE inflation forecast medians are generated by 19 economists in the June SEP report and the same for the dot plot.
We also get the first estimate of 2Q25 GDP this week. The very poor US GDP forecasts seen in the Fed projections are mirrored by the OECD, the World Bank and numerous major top banks. That could soon help the case for easing, but Trump’s tariffs are in the way for now.
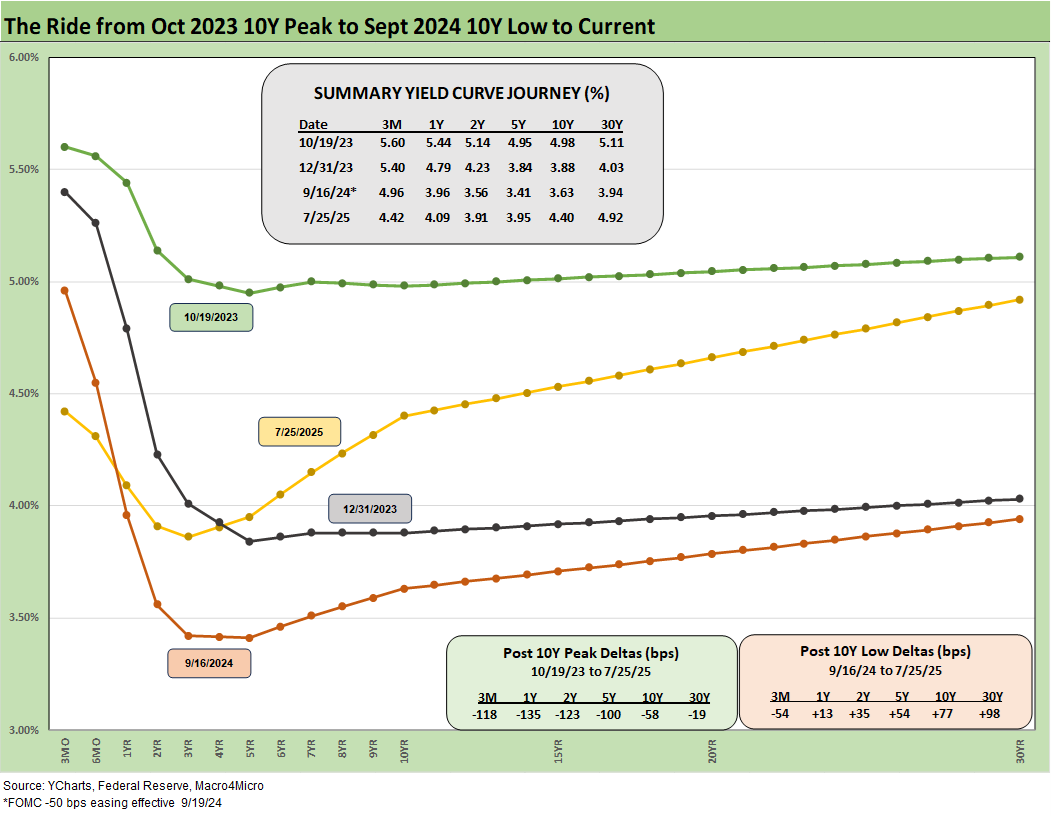
The above chart details the material move from the peak UST curve of 10-19-23 down into the UST bull rally of Nov-Dec 2023 and then eventually into the lows of Sept 2024. The Sept 2024 low tick only came after a bear steepener hit the curve through the summer of 2024. We then moved back into the bear steepener mode until the tariffs roiled the UST markets and initially sent 2Y to 30Y lower on cyclical fears.
The shift higher from the Sept 2024 lows and the steepening from the low point at the end of 2023 is reflected in the chart. We see the 10Y and 30Y notably higher than Sept 2024 with a more normal upward sloping shape from 2Y out to 30Y.
The challenge is still that front end inversion from 3M to 2Y and 5Y. We look at the history of the 3M to 10Y later in this commentary. The inversion anomaly on the front end during a protracted expansion has been hard to shake with the FOMC holding the line over tariff-related inflation questions. The June CPI report includes plenty of signs across the MoM CPI trends that show numerous product group line items seeing prices pushing higher. Fact deniers (like election deniers) will just say it is fake or there is no cause-and-effect.
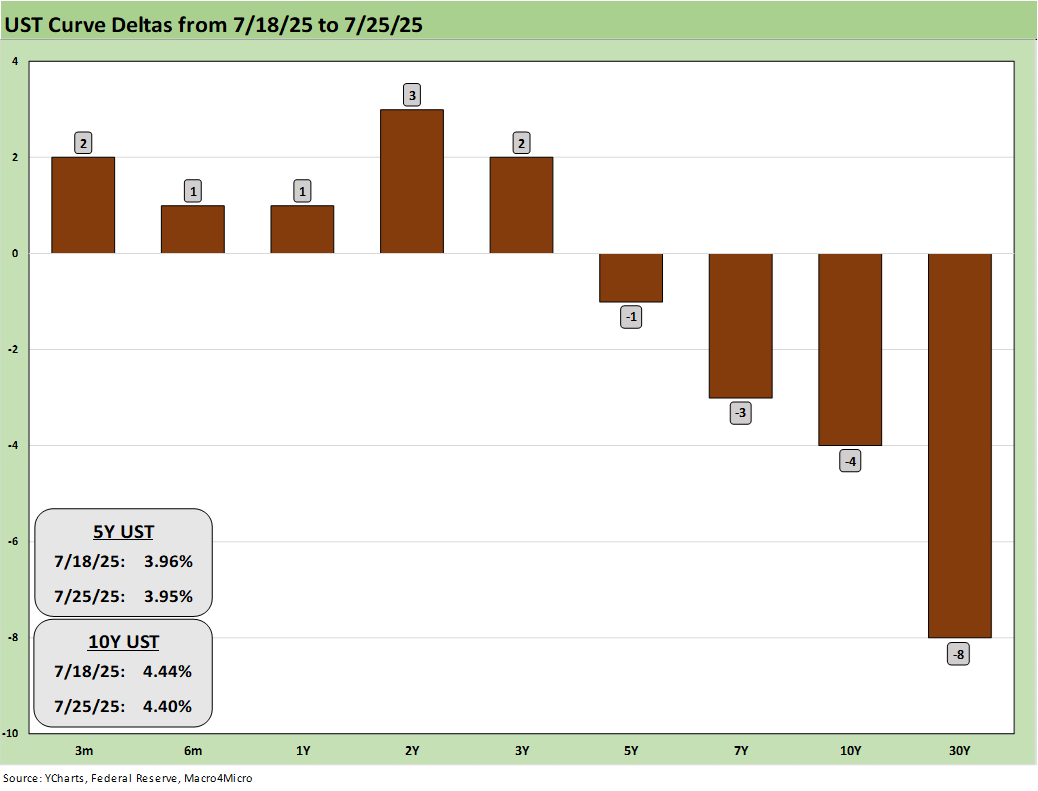
The above chart updates the 1-week UST deltas. The 5Y to 30Y move lower while the short end rose slightly. This week should bring more action along the curve.
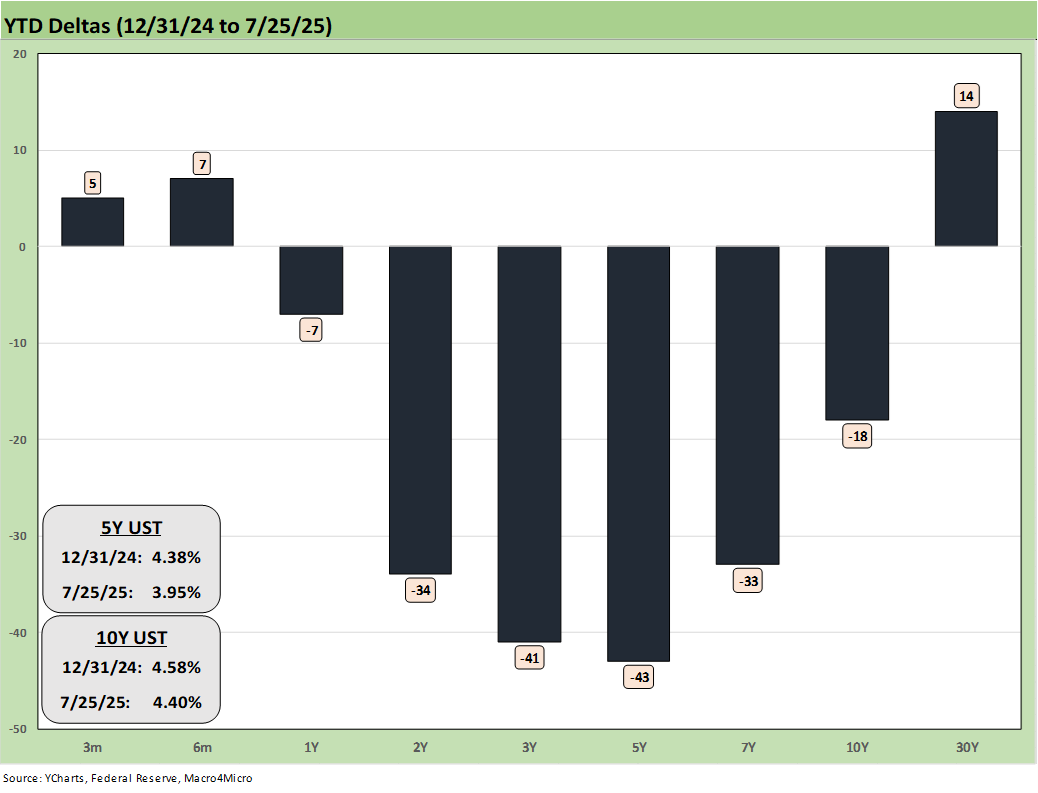
The YTD UST deltas show good news for bonds that kept all 7 bond ETFs in positive return range. The UST steepener threat is alive and well if the FOMC governance structure gets turned upside down by Trump or the Project 2025 crowd or if the tariff-related price action roils confidence in markets.
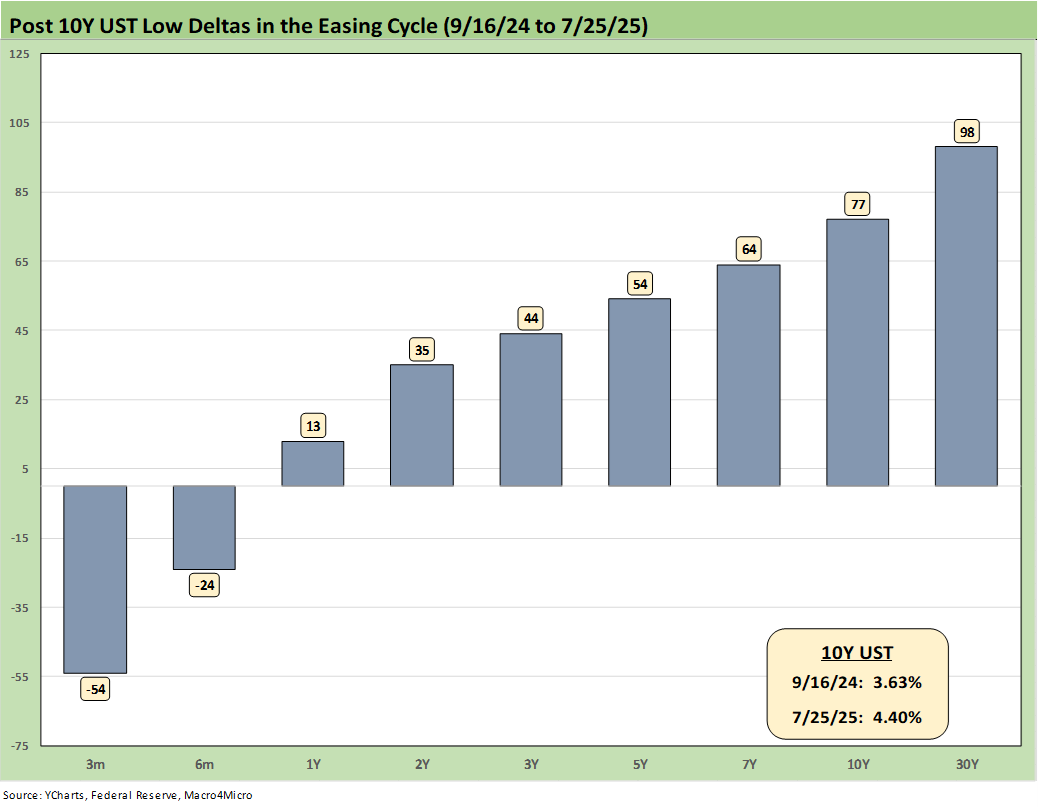
The above chart updates the UST deltas since the 9-16-24 lows that came alongside the Fed easing. That has not worked as many market watchers predicted on the shape of the UST curve and number and pace of easing that was supposed to follow.
Trump continues to rail at the Fed and Powell to lower rates, lately demanding 300 bps of easing, not long after he had demanded a 200 bps of easing, up from earlier demands of 100 bps in cuts. The move from 100 to 300 unfolded in a few weeks.
The reality is that Trump’s target fed funds rate for right now would be well below inflation. With the market running above target and tariffs rising while Trump claims his economy is the “hottest” in the world, we are not sure a de facto stimulus via negative real fed funds is a conceptually sound (or coherent) plan.
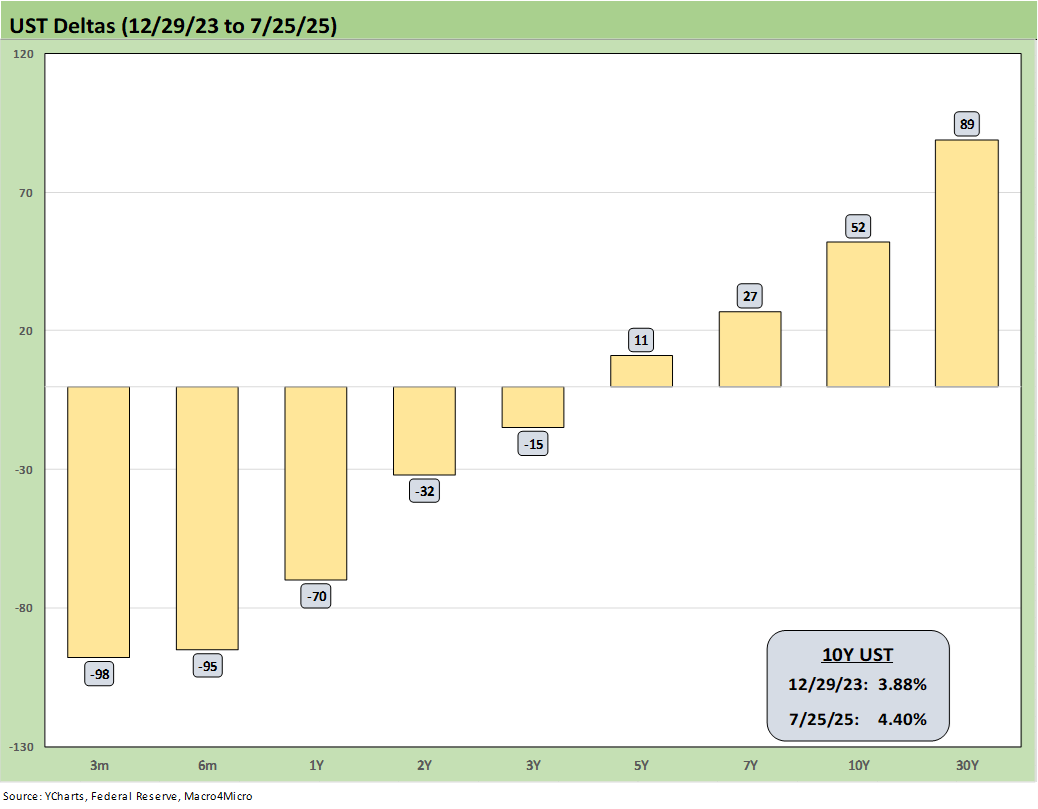
The above chart updates the UST deltas from the end of 2023 after a massive rally in rates and risk in Nov-Dec 2023. The follow-on in 2024 expected by the consensus mildly disappointed the UST bulls in the number of FOMC cuts. The market got 4 x 25 (a double in Sept) but not the number of 5 to 6 FOMC 25 bps cuts expected). The expectation of a pronounced bull flattening during 2024 also did not play out as anticipated when a bear steepener prevailed by the end of the year. As detailed in the earlier chart, the 2025 period has fared better for bonds on a modest bull steepener.
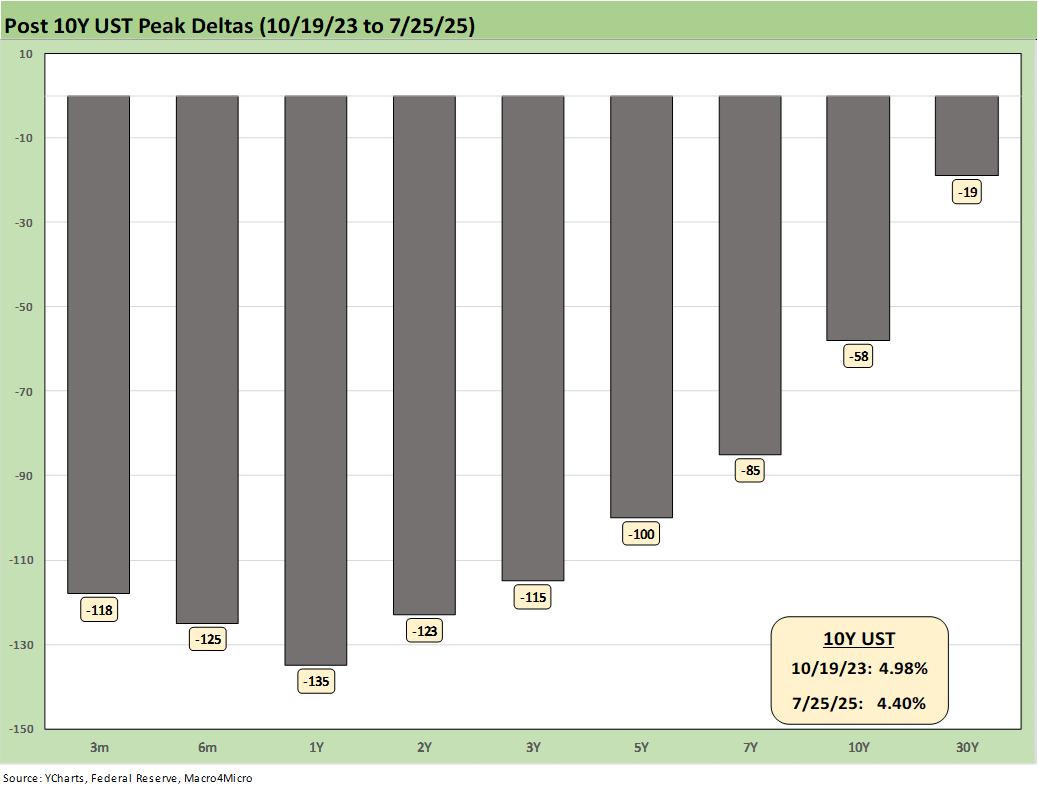
The above chart updates the running UST deltas from the 10-19-23 peak date of the UST 10Y when it barely missed the 5.0% line. For those looking for a frame of reference on what a bad move in inflation might mean, these deltas at least offer a recent set of data points during an inflation fighting year such as late 2023 and into 2024 (until Sept 2024 began the easing process). That is why we keep revisiting that timeline. It reminds us what reversion could mean.
These rally deltas could revert in part or in whole with the wrong inflation outcomes. We don’t need to see 2022 again, but the old saying “It happened before, it can happen again” resonates for many.
Losing a rally of -58 bps in the 10Y UST above would hurt the mortgage market and lead to a material valuation headache in equities, M&A economics, and capital project planning. Mortgages have been a drag on housing (new and existing home sales). The risk of inflation heading the wrong way would do more damage. Stubborn rates or higher rates in the short end to 5Y would damage consumer durables financing and related volumes.
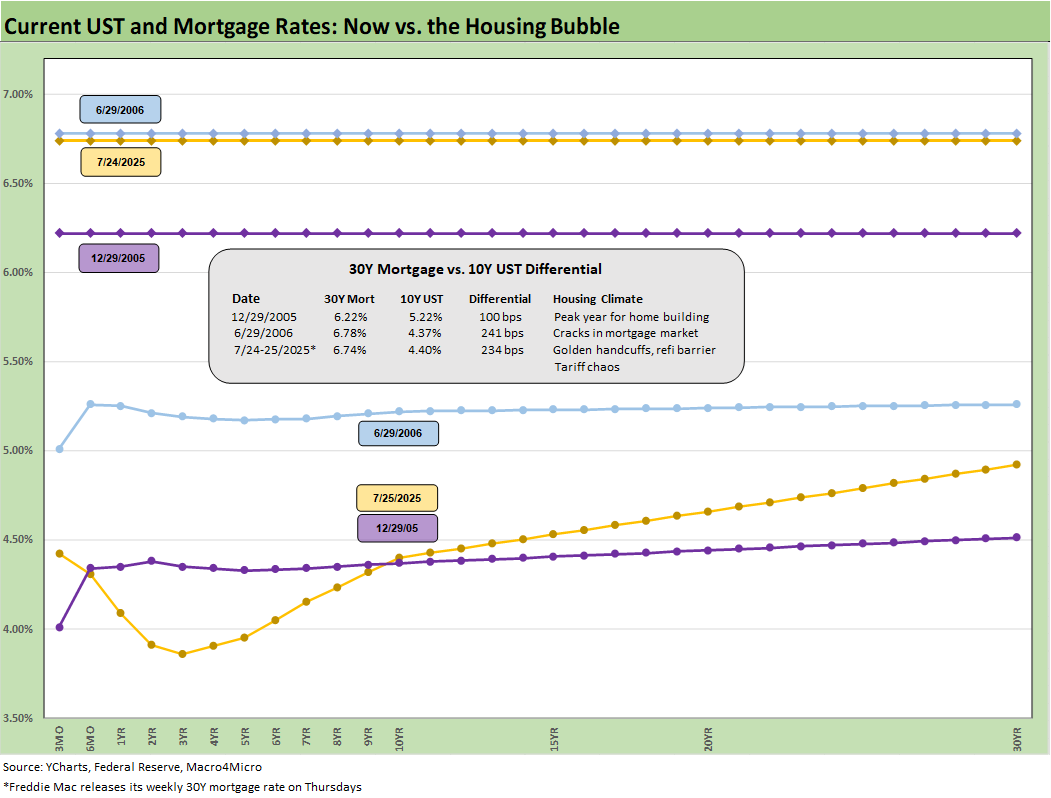
The above chart is one of those replay slides we update each week. This one posts the UST curve for this past Friday and the Freddie Mac 30Y Mortgage benchmark rate (noon Thursday release). We include two useful historical periods including the peak homebuilder year end of 2005 and mid-2006 when RMBS quality concerns were catching headlines as the housing bubble was peaking.
We post UST curves for each period in the chart. The past week saw rates barely move the past week with a slight move to 6.74% from 6.75%. We have seen minor moves recently, but that was after a 200 bps range since fall 2023.
We include a column above detailing the differential between the Freddie Mac 30Y and the 10Y UST. That differential moved to +234 bps this week from +229 bps last week. The year 2005 posted a differential of only +100 bps and makes a statement on what the mortgage market was like in 2005. The mortgage market was very hot back then in the housing bubble as mortgage volumes soared during that peak homebuilding year and a very busy period of refinancing was running alongside as a source of funds for homeowners.
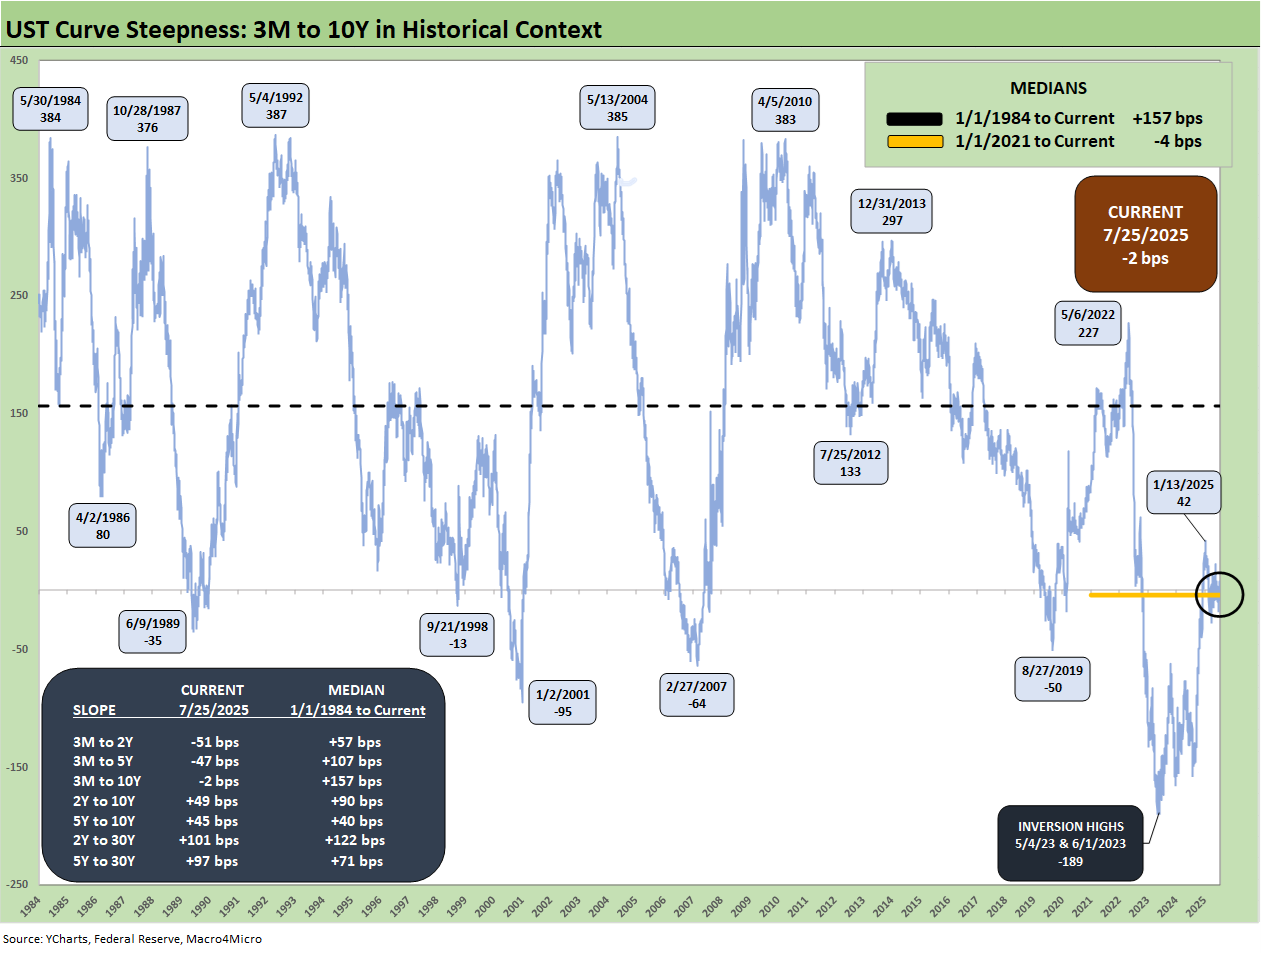
The above chart updates the 3M to 10Y slope from 1984, and we see a current slope of -2 bps with that slight inversion materially below the long-term median of +157 bps. The chart also includes a box with the UST curve segment slopes we monitor with the related long-term medians.
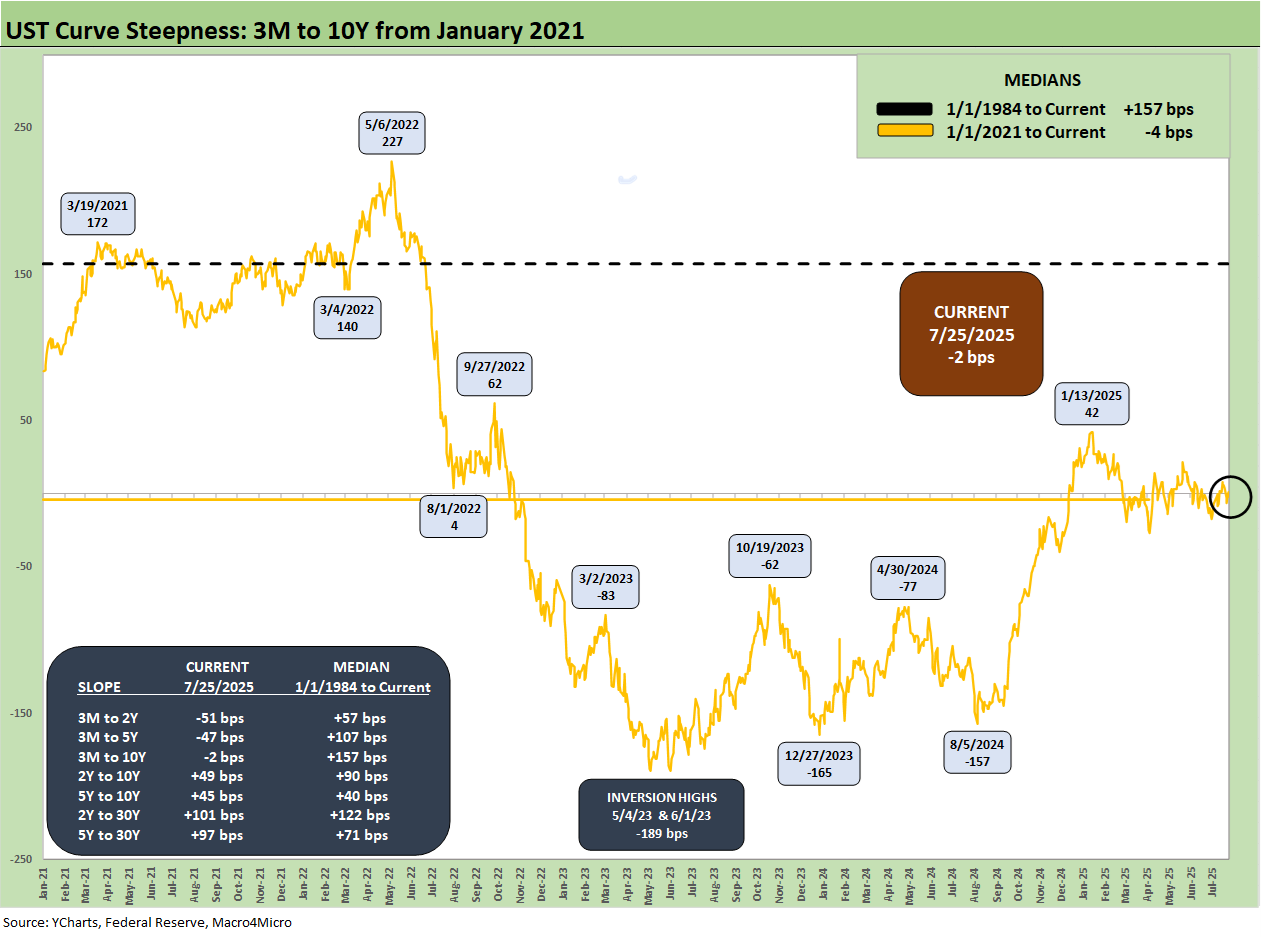
The above chart shorten up the timeline for better granularity in more recent moves from the start of 2021 when the market was in ZIRP mode. We see the steepening move to +172 bps in March 2021 and then to +227 bps in May 2022. Then came the peak inversion of -189 bps o May and June of 2023.
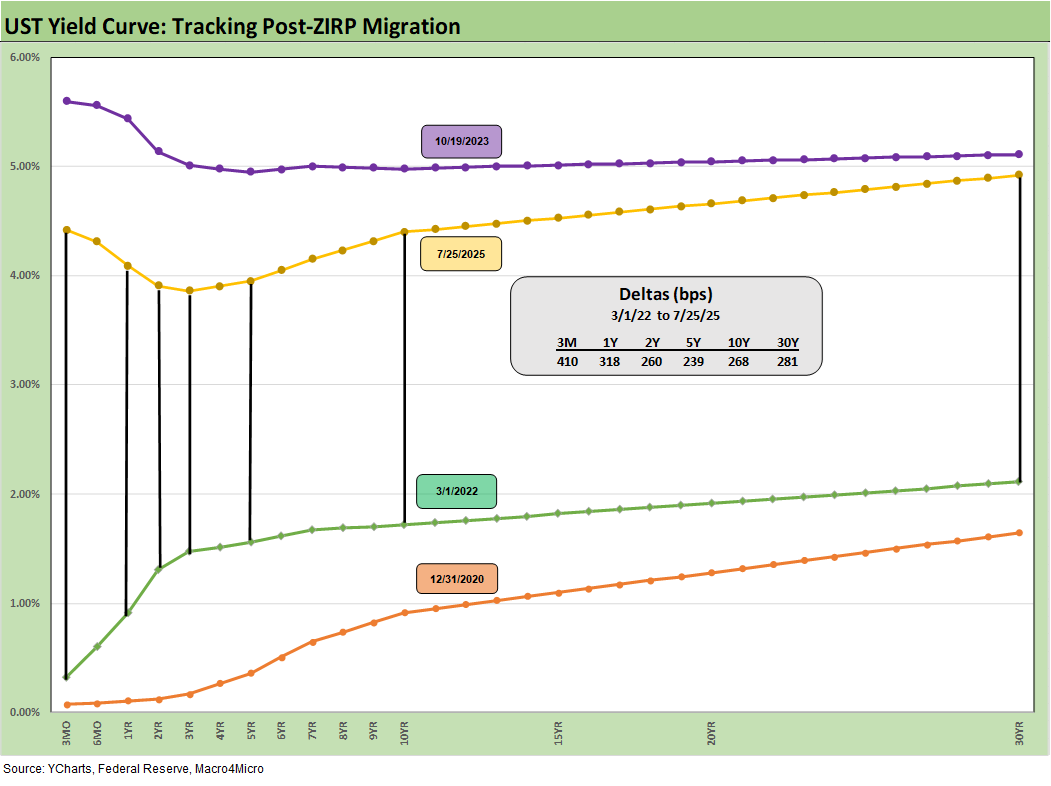
We wrap this week’s State of Yields with an update of the running UST deltas since March 1, 2022 just ahead of the end of ZIRP (effective 3-17-22). We include the 12-31-20 UST curve and 10-19-23 peak UST curve as frames of reference.
Markets:
Footnotes & Flashbacks: Asset Returns 7-27-25
Mini Market Lookback: Mixed Week Behind, Big Week Coming 7-26-25
Durable Goods Jun25: Air Pocket N+1 7-25-25
Taylor Morrison 2Q25: Resilient but Feeling the Same Macro Pressure 7-25-25
New Home Sales June 2025: Mixed Bag 7-24-25
Existing Home Sales June 2025: The Math Still Doesn’t Work 7-23-25
PulteGroup 2Q25: Still-Lofty Margins see a Mild Fade 7-23-25
D.R. Horton 3Q25: Material Slowdown Still Good Enough 7-22-25
Housing Starts June 2025: Single Family Slips, Multifamily Bounces 7-18-25
Footnotes & Flashbacks: State of Yields 7-20-25
Footnotes & Flashbacks: Asset Returns 7-20-25
Mini Market Lookback: Macro Muddle, Political Spin 7-19-25
Housing Starts June 2025: Single Family Slips, Multifamily Bounces 7-18-25
Retail Sales Jun25: Staying Afloat 7-17-25
June 2025 Industrial Production: 2Q25 Growth, June Steady 7-16-25
CPI June 2025: Slow Flowthrough but Starting 7-15-25
Footnotes & Flashbacks: Credit Markets 7-14-25
Mini Market Lookback: Tariffs Run Amok, Part Deux 7-12-25
Mini Market Lookback: Bracing for Tariff Impact 7-5-25
Payrolls June 2025: Into the Weeds 7-3-25
Employment June 2025: A State and Local World 7-3-25
Asset Return Quilts for 2H24/1H25 7-1-25
JOLTS May 2025: Job Openings vs. Filling Openings 7-1-25
Midyear Excess Returns: Too little or just not losing? 7-1-25
Recent Tariff commentary:
US-Italy Trade: Top 15 Deficit, Smaller Stakes 7-18-25
US-France Trade: Tariff Trigger Points 7-17-25
Germany: Class of its own in EU Trade 7-16-24
US-Canada Trade: 35% Tariff Warning 7-11-25
India Tariffs: Changing the Music? 7-11-25
Taiwan: Tariffs and “What is an ally?” 7-10-25
US-Trade: The 50% Solution? 7-10-25
Tariff Man Meets Lord Jim 7-8-25
South Korea Tariffs: Just Don’t Hit Back? 7-8-25
Japan: Ally Attack? Risk Free? 7-7-25
US-Vietnam Trade: History has its Moments 7-5-25
US Trade in Goods April 2025: Imports Be Damned 6-5-25
Tariffs: Testing Trade Partner Mettle 6-3-25
US-UK Trade: Small Progress, Big Extrapolation 5-8-25
Tariffs: A Painful Bessent Moment on “Buyer Pays” 5-7-25
Trade: Uphill Battle for Facts and Concepts 5-6-25
Ships, Fees, Freight & Logistics Pain: More Inflation? 4-18-25
Tariffs, Pauses, and Piling On: Helter Skelter 4-11-25
Tariffs: Some Asian Bystanders Hit in the Crossfire 4-8-25
Tariffs: Diminished Capacity…for Trade Volume that is…4-3-25