
Employment June 2025: A State and Local World
A good payroll number passed the cyclical test but flunked the “occupation mix” quiz.


A gathering of all the courageous people in Washington DC.
The 147K payroll additions came in ahead of expectations and sent the UST higher but the action was muted. The 2Y UST is over 8 bps higher and 10Y UST over 3 bps higher as we go to print. The FOMC has even less reason to ease now in July as the “tariff wait” continues. Attacks by Trump and allies escalate given the clear goal of removing Fed independence in substance (even if not by law) as Trump demands 200 bps of easing.
At sea level, the flat 4.1% unemployment rate in June (4.2% in May) from the Household Survey comes after a -222K decline in the total unemployed ranks to 7.01 million, down from the 7.24 million unemployed in May (7,015K/170,380K = 4.1%). The civilian labor force at 170.4 million declined by -130K (participation rate -0.1% lower to 62.3%). The total employed in the labor force rose by 93K to 163.4 million after a sharp decline in May. The U-6 notably saw a tick lower in June and declined to 7.7% from 7.8% in May. U-6 was at 8.0% as recently as Feb 2025.
Payroll adds of 147K in the Establishment Data were led by Private Services occupations at +68K (Health Care and Social Assistance at +58.6K, Leisure and Hospitality at +20K). The Government payroll adds of +73K were led by State (+47K) and Local (+23.2K) with Federal at -8.1K. The massive Professional Services line (22.6 million) barely moved at -7K.
The occupations leading the payroll additions fall outside what we would call “multiplier effect industries.” Notably stagnant or lower was Manufacturing at -7K (Durables -5K, Nondurables -2K), Mining and Logging (includes E&P) at -2K, but Construction was +15K within the broader “Goods” category.
The following updates our rolling commentary on employment that we publish each month. We post a detailed breakdown across occupations separately later in the day.
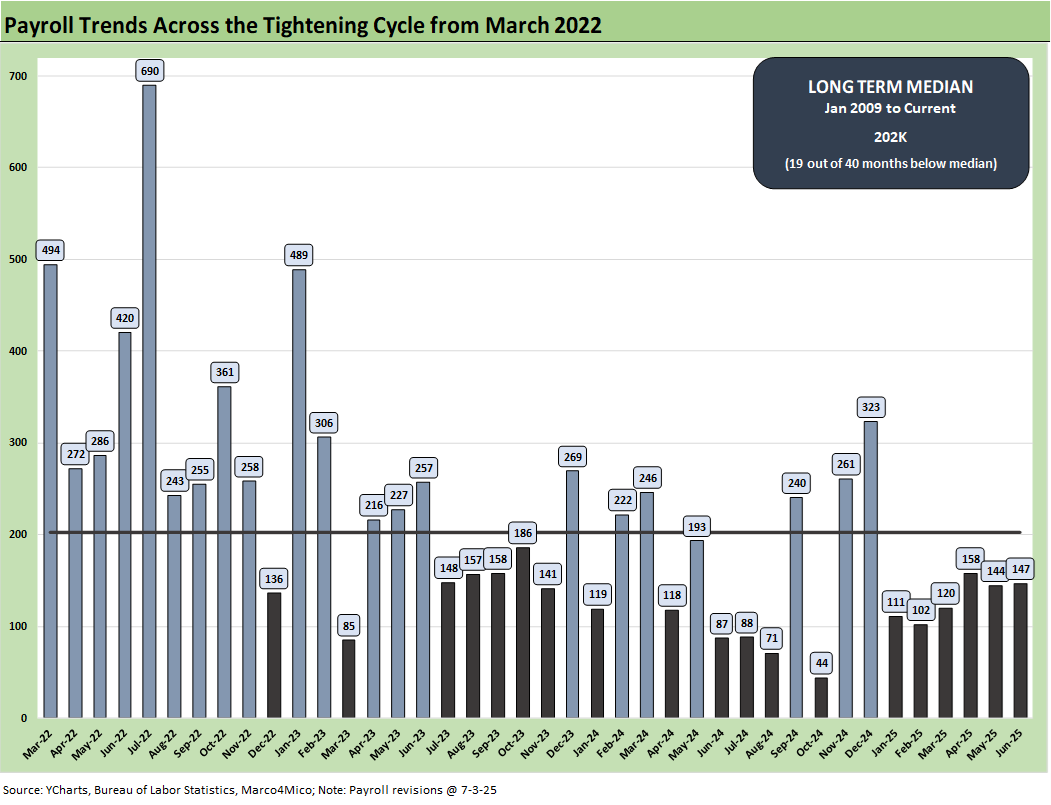
The above chart updates the monthly payroll adds since March 2022 when the tightening cycle started. The 147K is well below the long-term median from Jan 2009 (202K), but the June numbers look strong relative to expectations and recent flagging macro indicators on the consumer side and a base of anxiety around how to factor in tariff risk.
Those optimists hoping for major tariff retrenchment will start getting more information to digest as the pauses end and court activity does not slow it down. There are few signs of Trump backing off yet, and his Vietnam “trade deal” still marks a major change from history for what is generally an importer of low price and low value-added goods. We will look at the Vietnam trade issue separately, but Vietnam has soared up the ranks over the past decade and is one of the largest trade deficits (Tariffs: Stop Hey What’s That Sound? 4-1-25). Trump has many high-volume tariffs coming in the Section 232 pipeline, and the impacts will be rolling in across the summer along the importer to consumer chain.
We see a mediocre YTD 2025 for payroll adds in the chart above but still solid in the context of fears and a weaker consumer sector. The expectation of a GDP growth year in 2025 well under 2.0% based on a wide range of forecasts (median of the Fed gang of the 19 dot plot/SEP, the OECD, the World Bank, etc.). The 1Q25 GDP details were not inspiring and the PCE income and outlays numbers were soft this month (see PCE May 2025: Personal Income and Outlays 6-27-25, 1Q25 GDP: Final Estimate, Consumer Fade 6-26-25)
All months have been positive in adds in the chart above. We saw a weak summer of 2024 that gave the Fed an excuse to ease (even if it eased too much) in Sept 2024 that sent the UST curve and mortgage rates to brief lows (see Footnotes & Flashbacks: State of Yields 6-29-2025 ). The payroll adds exceed what most would see as surpassing demographic needs.

The above chart plots the running job adds/declines since Jan 2009 against the unemployment rate, which ticked lower to 4.1% from 4.2% MoM. We isolate the worst months of the COVID dislocations in the above box for better visuals to capture the other periods.
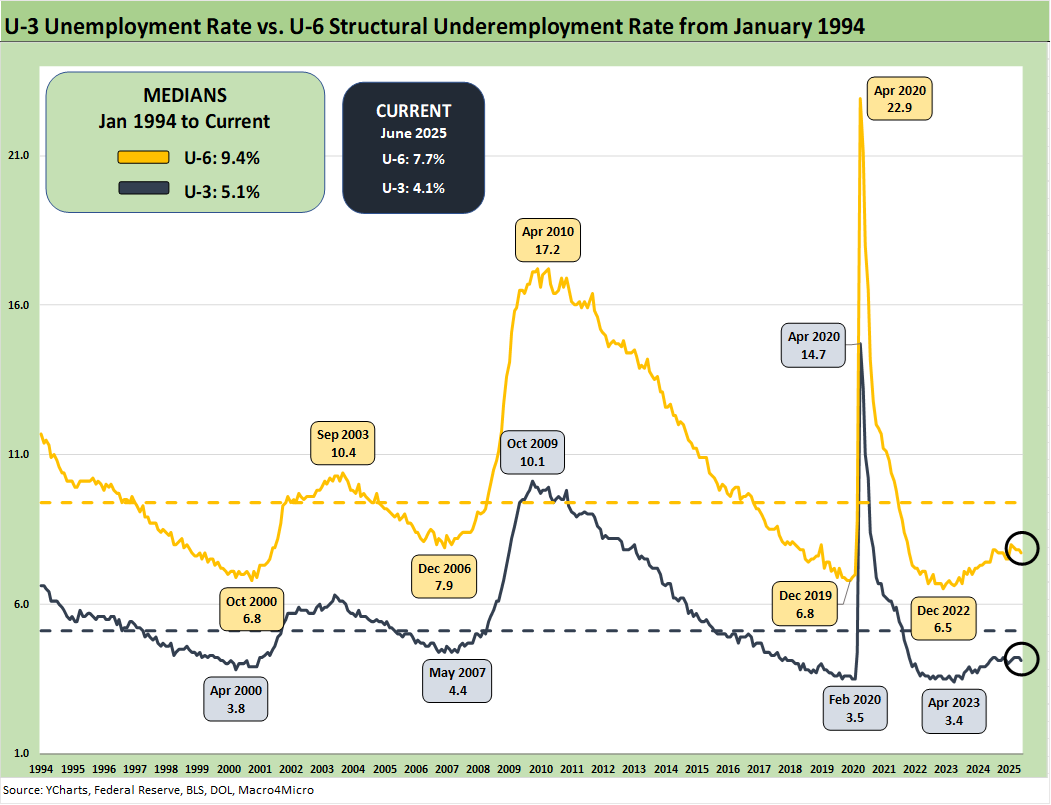
The above chart updates the time series for the U-3 unemployment rate and U-6 structural underemployment rate across the years from 1994. The current U-3 rate ticked lower to +4.1%. As a reminder, the U-6 metric is defined with the numerator as “total unemployed + persons marginally attached to the labor force + total employed part time for economic reasons.” The denominator is “civilian labor force + workers marginally attached to the labor force.”
The U-6 ticked lower to 7.7% from 7.8%. The U-6 rose sharply in Feb 2025 to 8.0% from 7.5% in Jan 2025. The current 7.7% is well above the 6% handles seen in spring of 2023. The U-6 is also up from the 7.4% level of last year during June 2024. The 7.7% U-6 is below the median from 1994 of +9.4%. That 9.4% includes the post-crisis shock and the longest recession since the Great Depression.
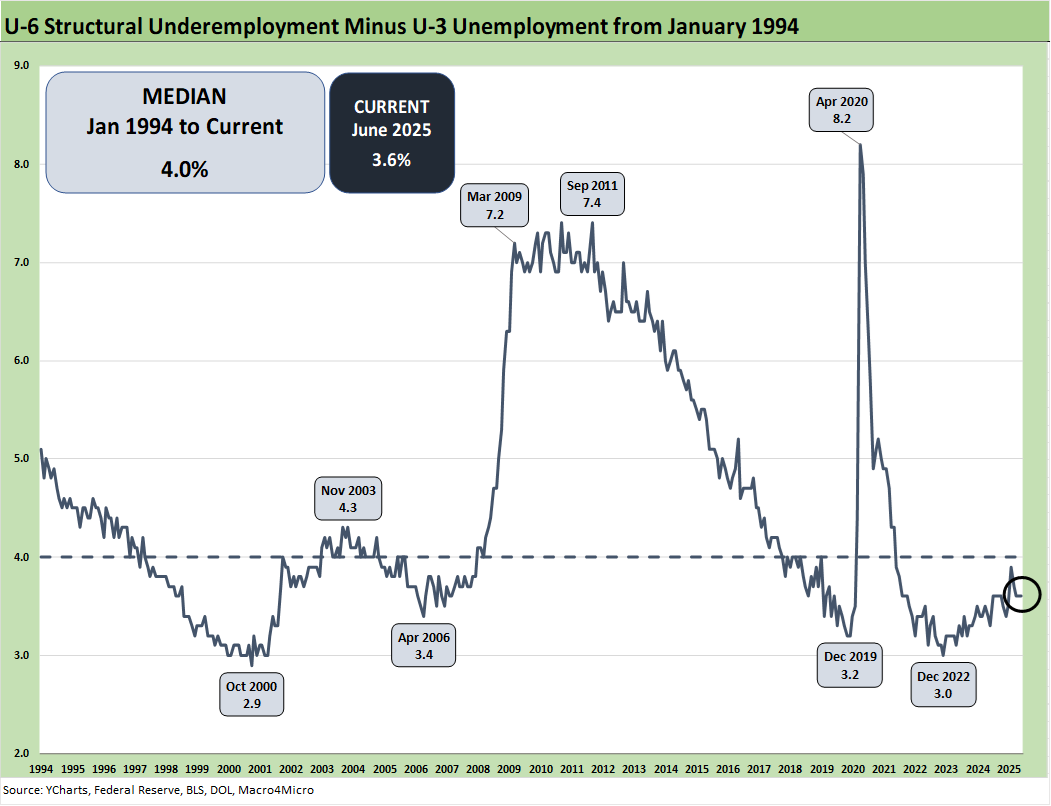
The time series above updates the U-6 minus U-3 differential as a measure of relative employment quality and to flag risks of major dislocations in large swaths of the economy (think oil patch in the late 1980s, tech bubble imploding 2001-2003, financial services and automotive in 2009). The current 3.6% differential is modestly below the long-term median of 4.0%. The job ranks are steady now but in an eerie stretch of time as the tariffs get worked out and employers make decisions on offsets to mitigate the tariff damage if they are not passing along the cost in prices or want to mitigate the scale of the price increase to customers.
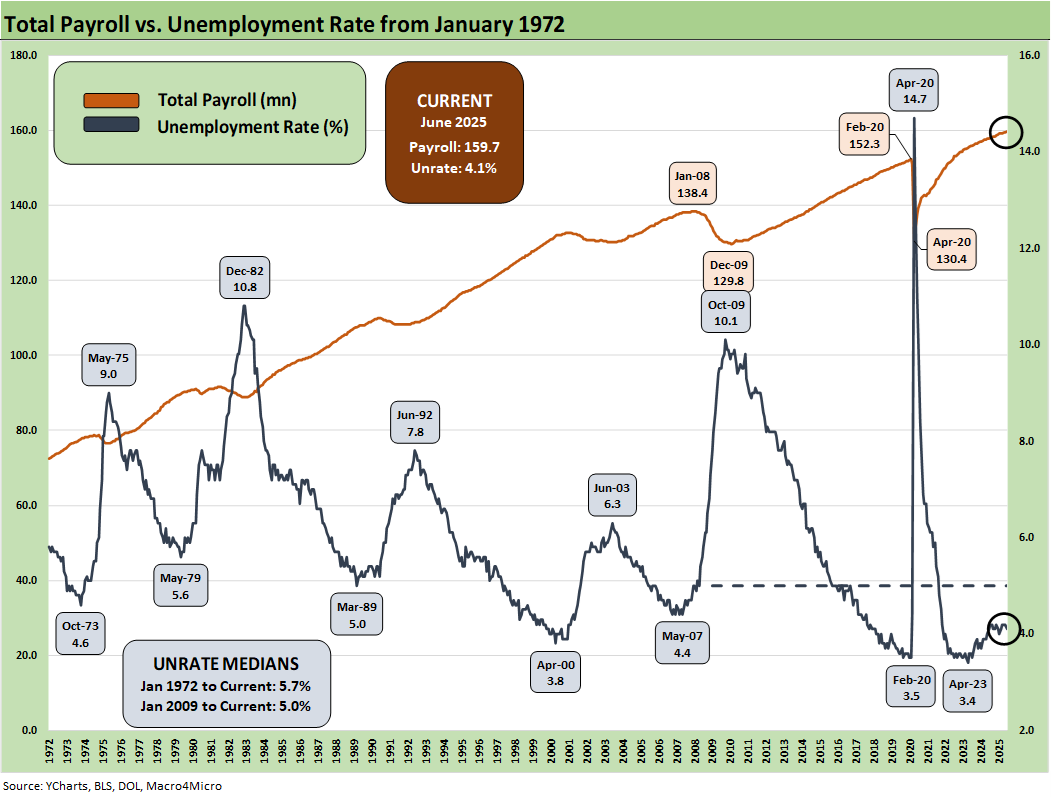
The above chart updates total payroll vs. the unemployment rate. More bodies with more paychecks is always by definition a good thing. The trick from here is how the consumer deploys that paycheck. We saw weakening in consumer income and consumption in the latest release (see PCE May 2025: Personal Income and Outlays 6-27-25). Soft survey numbers for consumers remain an area of focus even if they have climbed off the bottom and eased after the worst of the Liberation Day nerves and China trade worries. The consumer has ample reason to get defensive and push saving rates much higher than what we saw in the monthly PCE numbers.

The above chart updates the total payroll number vs. job openings. The most recent JOLTS number was favorable in openings but more mixed in the “hires vs. fires” balance (see JOLTS May 2025: Job Openings vs. Filling Openings 7-1-25). The Job Openings came in above the highest level posted under Trump in his first term when he saw 7.5 million in Nov 2018.
The 7.8 million this past week was impressive. That is a high number of openings. Now the trick will be filling some of the less compelling jobs as low-cost labor pools hide from the heavily armed masked men with no IDs and who sometimes carry automatic rifles. Some have supressors (some say “silencers”), and the natural question is “Are you worried about your hearing? How many shots are you planning to fire?!”
The 2Q25 earnings season is dead ahead prior to the later Retail reporting periods, and we will get a fresh round of information from more vulnerable sectors to the tariff threat such as retail and numerous auto-related companies. By then, the “reciprocal tariffs” will all be up on the screen as reporting kicks off. The challenge in “reciprocals” is that they are not “reciprocal tariffs.” They are tariffs designed to eliminate trade deficits (see Reciprocal Tariff Math: Hocus Pocus 4-3-25, Reciprocal Tariffs: Weird Science Blows up the Lab 4-2-25). As we heard from Nike on its $1 billion tariff cost, that means more strategic adjustments, price increases, and cost mitigation actions (see Mini Market Lookback: Eye of the Beholder 6-28-25).
The management teams have a lot of moving parts to factor into guidance whether quantitative or qualitative. The color in the trade literature and in economic releases such as the Beige Book that drill down into the weeds are clearly signaling the tariffs are a major problem. For some (notably retail and many small businesses), the threat can be existential. The cash drain in “writing the tariff check” and the hit to earnings from the expense line can impair trade credit and fuel bank credit problems for small businesses that are the backbone of payroll counts in the US.

The CPI vs. Unemployment Rate time series will start getting more focus as stagflation debates get louder and the focus on upward pricing pressure from tariffs get more reliably framed against potential layoffs and downsizings. At 4.1% on the U-3 in June 2025, the unemployment rate frames up favorably vs. the long-term median of 5.7% while the May 2025 headline CPI of 2.4% (2.8% Core CPI) remains under the long-term median of 3.1% (see CPI May 2025: The Slow Tariff Policy Grind 6-11-25). Inflation reports have generally brought good news relative to expectations given the scale of the forward threat and lagging effects to be seen across working capital cycles. For May, we saw both headline PCE and Core PCE tick slightly higher, and the most recent FOMC meeting saw the Gang of 19 again raise median PCE inflation forecasts for 2025.
If there was no tariff threat, the FOMC would be easing more rapidly. Trump complains, but he does not even admit that the buyer writes the tariff check. Even with this recent Vietnam news, he still paints the picture of “seller pays.” He occasionally implies the buyer bears more of the cost (which is separate from “who writes the check”), but then he defaults to the theme of collecting “hundreds of billions” from selling countries in Trump 1.0. The buyer writes the check to customs, which is a fact. The routine falsehoods from the White House around that topic is just one more sign that disinformation becomes a religion and captive partisan policy makers cannot deviate from the “message.”
The 4.1% U-3 is in line with metrics that in the 1990s would have been called full employment. Being competitive in U-3 levels with the 1990s is a good thing, but we expect unemployment to rise across 2H25 as tariffs elicit reactions. The 1990s was actually the greatest economy in postwar US history and crushed the numbers of the post-2000 Presidents. That gets into the broader discussions of how high sovereign systemic debt can undermine growth and how the post-2000 years have been a case study in rising US sovereign leverage.
See also:
Asset Return Quilts for 2H24/1H25 7-1-25
JOLTS May 2025: Job Openings vs. Filling Openings 7-1-25
Midyear Excess Returns: Too little or just not losing? 7-1-25
Footnotes & Flashbacks: Credit Markets 6-30-25
Footnotes & Flashbacks: State of Yields 6-29-2025
Footnotes & Flashbacks: Asset Returns 6-29-2025
Mini Market Lookback: Eye of the Beholder 6-28-25
PCE May 2025: Personal Income and Outlays 6-27-25
Durable Goods May25: Aircraft Surge, Core Orders Modest Positive 6-26-25
1Q25 GDP: Final Estimate, Consumer Fade 6-26-25
New Home Sales May 2025: Slip and Slide 6-25-25
KB Home 2Q25: Negative Industry Trends Keep Coming 6-25-25
Existing Homes Sales May 2025: Sequential Stronger, YoY Weaker 6-23-25
Mini Market Lookback: FOMC Spoke Clearly, Iran and Trump up next 6-21-25
Lennar 2Q25: Bellwether Blues 6-20-25
FOMC Day: PCE Outlook Negative, GDP Expectations Grim 6-18-25
Home Starts May 2025: The Fade Continues 6-18-25
May 2025 Industrial Production: Motor Vehicle Cushion? 6-17-25
Retail Sales May 25: Demand Sugar Crash 6-17-25
Mini Market Lookback: Deus Vult or Deus Nobis Auxilium 6-14-25
Credit Snapshot: Hertz Global Holdings 6-12-23
CPI May 2025: The Slow Tariff Policy Grind 6-11-25
Mini Market Lookback: Clash of the Titans 6-7-25
Payrolls May 2025: Into the Weeds 6-6-25
US Trade in Goods April 2025: Imports Be Damned 6-5-25
Past-Prologue Perspective for 2025: Memory Lane 2018 6-5-25
Tariffs: Testing Trade Partner Mettle 6-3-25