
Footnotes & Flashbacks: State of Yields 7-20-25
A constructive week for UST with an FOMC meeting coming soon (30th) and Trump’s Powell hate-a-thon picking up pace.


It’s agreed. I get 75 bps easing in 2025 and Powell can stay.
Trump faces the challenge of boasting about the US being super “hot” and the greatest 6 months since the founding of the nation but all the while calling for 300 bps of Fed easing with inflation above target. Meanwhile, many prevailing GDP forecasts are projecting 2025 growth well under 2.0% and sub-2% in 2026.
The challenge for the 19 Fed economists who are projecting higher median PCE inflation (headline and core) in 2025 is how to frame many new, high cash tariffs yet to be paid after Aug 1 (paid by the buyer, no matter what Trump says). In addition, more tariffs are soon to be announced targeting pharma, semis, aircraft/parts, and lumber.
The conclusion could be reached that Trump is not worried about inflation but would like the Fed to share the blame so tariffs are not the only culprit. Trump appears to favor moving growth higher on easing even at the cost of inflation. The problem is he won’t admit growth is slow and slated to stay that way.
Trump may see inflation with higher growth as a better outcome for his party in 2026 with his “own man” controlling the Fed by then (he hopes sooner). Steepening and weak duration returns could be the cost along the way. Stagflation obviously cannot be ruled out yet in the worst-case scenario.
The following updates our rolling weekly State of Yields commentary.
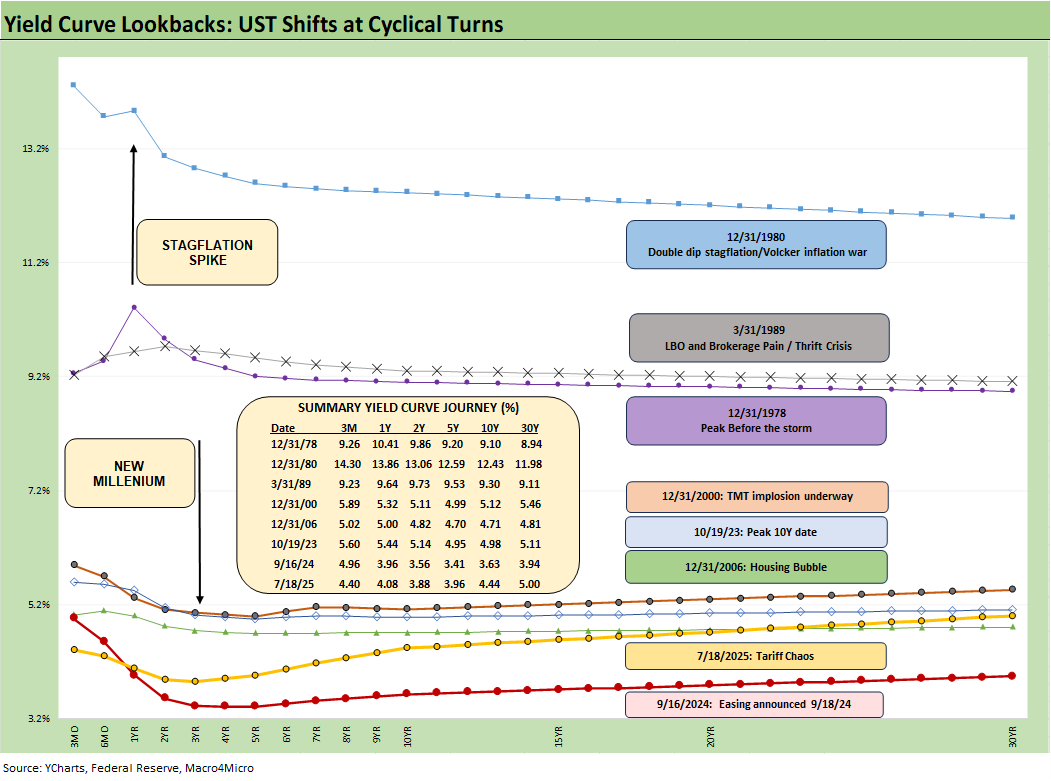
The above chart plots some key cyclical transition periods from the Carter inversion of 1978 across the Volcker years, the1980s credit cycle peak in 1989 (note the 9.2% 3M UST), the TMT cycle faltering in 2000 (on the way to a massive Greenspan easing in 2001), and the housing bubble in 2006. During the 2004 to 2007 period, leveraged derivative exposure and structured credit was out of control and counterparty risk was soaring. Worth highlighting is that the current 3M UST is notably lower than the pre-crisis, pre-ZIRP 3M UST levels from those past credit cycle peak years.
The chart then jumps from 2006 to 2023, which takes the market beyond the crisis period and the ZIRP years and COVID. Both the post-credit crisis period and COVID prompted the Fed to deliver a wave of market liquidity support and confidence building programs that helped save the capital markets and supported the banks. That period brought plenty of QE and normalization distortions to the yield curve shape.
The market saw a massive move lower and bull flattener to end 2023 after the 10Y UST peaked in Oct 2023 as we review below. Steeper and higher was not the forecast to start 2024 as the market expected flatter and lower. During 2024, the curve moved in an adverse direction with a bear steepener until a major UST rally alongside the Sept 2024 easing. That soon brought us a fresh steepening with some rallies and sell-offs along the way.
The current market is facing a balancing act with tariffs finally rolling into the working capital cycles and thus raising inflation risk. On top of those tariffs already in place, we will see waves of newly set tariffs with the “reciprocal tariff pause” coming to an end and tariffs essentially being assigned. Those “border taxes” will light up a fresh round of headlines in tariff-driven inflation vs. recession risk tied to weaker consumer demand and expense pressure on corporate expense lines.
The dilemma between inflation and stagnation raises the ultimate specter – stagflation. We have not seen a bout of stagflation since the 1980-1982 double dip, so it will be a new variable for many in the markets in a much more globalized economy.
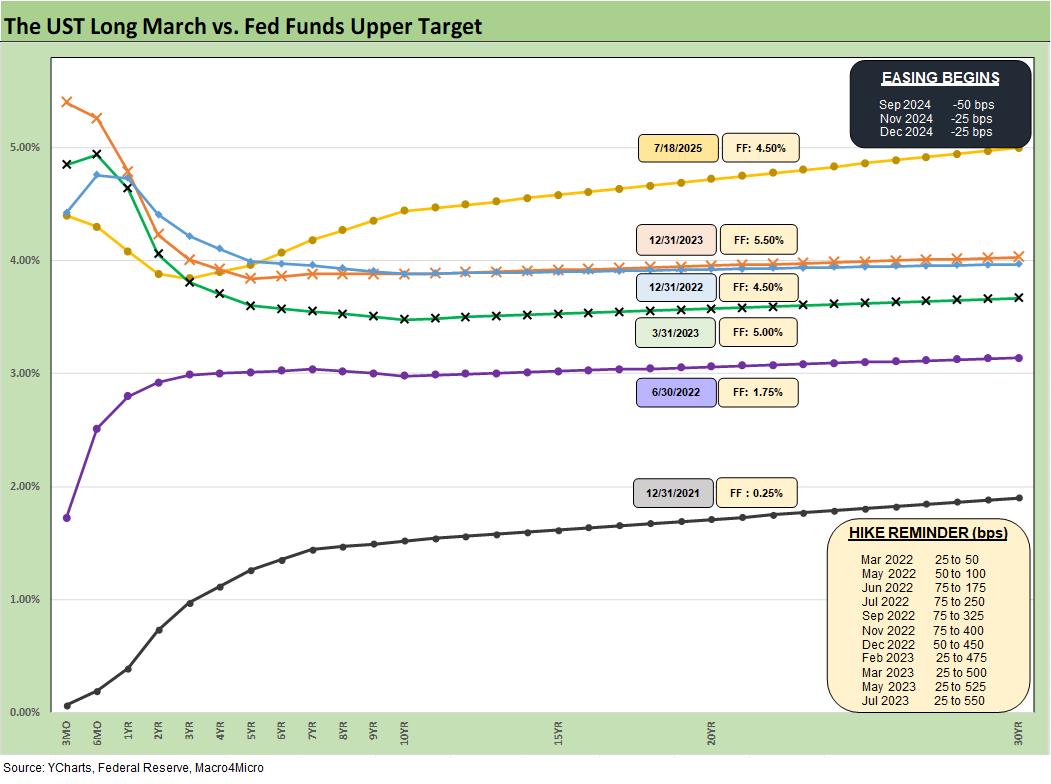
The above chart replays our weekly chart detailing the migration of the UST curve from 12-31-21 with a memory box detailing the tightening dates and magnitude and more recently the easing. The UST curve seems to intermittently mix bear steepening patterns and flattening rallies since the Sept 2024 lows, but market fear was creeping into the shapeshifting after Liberation Day before calming down with the pause.
Recent days brought the end of the pause and more unilateral assignments of tariffs by Trump with a few variations negotiated along the way such as Vietnam among a few others (see US-Vietnam Trade: History has its Moments 7-5-25). We also saw one with Indonesia, but the major trade partners have not come to terms, including the EU, Canada, Mexico, Japan, and South Korea among the most critical. Aug 1 is the new effective date and a quasi-deadline that could still shift. In substance these are not “deals” in the classic sense of the trade term.
After the Sept 2024 lows detailed above, we shifted back into a bear steepening along the way while mixing in some mini rallies. The UST curve will not be helped by record supply and shrinking demand, fears around the worst erosion of the dollar in decades, and diminished confidence in US governance (and in many cases competence). Trade hostility will not help and could even be a motive to avoid UST. We are looking at the highest risk of stagflation since the1980-1982 double dip, and tariffs will certainly not help.
The recent FOMC meeting saw another round of no action by the Fed with an increase in the number of votes for no change in 2025 to 7 from 4 in the “Gang of 19” dot plot (see FOMC Day: PCE Outlook Negative, GDP Expectations Grim 6-18-25). The consumer metrics of late (notably May income and outlays) turned soft, so June data delivered in July and July data delivered in Aug will be critical inputs for the market as well as the FOMC closes in on the critical September meeting.
Powell gets attacked by Trump since Powell never learned how to kowtow like a GOP Senator or a spineless House Rep. The reality is those FOMC decisions are made by a committee. Similarly, the very weak GDP forecasts and rising PCE inflation forecast medians are generated by 19 economists in the June SEP report and the same for the dot plot.
We are already seeing inflation impacts along specific product lines and there is an intuitive element to raising cash expenses (tariffs) paid by the buyer. That buyer either sees earnings decline or passes it on in price increases or cost cutting. Betting that 100% of the tariff cost is covered by the seller reducing prices can get you a job at the White House but fired from any functioning business with offshore sourcing. You will also flunk Economics 101.
The very poor US GDP forecasts are mirrored by the OECD, the World Bank and numerous major top banks. That could soon help the case for easing, but Trump’s tariffs are in the way for now. The major bank forecasts on US GDP are delivered by people who get paid by their employers and their clients and they can’t be primaried by Trump.
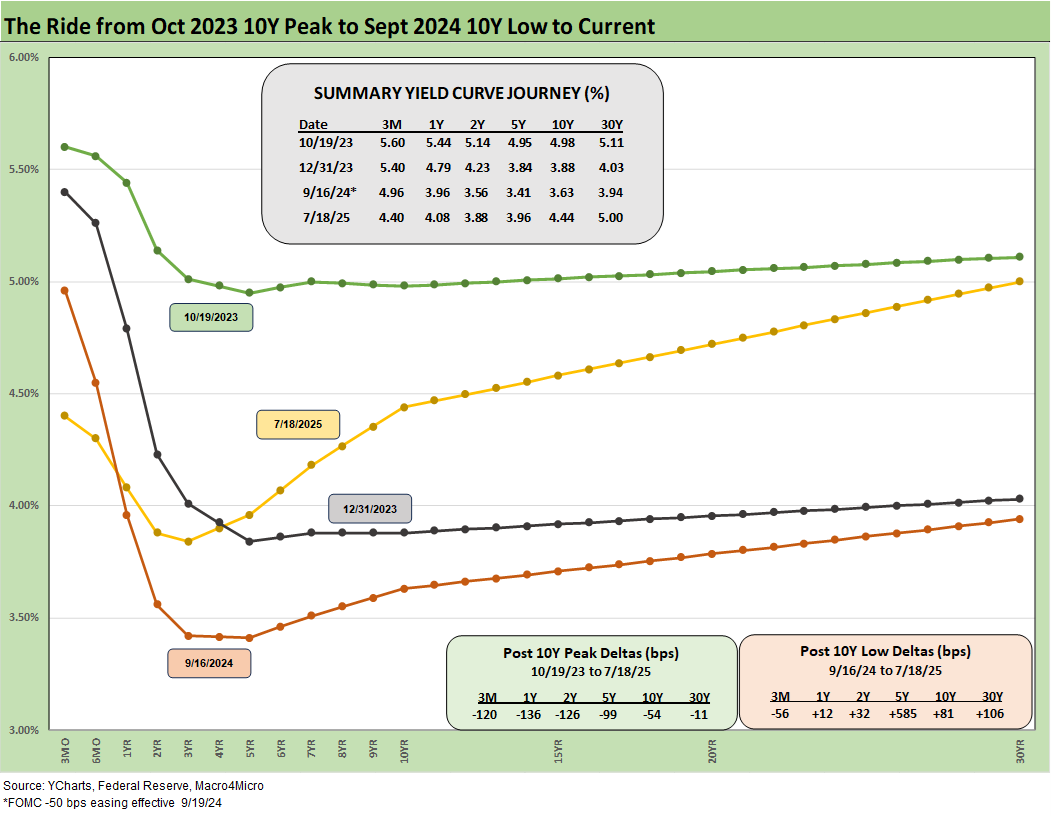
The above chart details the material move from the peak UST curve of 10-19-23 down into the UST bull rally of Nov-Dec 2023 and then eventually into the lows of Sept 2024. The Sept 2024 low tick only came after a bear steepener hit the curve through the summer of 2024. We then moved back into the bear steepener mode until the tariffs roiled the UST markets and initially sent 2Y to 30Y lower on cyclical fears.
The shift higher from Sept 2024 lows and the steepening from the low point at the end of 2023 is reflected in the chart. We see the 10Y and 30Y notably higher than Sept 2024 with a more normal upward sloping shape from 2Y out to 30Y. We look at the history of the 2Y to 30Y later in this commentary.
The challenge is still that front end inversion from 3M to 2Y and 5Y. The inversion anomaly on the front end during a protracted expansion has been hard to shake with the FOMC holding the line over tariff-related inflation questions. The June CPI report includes plenty of signs across the MoM CPI trends that show numerous product group line items seeing prices pushing higher. Fact deniers (like election deniers) will just say it is fake or there is no cause-and-effect. MAGA loyalists become convinced that “believing it makes it fact, and they tend to believe most anything Trump tells them on tariffs, Medicaid, elections, who pays the tariff, etc. The dismal science of economics will run its course regardless. Supply and demand will do what it does.
The stubborn 10Y UST has been a headwind for the housing markets (see Housing Starts June 2025: Single Family Slips, Multifamily Bounces 7-18-25, New Home Sales May 2025: Slip and Slide 6-25-25, Existing Homes Sales May 2025: Sequential Stronger, YoY Weaker 6-23-25). We got the weak June housing starts for single family last week and this coming week we will get the June Existing Home Sales and the June New Homes sales.
Housing is a major focal point for a read on the economic cycle as well as the consumer appetite for major ticket items (house, autos, vacations, etc.). We will see the major homebuilders reporting earnings this coming week for those that have June quarter end reporting periods (e.g., DR Horton, Pulte, NVR, Taylor Morrison, Meritage).
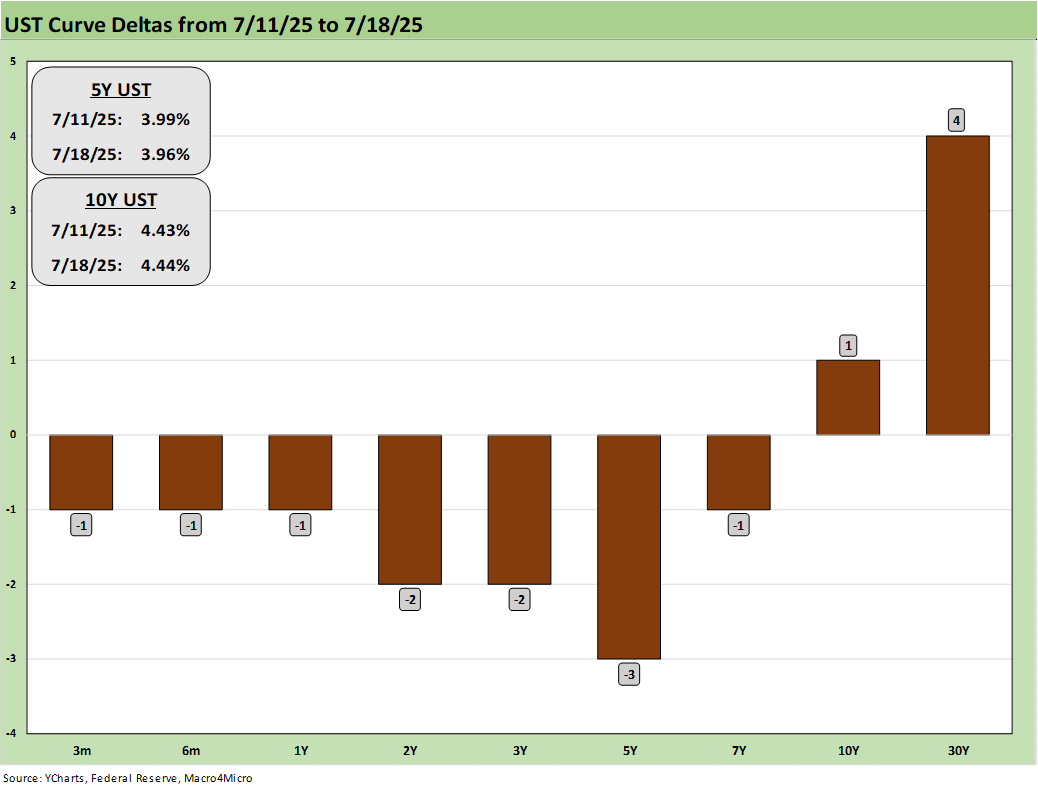
The 1-week US deltas above show a mild week for overall action with a bias lower that helped bond returns during the week (see Footnotes & Flashbacks: Asset Returns 7-20-25). The 30Y was swinging around with some intraday price moves linked to Powell termination threats that kept the 30Y a bit above or just below 5.0% across the week.
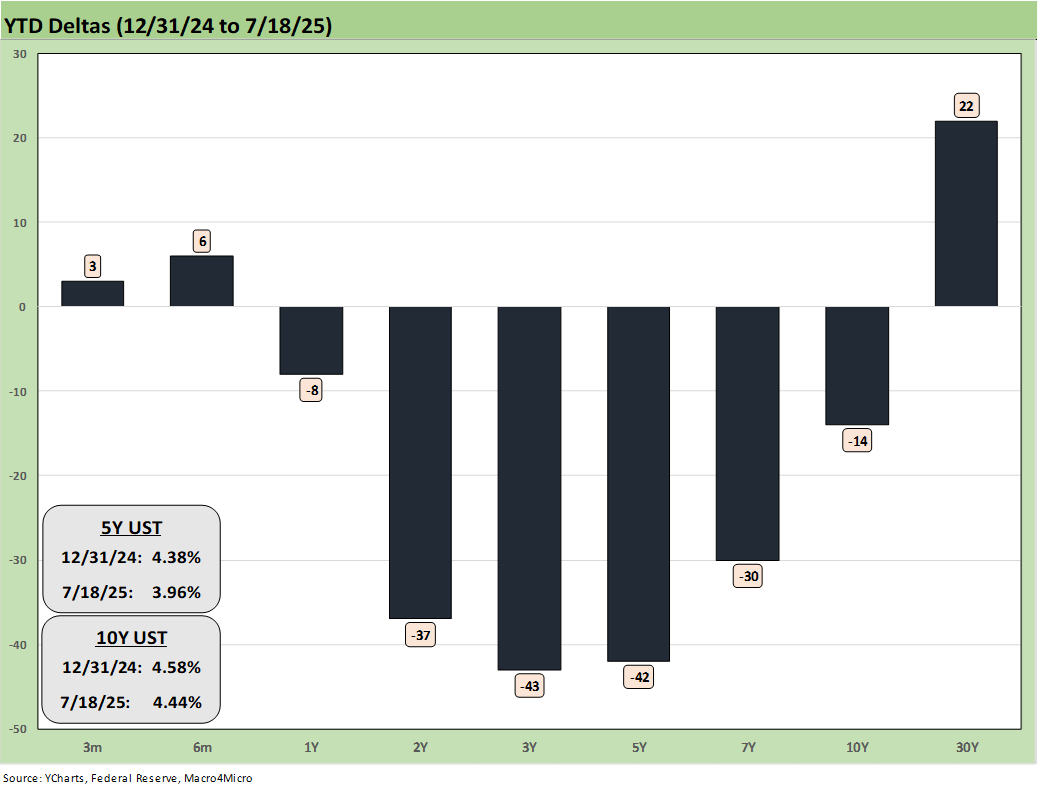
The YTD UST deltas show good news for bonds that kept 6 out of 7 bond ETFs in positive return range YTD with the sole exception of the long duration UST 20+Y ETF (TLT) as long bonds saw the 30Y UST charting its own course with inflation threats and Trump’s fixation on de facto absolute control of the Fed. The steepener threat is alive and well if Trump has his way.
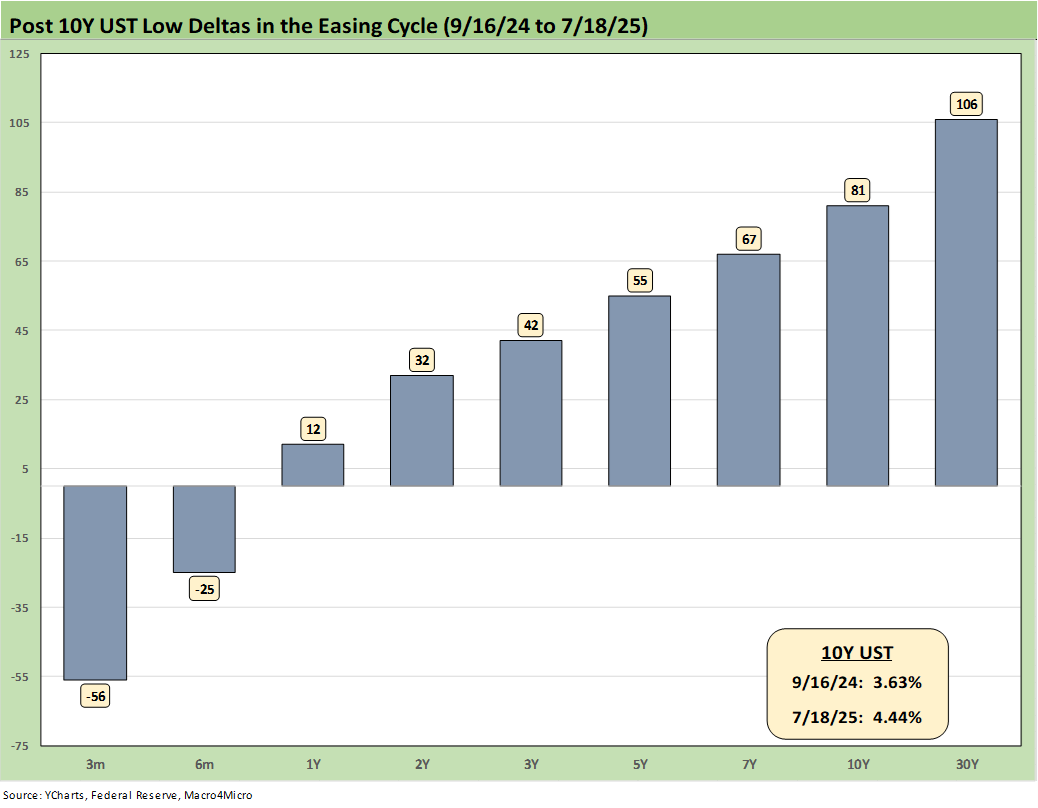
The above chart updates the UST deltas since the 9-16-24 lows that came alongside the Fed easing. That has not worked as many market watchers predicted on the shape of the UST curve, number of cuts and pace of easing that was supposed to follow.
Trump continues to rail at the Fed and Powell to lower rates, lately demanding 300 bps of easing, not long after he had demanded a 200 bps of easing, up from earlier demands of 100 bps in cuts. The move from 100 to 300 unfolded in a few weeks.
The reality is that Trump’s target fed funds rate for right now would be well below inflation. None of us can be sure if Trump took or passed economics while attending UPenn or Fordham. His former lawyer and fixer (Michael Cohen) claimed that Trump had threatened to sue any colleges that released his academic transcripts, so will never know.
With the market seeing inflation running above target and tariffs rising while Trump claims his economy is the “hottest” in the world, we are not sure a de facto stimulus via negative real fed funds is a conceptually sound (or coherent) plan. Once he gets “his guy” in the seat at the Fed, that will not stop someone from attaching a pedigree and PhD to that demand and doing it anyway.
The Powell attacks…
Trump offers little in terms of concepts or facts in his usual rants and insults with a few new lapdogs joining in (including the new head of the FHFA who calls upon his broadcast journalism degree for his economic input). Former Federal Reserve Governor Kevin Warsh has been lobbying for the job. His resume and academic credentials for the role are impeccable, but the dark side of power-seeking is also very much in evidence in candidate marketing. We have seen this movie before.
The FOMC would likely be easing now if it was not for Trump’s over-the-top and unprecedented tariff game plan. Powell said as much in his Washington testimony. Easing would appear to need a jobs setback that has not appeared in recent releases. Powell will be speaking this week. Trump will be ranting.
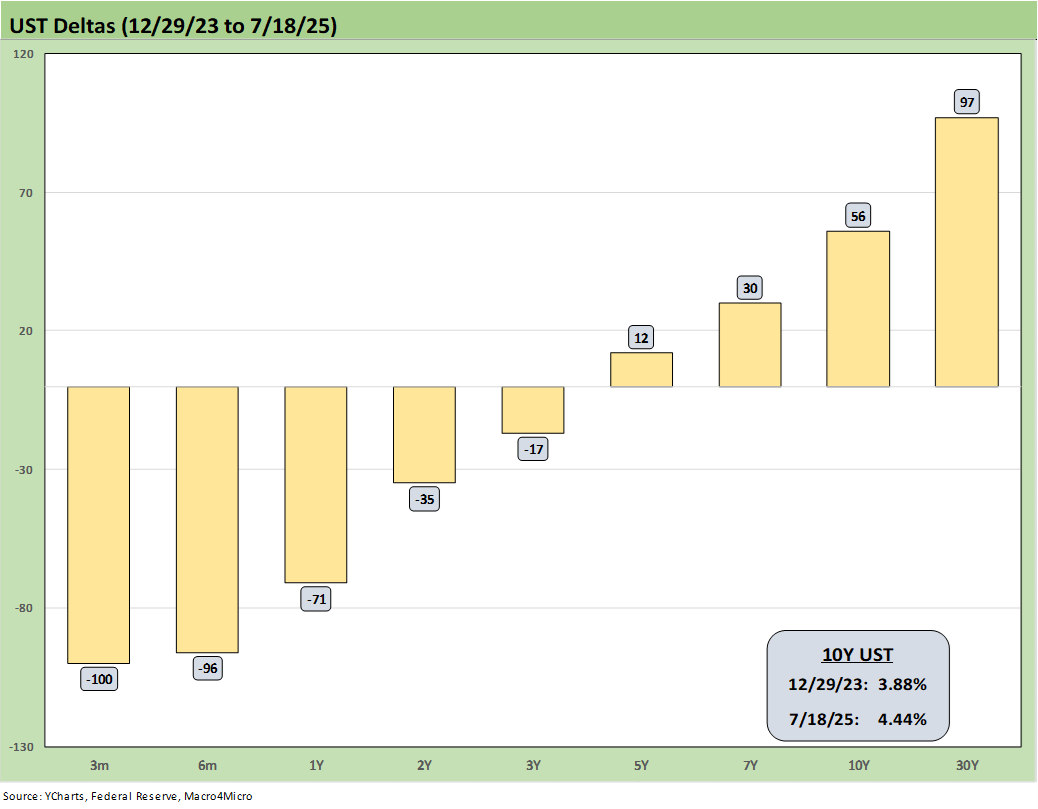
The above chart updates the UST deltas from the end of 2023 after a massive rally in rates and risk in Nov-Dec 2023. The follow-on in 2024 expected by the consensus mildly disappointed the UST bulls in the number of FOMC cuts. The market got 4 x 25 (a double in Sept) but not the number of 5 to 6 FOMC 25 bps cuts expected). The expectation of a pronounced bull flattening during 2024 also did not play out as expected when a bear steepener prevailed by the end of the year. As detailed in the earlier chart, the 2025 period has fared better for bonds on a modest bull steepener.
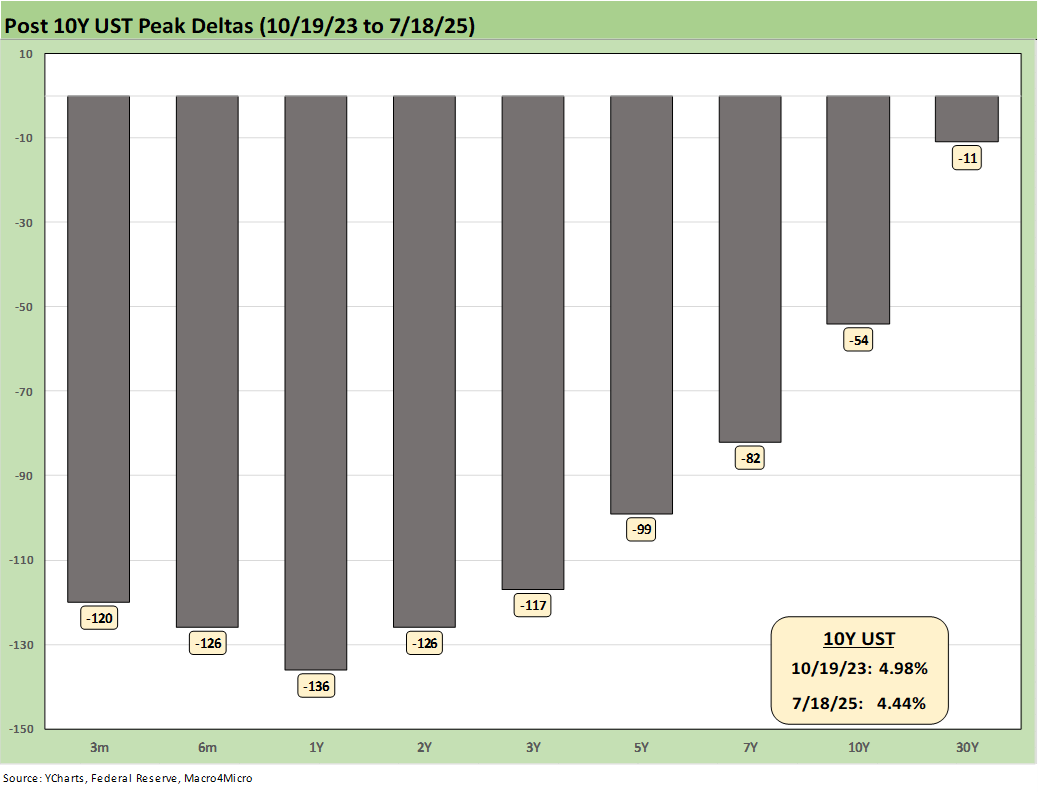
The above chart updates the running UST deltas from the 10-19-23 peak date of the UST 10Y when it barely missed the 5.0% line. For those looking for a frame of reference on what a bad move in inflation metrics might mean, these deltas at least offer a recent set of data points during an inflation fighting year such as late 2023 and into 2024 (until Sept 2024 began the easing process). That is why we keep revisiting that timeline. It reminds us what reversion could mean.
These rally deltas could revert in part or in whole with the wrong inflation outcomes. We don’t need to see 2022 again, but the old saying “It happened before, it can happen again” resonates for many.
Losing a rally of -54 bps in the 10Y UST above would hurt the mortgage market and would lead to a material valuation headache in equities, M&A economics, and capital project planning. Mortgages have been a drag on housing (new and existing home sales). The risk of inflation heading the wrong way would do more damage. Stubborn rates or higher rates in the short end to 5Y would damage consumer durables financing and related volumes.
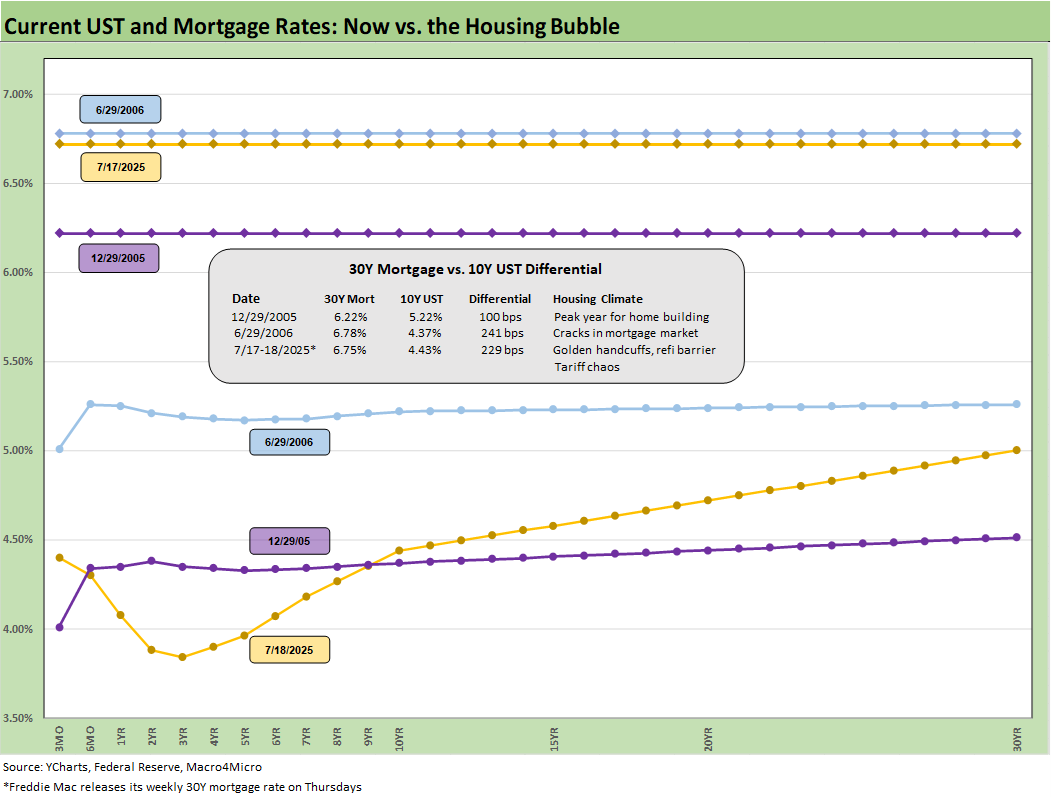
The above chart is one of those replay slides we update each week. This one posts the UST curve for this past Friday and the Freddie Mac 30Y Mortgage benchmark rate (noon Thursday release). We include two useful historical periods including the peak homebuilder year end of 2005 and mid-2006 when RMBS quality concerns were catching headlines as the housing bubble was peaking.
We post UST curves for each period in the chart. The past week saw rates move higher to 6.75% from 6.67% the prior week. We have seen minor moves recently, but that was after a 200 bps range since fall 2023.
We include a column above detailing the differential between the Freddie Mac 30Y and the 10Y UST. That differential moved lower this week to +229 bps from +232 bps. The year 2005 posted a differential of only +100 bps and makes a statement on what the mortgage market was like in 2005. The mortgage market was very hot back then in the housing bubble as mortgage volumes soared during that peak homebuilding year and a very busy period of refinancing was running alongside as a source of funds for homeowners. The credit markets started to blow up in the summer of 2007 and the recession began in Dec 2007 (as later determined by NBER).
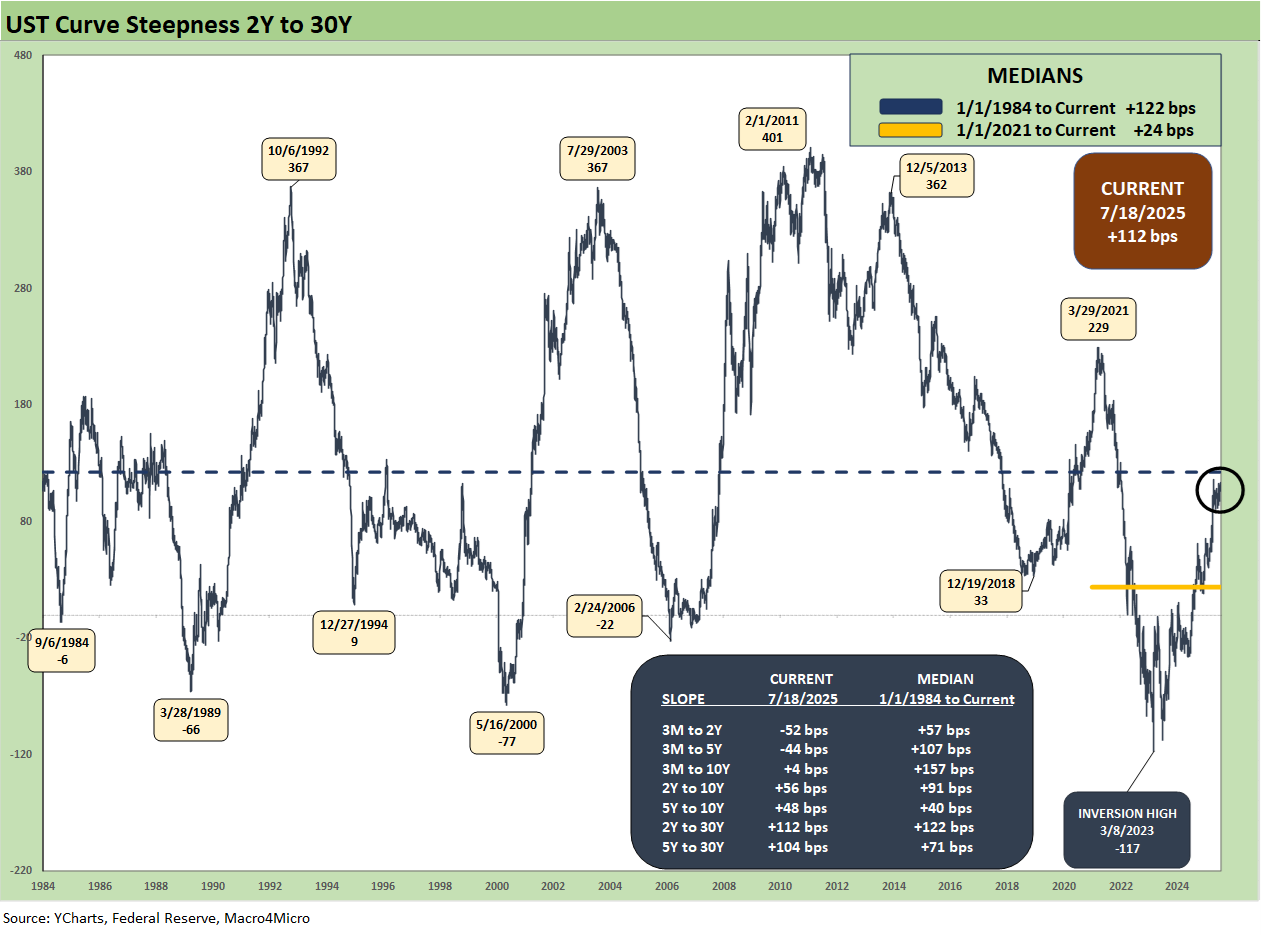
The 2Y to 30Y UST slope is now closing in on the longer-term median from 1984 with the current slope at +112 bps only 10 bps below the median of +122 bps. That is a long way from the -117 bps high on the 2Y-30Y inversion peak reached in March 2023.
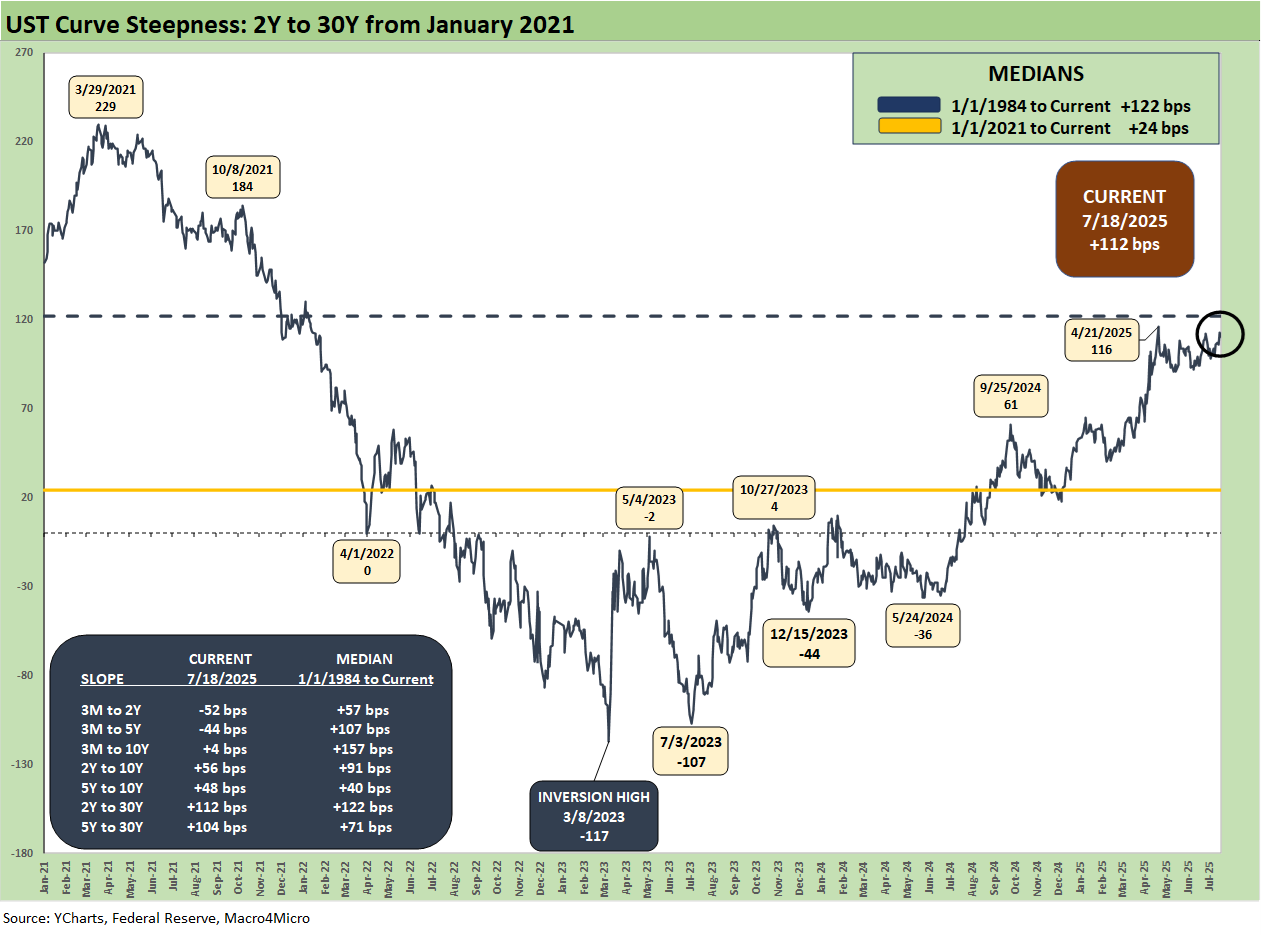
The above chart shortens up the timeline from early 2021 when ZIRP was still in place. The shorter period gives a better granular view on the rise in the slope to +229 bps in March 2021 on the way down to -117 bps in March 2023 then back to the current +112 bps.
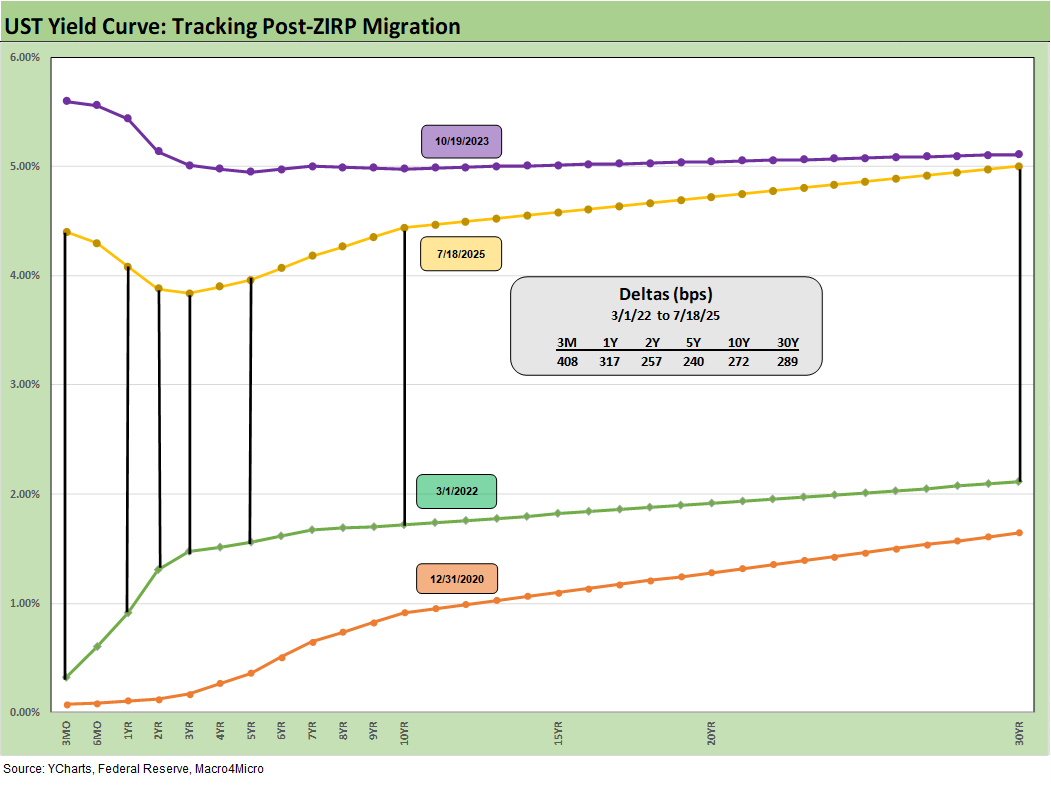
We wrap this week’s State of Yields with an update of the running UST deltas since March 1, 2022 just ahead of the end of ZIRP (effective 3-17-22). We include the 12-31-20 UST curve and 10-19-23 peak UST curve as frames of reference.
Markets:
Footnotes & Flashbacks: Asset Returns 7-20-25
Mini Market Lookback: Macro Muddle, Political Spin 7-19-25
Housing Starts June 2025: Single Family Slips, Multifamily Bounces 7-18-25
Retail Sales Jun25: Staying Afloat 7-17-25
June 2025 Industrial Production: 2Q25 Growth, June Steady 7-16-25
CPI June 2025: Slow Flowthrough but Starting 7-15-25
Footnotes & Flashbacks: Credit Markets 7-14-25
Mini Market Lookback: Tariffs Run Amok, Part Deux 7-12-25
Mini Market Lookback: Bracing for Tariff Impact 7-5-25
Payrolls June 2025: Into the Weeds 7-3-25
Employment June 2025: A State and Local World 7-3-25
Asset Return Quilts for 2H24/1H25 7-1-25
JOLTS May 2025: Job Openings vs. Filling Openings 7-1-25
Midyear Excess Returns: Too little or just not losing? 7-1-25
Recent Tariff commentary:
US-Italy Trade: Top 15 Deficit, Smaller Stakes 7-18-25
US-France Trade: Tariff Trigger Points 7-17-25
Germany: Class of its own in EU Trade 7-16-24
US-Canada Trade: 35% Tariff Warning 7-11-25
India Tariffs: Changing the Music? 7-11-25
Taiwan: Tariffs and “What is an ally?” 7-10-25
US-Trade: The 50% Solution? 7-10-25
Tariff Man Meets Lord Jim 7-8-25
South Korea Tariffs: Just Don’t Hit Back? 7-8-25
Japan: Ally Attack? Risk Free? 7-7-25
US-Vietnam Trade: History has its Moments 7-5-25
US Trade in Goods April 2025: Imports Be Damned 6-5-25
Tariffs: Testing Trade Partner Mettle 6-3-25
US-UK Trade: Small Progress, Big Extrapolation 5-8-25
Tariffs: A Painful Bessent Moment on “Buyer Pays” 5-7-25
Trade: Uphill Battle for Facts and Concepts 5-6-25
Ships, Fees, Freight & Logistics Pain: More Inflation? 4-18-25