
PCE May 2025: Personal Income and Outlays
The income numbers were noisy and pre-buying effects distorted, but we see some pockets of clarity.

Single question IQ test: Does the buyer or seller write the tariff check to customs?
The negative MoM moves in personal income (-0.4% current dollar) in May and disposable personal income (DPI) at -0.6% for current dollar MoM do not tell a great economic story. The declining MoM trend in both real personal consumption expenditures (-0.3%) and current dollar PCE (-0.1%) include some asterisks, but the net cyclical signals are still negative.
Stubborn headline PCE remained a factor with a tick higher to 2.3% YoY (vs. 2.2%) YoY while Core PCE rose to +2.7% from 2.6%. The hints of Goods inflation are creeping in with Durables swinging from YoY deflation in March and April to inflation YoY at +0.1% in May from -0.4% in April. Services PCE inflation YoY remained sticky at 3.4%. Energy Goods and Services remained in deflation mode at -4.6% supportive of headline.
Consumption (PCE) ticked lower to +2.2% YoY from +2.9% in April and 3% handles in 4Q24. Goods were down YoY to 3.0% from 4.7% in April but Durable Goods were down to 3.8% from 7.7% in April and 7.4% in March in the tariff rush to pre-buy inventory. Services real PCE was down to 1.8% in May for a recent low from the 2% and 3% handles since the start of 4Q24.
The soft consumption and income numbers could give some ammo to the Fed easing advocates, and Trump was especially vocal about Powell’s “low IQ” and being” stupid.” That said, Powell knows the buyers write the check to customs for the tariff while Trump thinks it is the seller. Hopefully that isn’t the only question on Trump’s IQ test.
A few more upticks in Goods inflation and softer PCE will make for some challenging decision points for the FOMC by the Sept meeting after the median PCE inflation forecasts were just raised again in the June meeting (see FOMC Day: PCE Outlook Negative, GDP Expectations Grim 6-18-25).
The record highs for the S&P 500 and NASDAQ followed the PCE release, so absence of new trouble still prevails in equities since the April tariff whipsaw. The 1999 boom (+86% NASDAQ) and fall 2007 highs remind us that the lurking risks can derail the market and the sustained, constructive economic data. The ingredients in late 1999 included the start of a default cycle while the credit market freeze of late 2007 and massive counterparty risk made for a different backdrop. We lack that scale of credit market threats today, and that helps fortify equity investors.

The above time series updates “fed funds minus Core PCE” since 1973 for a read on “real fed funds” and to what extent the Fed is engages in “real” tightening as opposed to the “closet accommodation” that we saw in much of 2H22 when tightening was moving into higher gear but badly lagging inflation.
The long-term differential is +1.5%, and the differential now is +1.7% in a small sequential downtick from April. That leaves room for easing, but the final judgement on actions comes down to how you see the tariff threat and what that might mean for forward inflation.
There is not much room in that differential for an adverse move in Core PCE at current fed funds rates. A move higher in inflation from tariffs could push that number well inside the median and even send the metric into negative range. Anyone who experienced 2022 (let alone those of us ringside for 1974-1975 and the 1979-1982 ride) know the inflation numbers can move quickly.

The above chart updates the long-term time series for PCE vs. Core PCE across the decades and cycles. We see the 2.6% headline PCE long term median in the lower left (vs. the current 2.3%) and the 2.4% core PCE median (vs current 2.7%). That is dramatically better than where we came from in 2022 but still above the 2.0% target. The May 2025 numbers are good numbers in long term context, but they just moved in the wrong direction at a time when the FOMC is bearish on the PCE inflation forecast.
In the absence of the tariff uncertainty, the Fed might have room to cut sooner (in theory). Powell said as much this past week. That set Trump off on round N+1 of insulting Powell. The attacks on Powell increased this past week from Trump (who thinks the seller pays the tariff) with the new FHFA head Bill Pulte joining the tirade. Pulte’s economic credentials are that he majored in Broadcast Journalism and is a descendant (grandson) of the legendary founder of Pulte Group. (He is thus a fellow traveler with Trump in the silver spoon club).
As the medians above highlight and the following charts show, it takes a lot to go wrong to get sustained 2.0% PCE inflation. What no one in the White House seems inclined to point out in the FOMC bashing is that multiple trade wars could cause more than a few economic calamities including stagflation. We are still not getting a full-throated admission from Trump that the buyer pays the tariff although his threats against retailers imply as much. Nike certainly made it clear when they put a $1 billion price tag on the tariffs this past week.

The above chart frames the long-term differential history between PCE and Core PCE since 1972. The long-term differential is zero and we currently stand at -0.4%. The volatility around that compressed long-term median flows into the energy wildcard with some food distortions also back in the 1970s. We look at some of the CPI energy and food inflation moves in separate commentaries (see Inflation: The Grocery Price Thing vs. Energy 12-16-24, Inflation Timelines: Cyclical Histories, Key CPI Buckets11-20-23).
The oil wildcard will remain one that Trump and team want to work in their favor. The recent Iran bombings and brief but intensive Israel-Iran clash brought a brief scare as WTI climbed to near $74 (below $66 as we go to print) before returning to a downward bias. WTI was at $60 at the end of May. Iran’s inability to respond and the lack of further escalation eased anxiety on the energy inflation chain.
Russian oil supply back on the market would satisfy that oil price plunge ambitions even for Core PCE since the energy bill flows into goods and services costs and can impact PCE ex-Food and Energy. Lower energy costs also bolster consumer confidence in the peak driving season and are supportive of the ag sector and in easing freight and logistics costs.
Rooting for Russian supply for the wrong reason clearly has its limitations with the fate of Ukraine a sticking point. A more material trade clash with Canada and the overt hostility shown that country by Trump would be bad for the US and Canada and bad for oil prices as the largest importer of crude with very attractive economics for US refiners. The tariff process is hopefully in the home stretch with Canada.
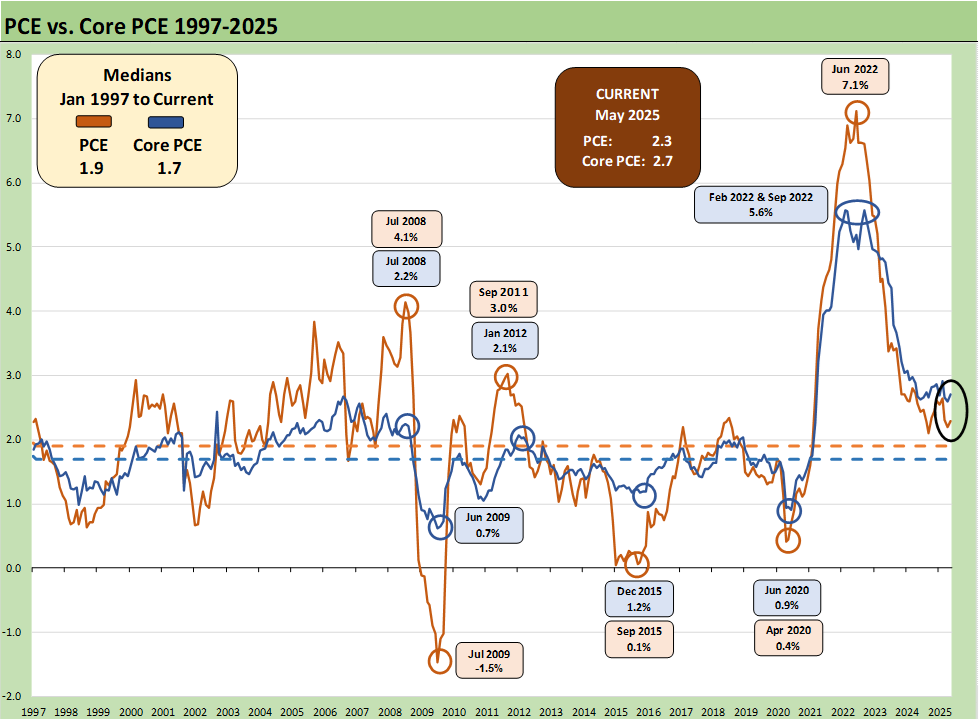
The above chart looks at a shorter timeline from 1997 to offer a better visual scale separate from the wild 1970s and 1980s. We see deflation in the post-crisis recession trough in mid-2009. We see the collapse in oil prices in late 2015 and then the COVID impact in 2020. Oil is a big headline mover whenever there is a sharp decline or spike, and we have had plenty of both.
The 1997 to current period also shows a rare period below the 2.0% PCE line and Core PCE median timeline. It took a lot to go wrong in that time horizon to cross that 2.0% threshold. The events along the way including oil crashes in late 2014 to early 2016 and a financial systemic crisis from 2008 to 2011 (including sovereign stress) to get us there. COVID was a new one for the modern capital markets.
Trump’s focus on increased demand for oil and increased supply by the US (it was already at record highs) was his Trump 2.0 election campaign pitch. His version of low oil was not tied to weaker demand and cyclical weakness from tariff damage. That weaker demand fear on global and regional cycles has hurt oil in 2025. WTO moves down around $60 WTI before the Iran military actions. A return to $60 level would call into question domestic drilling economics. Low oil does help the inflation story and is especially helpful as peak driving season in in full swing for the summer.

The above chart covers the time horizon for DPI vs. PCE from early 2022 as the tightening cycle kicked into gear after March 2022. Life in Jan 2022 was still quiet for Disposable Personal Income, and now we saw Consumption running weaker April and again in May 2025 with DPI softer as well after a good month in April.
Looking back, the 2021 period was a big macro rebound in GDP off the COVID peak period. The strong macro backdrop in 2021 and heavy dose of fiscal accommodation did not mesh well with residual supply side shortages in goods broadly as 2022 saw the end of ZIRP and a material inflation spike.
Oil was a problem after the Putin invasion of Ukraine in late Feb 2022, and inflation hit a high in June 2022 at +9.1% for CPI as a headline grabber (headline PCE at +7.1% in June 2022) before the steady inflation slide to current rates. Core PCE had dueling peaks at +5.6% for Feb 2022 and Sept 2022.
For May 2025, DPI came in negative and PCE did as well. The economists on the screen are tagging the DPI as “noisy,” but the PCE consumption lines have already seen more than a few bad indicators including the final 1Q25 GDP estimates this week (see 1Q25 GDP: Final Estimate, Consumer Fade 6-26-25). That will worsen if we see more disarray in the markets and households squeezed by tariffs. Employers and consumers will have decisions to make as the side effects of tariffs unfold. Policymakers and GOP legislators defer to Trump while consumer and corporate investors get to make up their own minds.
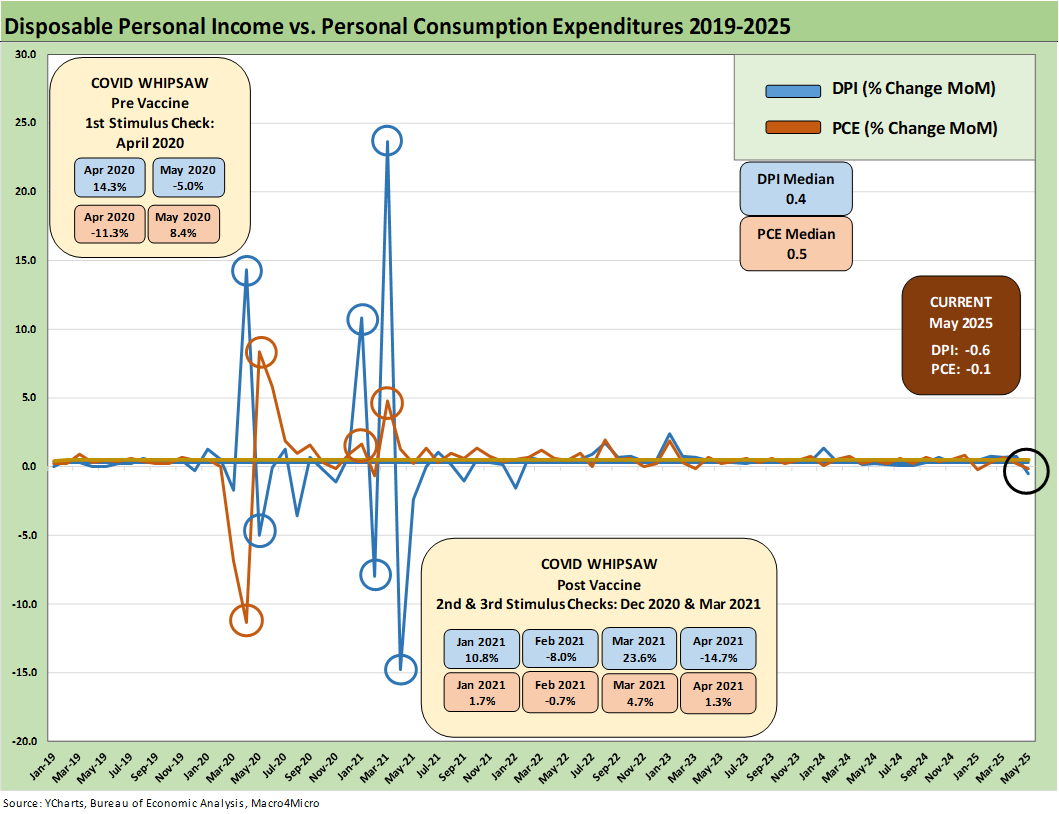
The above chart plots MoM Disposable Personal Income vs. PCE as a read on how wild things got during and right after the pandemic peak. These comments are somewhat of a replay each month with some edits and updates. This is a chart we use each month to revisit the DPI swings that came with the three COVID relief/stimulus packages. That included two under Trump and one under Biden. The most recent month of May 2025 shows both in the red.
As a reminder, Trump signed the CARES Act in March 2020 (shows up in the DPI in April 2020) and Trump also signed the Dec 2020 legislation disbursed in Jan 2021 (Trump seldom mentioned that Dec 2020 one since it was easier to blame Biden and Powell). Biden signed the America Rescue Plan (disbursed in March 2021) that was a demand pile-on (we would argue over the top) in a supply constrained environment (thus inflation). The DPI and PCE wave tied to each of those shows up in the chart above.
The vaccine was announced in early Nov 2020 just ahead of two stimulus actions. That was soon to be a factor in PCE patterns and lag effects. The quarterly GDP numbers in 2021 on the post-COVID bounce were numbers generally not seen since the Reagan and Clinton years (see Presidential GDP Dance Off: Clinton vs. Trump 7-27-24, Presidential GDP Dance Off: Reagan vs. Trump 7-27-24).
COVID was a distinct period for supply chains and supply-demand imbalances. With tariffs and potential trade wars, it will be important to look for similar imbalances whether in narrow product categories or in broad commodities and materials areas. Jacking up aluminum, steel, and seeking even more tariffs on lumber and new tariffs on copper is not a great idea for keeping prices and costs contained. Auto tariffs in Section 232are now very extreme and could go higher. We saw semis, pharma, and aircraft/engines/parts added to the Section 232 pipeline.
Supply-demand factors are timeless in significance. Washington spends too much time not discussing how supply and demand fits into their plans (since it usually does not). Dislocations that were underway in shipping and freight can cause many unintended consequences (all bad for consumers). The recent China battle offered a reminder.
The typical political game in the 2024 election was to concentrate inflation cause-and-effect on the March 2021 disbursement highlighted in the chart above. The idea is that a single stimulus plan signed by Biden in early 2021 was the cause of all inflation. That is a another case of “dumbassery” in the Washington tradition. We see it on both sides of the aisle across the decades, but that was an especially dumb sales pitch from the “politically axed.” That Biden plan certainly made things worse from the demand side. The invasion of Ukraine by Russia in Feb 2022 also drove the ensuing spike in inflation to a June 2022 CPI high of 9.1%. That invasion was caused by Putin, who seldom gets mentioned by policy architects as they consider what went wrong in 2022.

The above table plots the monthly Disposable Personal Income MoM change numbers vs. the Personal Consumptions Expenditures numbers across the years from 2019 through May 2025. It is an easy scan across key time periods for a look at turning points in DPI (e.g. stimulus payments) or PCE.
One exercise to do from time to time is to look at Table 1 in the monthly “PCE release” for the granular dollar amount on each line. While this month’s personal income is bad news (see line 32 for the DPI total), the line items can show some volatility. We like to look for gaps between DPI and PCE. This month they both contracted
Any reader of Table 1 can simply tick off which lines might come under pressure in coming weeks with tariffs including expense lines such as Medicaid or durable goods that face tariffs. The budget bill with the tax cuts and offsets are all over the screen every day, but it is always worth remembering that a tariff is a regressive tax that hits lower income consumers harder. The same is true in Medicaid costs based on the income brackets of Medicaid users.
Legislators can vote with their party, but the tariff facts are the “buyer pays” or exactly and literally “the buyer writes the check.” Try to get the White House to admit that basic fact. The simple math is the proportionate impact of tariffs and many basic service costs fall harder on lower income households. The “buyer pays” reality is a legislated fact and the “regressive tax” label is elementary school long division. The response from many to these facts tends to be “don’t get rational or factual, get angry, get louder, and deny facts.”

The savings rate numbers May decline to 4.5% from a recent high of +4.9% in April, which as up from the Dec 2024 lows of +3.5% before moving up into the 4% handle range for each month to date in 2024.
We have looked at the savings rates issues across the cycles in past commentaries (see Savings Rates: Context Across the Cycles 10-27-23). We have seen waves of restatements but they are useful in gauging consumer trends. Rising savings rates are often consistent with a more defensive consumer, and we have seen ample evidence of that in “soft economic releases” such as surveys. We also heard plenty of empirical evidence on earnings calls including some very mixed retail earnings in recent days. Homebuilders are also feeling the pressure (see links at bottom).
The sharply revised savings rates since last month leaves saving rates low vs. the median of 6.9% but high vs. recent months. We have looked at the savings rate dynamics in earlier commentaries (see Savings Rates: Context Across the Cycles 10-27-23). Savings rates peak in times of worry (occasionally panic) as evident in the chart above. The period leading into May 1975 was no picnic while Nov 1981 and Dec 1992 had a raft of issues.
Sometimes there are anomalies during expansions such as in 1987 when the oil patch had basically crashed starting in 1986. Regional stress was high, and banks and thrifts were failing. People had to draw down savings or they saved to weather the storm. COVID and the various stimulus actions had a distorting effect on the numbers as well. The exercise is one of looking at the numbers and seeking out trend lines across the income and outlays disclosure.
Adjustments to income at the industry levels or stress in major regions can move multiple lines in what is a derived number. Radical adjustments to transfer payments tied to political tides (like the attack on Medicaid in recent legislation) could strain these numbers in 2025. The same variability is true for income lines as more workers get deported and cyclical conditions could lead to payroll pressure.
There are always multiplier effects and layers. Tariffs are not just about a border tax to pad the revenue line. The tariffs have great significance for household budgets and corporate revenues costs and budgets. That tariff impact could spill into cost-cutting actions and capital budget pauses. That is when the rule of “one man’s capex is another man’s revenue” spills into “one man’s expense line reaction is another man’s inflation” (or job loss).
See also:
Durable Goods May25: Aircraft Surge, Core Orders Modest Positive 6-26-25
1Q25 GDP: Final Estimate, Consumer Fade 6-26-25
New Home Sales May 2025: Slip and Slide 6-25-25
KB Home 2Q25: Negative Industry Trends Keep Coming 6-25-25
Existing Homes Sales May 2025: Sequential Stronger, YoY Weaker 6-23-25
Footnotes & Flashbacks: Credit Markets 6-23-2025
Footnotes & Flashbacks: State of Yields 6-22-2025
Footnotes & Flashbacks: Asset Returns 6-22-2025
Mini Market Lookback: FOMC Spoke Clearly, Iran and Trump up next 6-21-25
Lennar 2Q25: Bellwether Blues 6-20-25
FOMC Day: PCE Outlook Negative, GDP Expectations Grim 6-18-25
Home Starts May 2025: The Fade Continues 6-18-25
May 2025 Industrial Production: Motor Vehicle Cushion? 6-17-25
Retail Sales May 25: Demand Sugar Crash 6-17-25
Mini Market Lookback: Deus Vult or Deus Nobis Auxilium 6-14-25
Credit Snapshot: Hertz Global Holdings 6-12-23
CPI May 2025: The Slow Tariff Policy Grind 6-11-25
Mini Market Lookback: Clash of the Titans 6-7-25
Payrolls May 2025: Into the Weeds 6-6-25
Employment May 2025: We’re Not There Yet 6-6-25
US Trade in Goods April 2025: Imports Be Damned 6-5-25
Past-Prologue Perspective for 2025: Memory Lane 2018 6-5-25