
New Home Sales June 2025: Mixed Bag
New home sales data kept the negative YoY variances despite the minimal sequential increase in June from May.


In a week with a slew of major homebuilders reporting earnings, the fundamental macro backdrop for new single family homes has kept a negative bias intact for 2H25 trend lines as peak selling/moving season winds down in the summer.
June saw weaker YoY sales (-6.6%) despite the slight uptick sequentially from May (+0.6%) as the South (62% of total sales) moved higher in June after its steep plunge during May. The West as #2 region (21% of sales) dropped by -8.4% sequentially and -14.4% YoY.
The median price level took a plunge to the lowest since Nov 2024 and the second lowest median price level since ZIRP ended and the tightening cycle began.
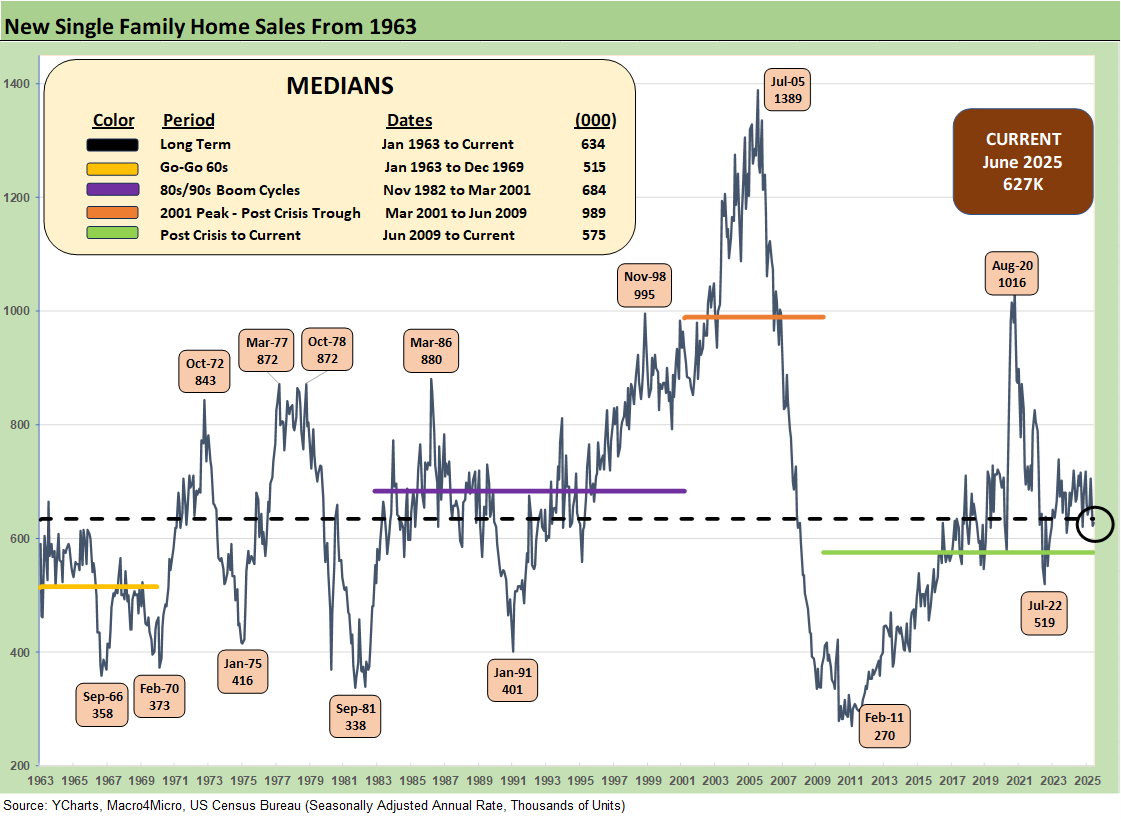
The above chart updates the new single family sales time series from 1963, and the current 627K is a small sequential move higher of +0.6% for June after a big move lower in May. May declines were driven by a sharp move lower of -15.1% in the South region. The South in June comprises 62% of sales and thus wags the headline number. We look at regional moves in separate charts further below.
The earnings season for homebuilders is in full swing this week, and guidance has been biased toward sustained weakness as the peak home sales season wraps in the 3Q25 period. More of the tariff and UST curve risks will play out in the fall with the expected easing to begin in Sept with the fall FOMC meeting activity. The #1 homebuilder (by units) is D.R. Horton (see D.R. Horton 3Q25: Material Slowdown Still Good Enough 7-22-25) with DHI and the #3 player Pulte (see PulteGroup 2Q25: Still-Lofty Margins see a Mild Fade 7-23-25) releasing earnings numbers and guidance this past week with numerous other June reporting companies weighing in this week as well (e.g., NVR, TMHC, MTH, CCS, MHO).
Homebuilder equities among the major national players generally have reacted well over the short term to the earnings wave this week with D.R. Horton’s numbers sending stocks flying as an industry bellwether. That bounce the past week needs context since the reaction was relative to expectations and beaten-down valuations across 4Q24 and YTD 2025.
The takeaway from the earnings reports so far is the macro direction is still negative with the releases showing lower orders overall, some signs of gross margin weakness, and talk of adjustments to land spend. Other concerns include tariff cost impacts ahead on material costs directly as well as consumer sector worries on weak confidence.
The talk of UST curve steepening risk is a hot topic under fallout scenarios from the “Fed vs. Trump” clash. We cover those topics in our homebuilder commentaries and yield curve macro work (see Footnotes & Flashbacks: State of Yields 7-20-25).
The continued tariff noise has seen the shock value easing as the tariff numbers started out as “hideous” before slowly migrating to “very bad.” High tariffs under Section 232 for pharma, semis, aircraft/parts, and lumber are still ahead. Confusion around what the final tariffs will look like in % terms for trade partners is slowly getting resolved, but the downstream impact has been murky at best and policy discussions often depart from basic facts. Tariffs are still rolling out in a sea of partisan disinformation.
The “economics of the consumer” and how cash tariffs (paid at customs by the buyer) will roll into corporate earnings and/or goods pricing will just have to play out with so much noise saying 180-degree opposites (whether facts or opinions). The dismal science of economics will have its way on the end as cash costs and related side effects flow into the various industry and product ecosystems.
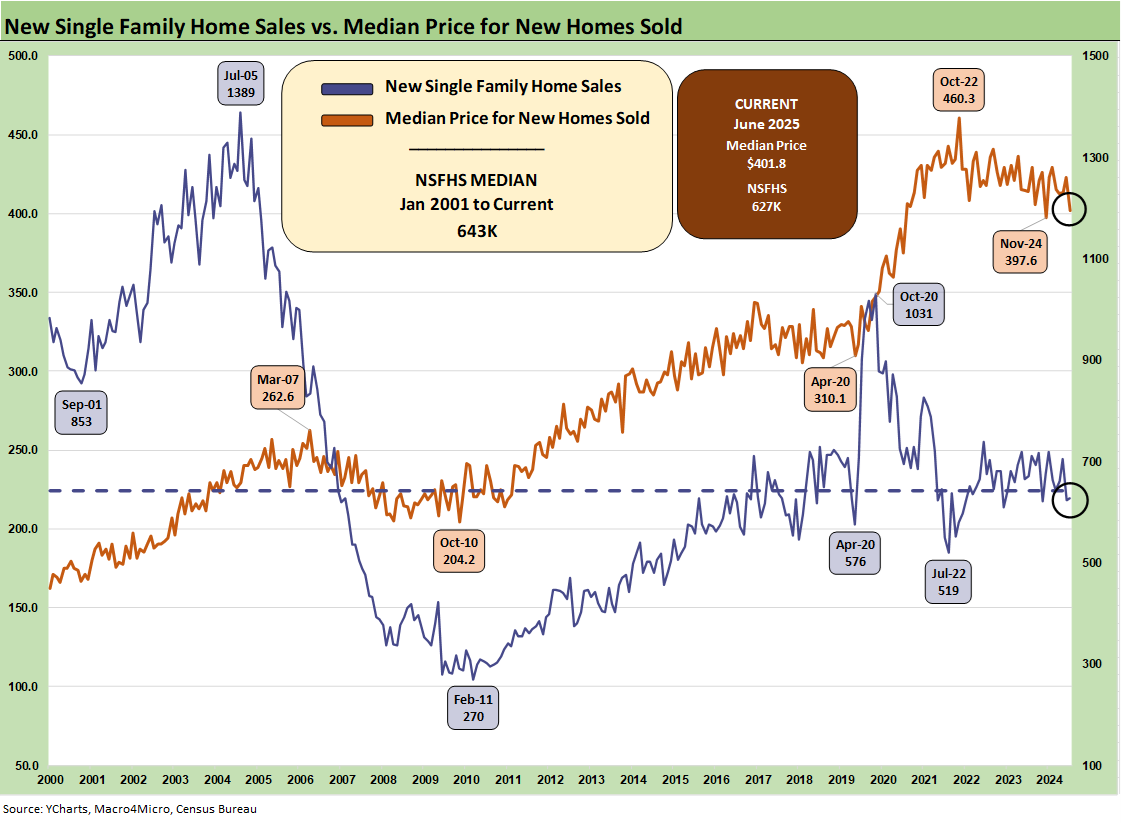
The above two-sided chart shows the sales pattern for the new home sales line since 2000 vs. the median prices, which weighed in at just under $402K for June, down from $422.7K in May. The fact that prices had trended materially higher across the post-COVID cycle is old news, but the sensitivity of monthly payments is married more to mortgage rates, which remains a critical variable in monthly payments and are stubbornly high at just over 6.7% for Freddie Mac 30Y as updated today (each Thursday at noon the benchmark is updated). Mortgage rates remain the primary driver of weaker volumes in the lower price tiers in both new and existing home sales (see Existing Home Sales June 2025: The Math Still Doesn’t Work 7-23-25).
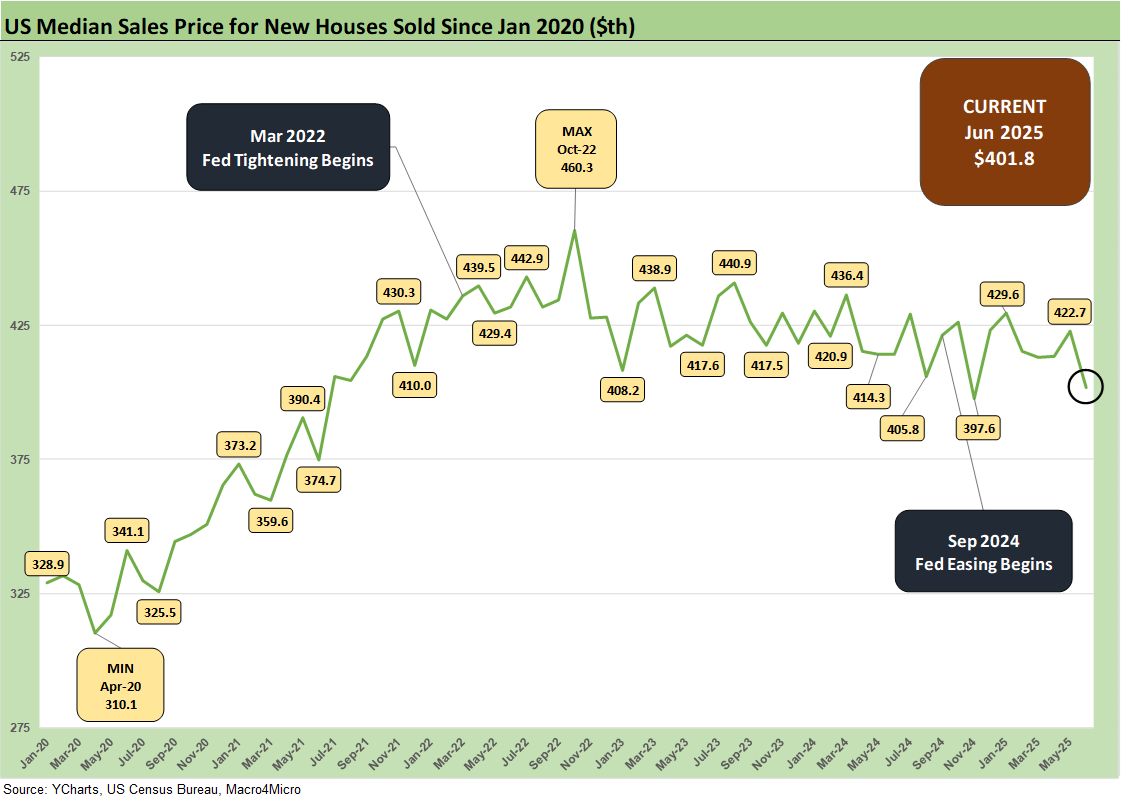
For the sweet spot in the mid-price tiers, the combination of lower prices and in some cases sustained incentives is part of a pattern of gross margin erosion into 2025. Each builder has distinctive geographic mix shifts to consider when framing ASP trends. We look at a number of those trends in our single name coverage (see links at the bottom). The current $401.8K is below the calendar 2024 median of $420.3K and 2023 median of $428.6K.
While prices always come with a very big asterisk of regional mix and product tier shifts, we are starting to get more color from builders on the mixed challenges of cost creep and the sustained need to discount prices or offer incentives. That means margin squeeze. We are seeing numerous major builders post declining orders and lower backlogs in earnings reports. The “pace vs. price” topic has been hot again and will stay hot.
We also hear more often that the mortgage buydowns don’t work as well as they used to even when the market was seeing higher mortgage rates. Consumers are doing more than monthly payment math as sentiment weighs in. The 200-bps range of 30Y mortgage rates since the fall 2023 period shifted the relative focus to increase “specs” inventory strategies during 2024 and into 2025, but some builders are gradually pulling back on that mix in a sign of cyclical defensiveness.
The above chart updates the running median price trends. Builder fears of higher materials and supplier chain costs are not going to do much to relieve homebuilders in their pricing strategies with gross margins softening in 2025. That said, most are posting margins still above pre-COVID levels even if down sharply from abnormal margin peaks in 2022. The word “normalization” shows up more lately, but there are also ample cyclical reasons for prices to react to weaker demand.
The builders need to frame how they can get into a gross margin zone that works, and they know that the expectation of costs can get wagged meaningfully by tariffs. The NAHB has put out some numbers for the average home cost from recent tariffs (over $9K per average home). We have commented on the NAHB view on tariff distortions in the past. They will be very busy in coming months sorting out what is next subject to lumber and materials tariffs heading into the later stages of 2025. Some of the earnings commentary indicated that the builders do not expect full tariff impact until late 2025 and then into 2026 numbers for the next peak season pricing strategies.
Lumber is in the Section 232 process with duties already quite high with brutal (and rising) tariffs on Canada. The same is true for Mexico on its tariffs including building-related supplies such as gypsum. The NAHB published an updated commentary on tariffs recently (see NAHB: How Tariffs Impact the Home Building Industry March 2025, NAHB Members Cite Impact of Tariff Uncertainty on Home Building 5-22-25). That news was not good.
The homebuilders downplay the problem on earnings calls and let the NAHB trade group do their talking for them. The bottom line is lumber, material, appliances, etc., will bring lower margins or higher prices (adjusted for mix) or both.
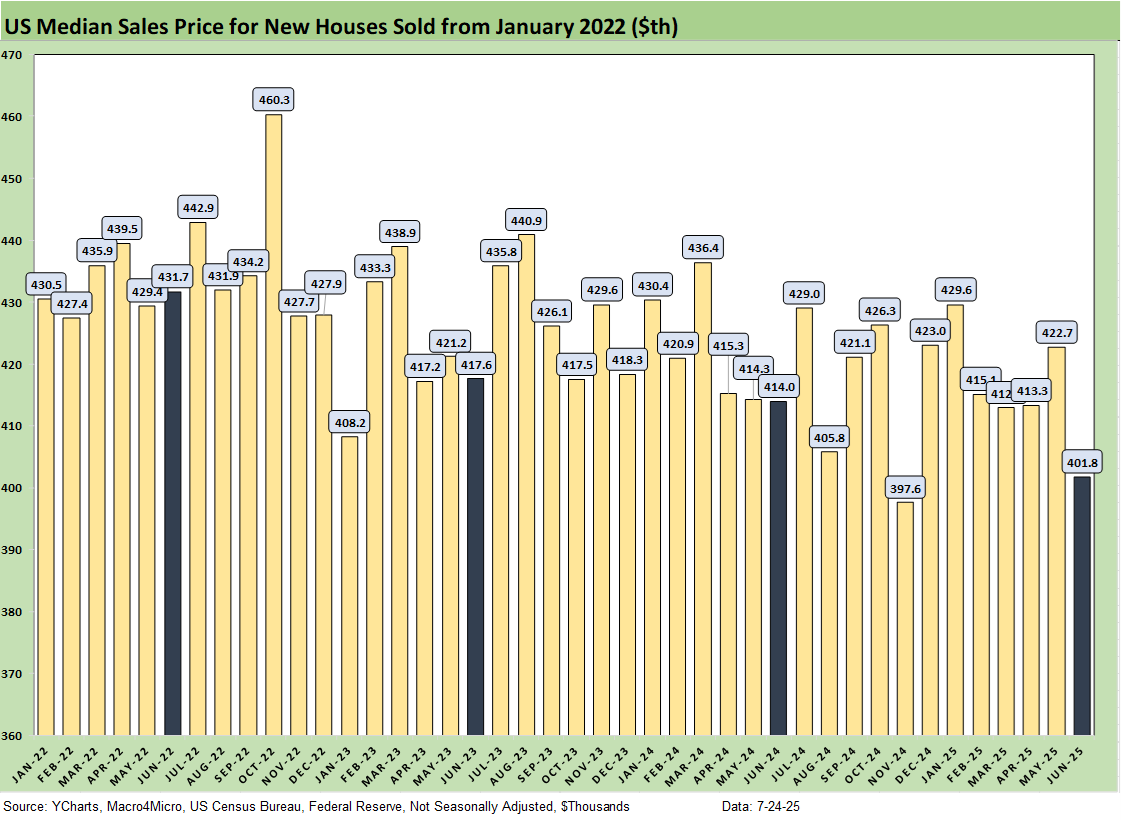
The above chart gives a different visual angle on the median home prices from early 2022. That is a lot of $400K handles with one sub-$400K outlier in Nov 2024. The current $401.8K is the lowest in 7 months and the second lowest in the chart above from Jan 2022 (3.5 years).
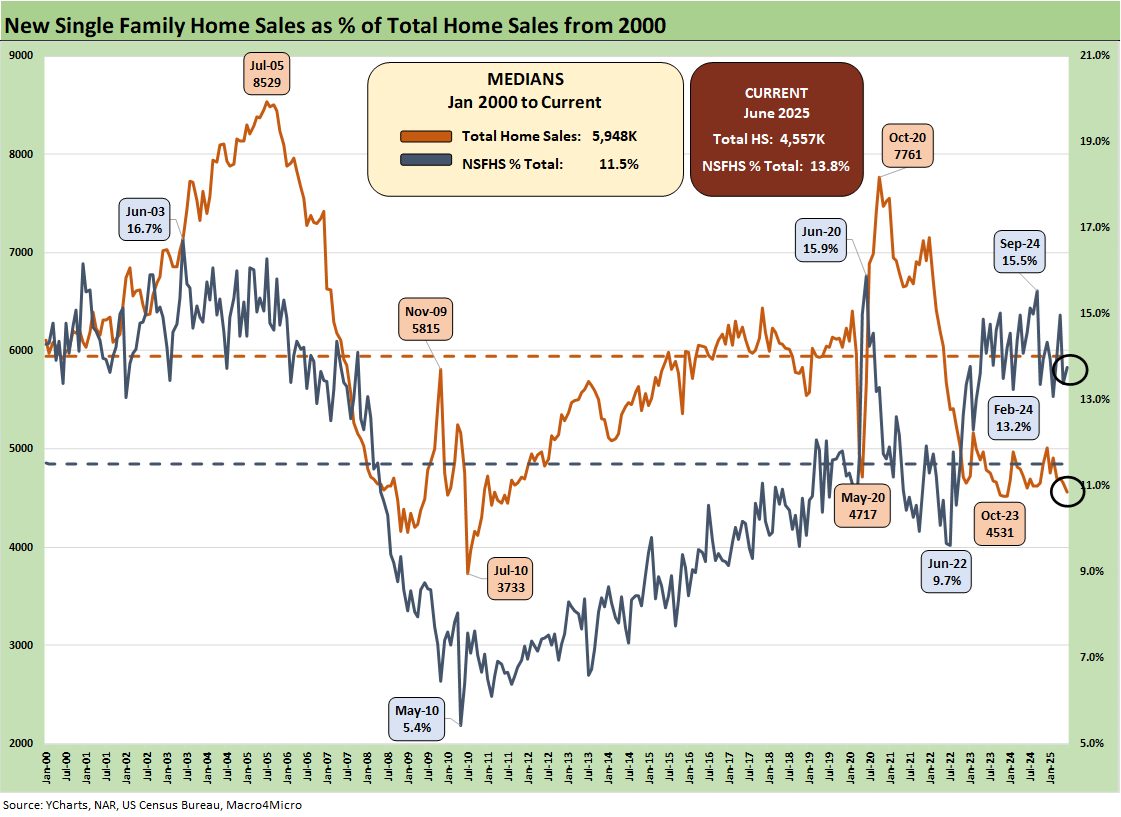
The above chart updates the share of total home sales captured by new homes given the constraints on existing home sales. Existing home sales totals always dominate the total home sales number (historically closer to 90%) but have been reeled in this cycle on the “golden handcuff” challenge with so many sub-3% and sub-4% mortgages in a market where high 6% and low 7% are on the other side of a home sale when the buyer looks to move up or downsize. That means monthly payment pressures. For June 2025, new home sales captured 13.8% of total home sales vs. the long-term median of 11.5%.
The focus on mortgage rate headwinds has been a feature of the post-tightening cycle demand trend as volatility in long rates since later 2023 made home closing and delivery schedules tight and a factor in inventory planning. “Move-in ready” or “within 60 days of move-in ready” became a part of working capital management. Even a luxury player such as Toll gave that factor more consideration. The summer “inflation watch” and sustained focus on steepening risk will keep this topic alive.
For those thinking a Fed easing move will solve the mortgage rate problem, just look back at the fall easing of 100 basis points and what has ensued since then. The market saw 6% area mortgages in Sept and early Oct on the initial rally, but the steeping move soon kicked in with a vengeance. Record borrowing needs, record supply, and the worst performance of the dollar since the 1970s all factor into the supply demand equation.
The unpredictability for offshore investors is a material risk factor if inflation does not work out as the tariff architects are pitching. Assuming the sellers (trade partners) will eat 100% of the costs through price cuts to offset the cash tariffs paid by the buyers is very, very optimistic (aka idiotic). Anyone trolling around the small business trade group websites, retailer trade groups, or such well known groups as the Chamber of Commerce or National Association of Manufacturers can help sort out fact from fiction on how hard tariffs have hit small businesses. This has not been getting enough attention, but will be soon.
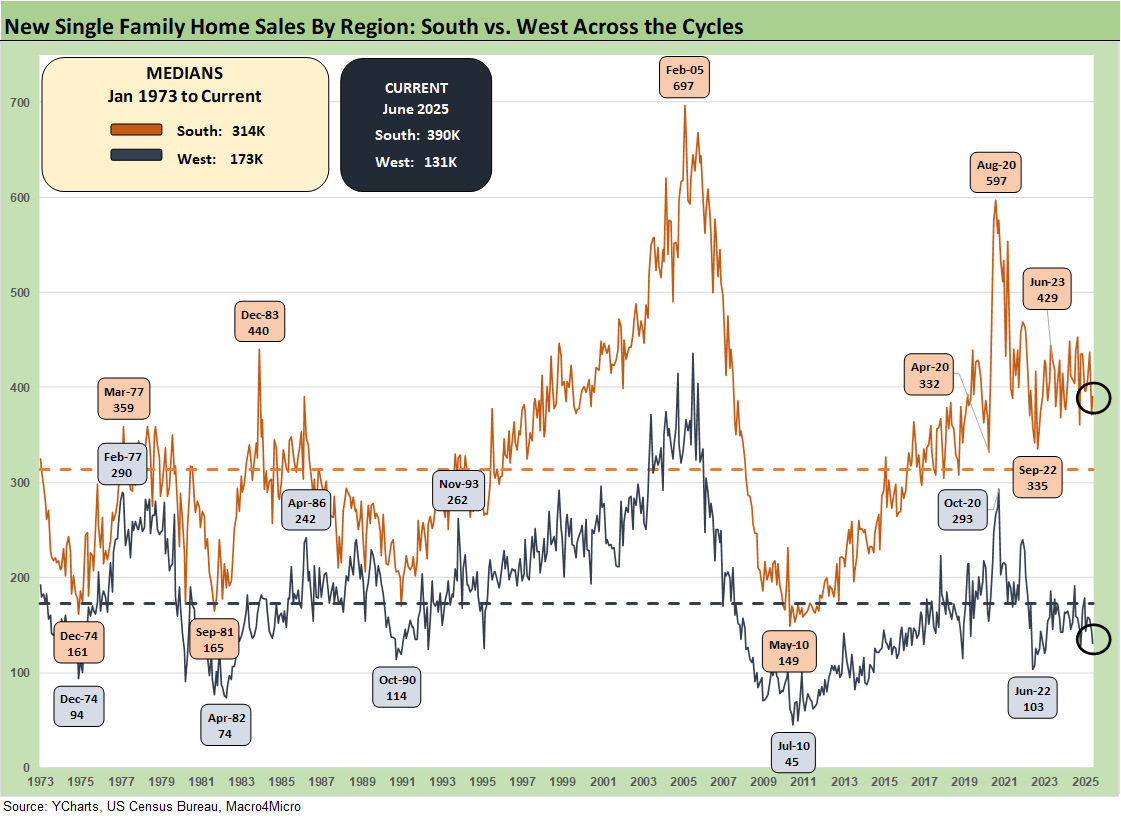
The time series above updates the new single family home sales across the cycles since 1973 for the #1 and #2 regions of the South and the West. The 390K for the South is around 62% of the total of all single family new home sales (SAAR) and marks a sharp sequential rise of +5.1% from May and down by -4.4% YoY. The West at 132K is 21% of the total. For the month, the West was -8.4% sequentially and -14.4% YoY.
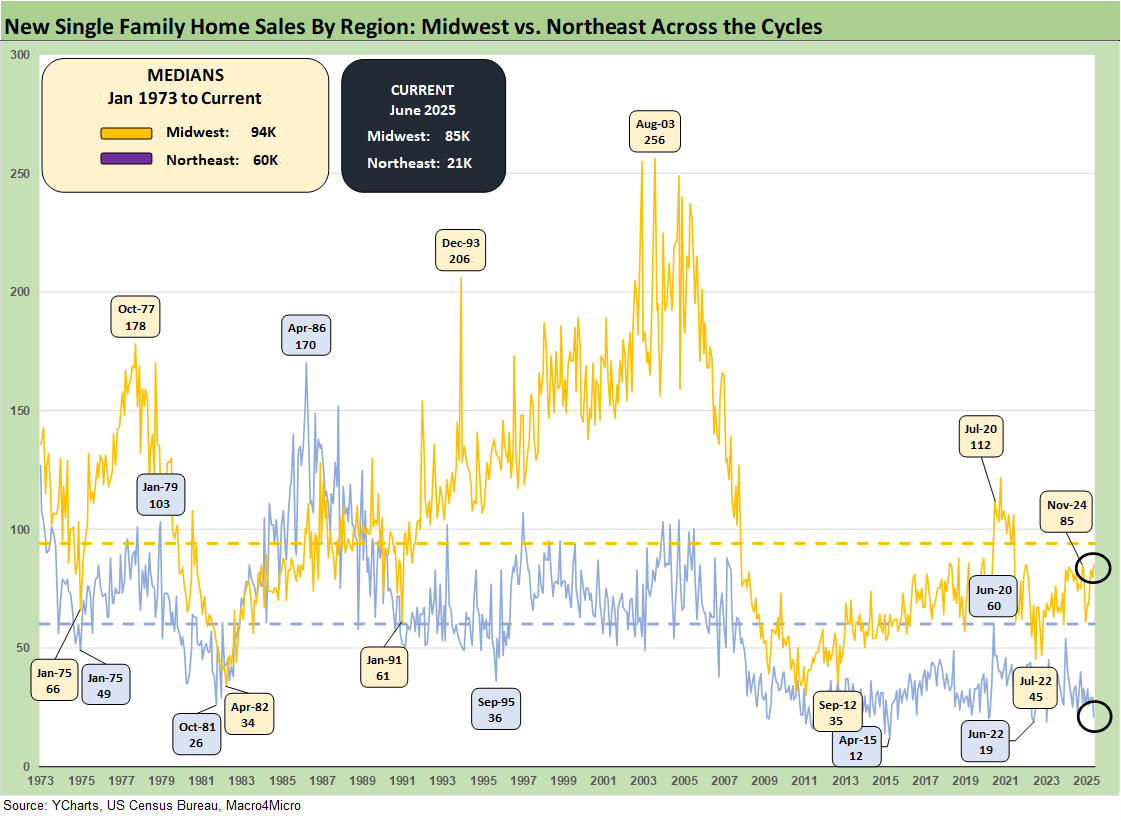
The timeline for new home sales for the smaller Midwest and much smaller Northeast market is detailed above. The Midwest (over 14% of total) was +6.3% sequentially and +9.0% YoY. The Northeast market (3% of total) was -27.6% sequentially and -34.4% YoY.
Housing sector:
Existing Home Sales June 2025: The Math Still Doesn’t Work 7-23-25
Housing Starts June 2025: Single Family Slips, Multifamily Bounces 7-18-25
New Home Sales May 2025: Slip and Slide 6-25-25
Homebuilders:
PulteGroup 2Q25: Still-Lofty Margins see a Mild Fade 7-23-25
D.R. Horton 3Q25: Material Slowdown Still Good Enough 7-22-25
KB Home 2Q25: Negative Industry Trends Keep Coming 6-25-25
Lennar 2Q25: Bellwether Blues 6-20-25
Credit Snapshot: Meritage Homes (MTH) 5-30-25
Homebuilder Rankings: Volumes, Market Caps, ASPs 5-28-25
Credit Snapshot: PulteGroup (PHM) 5-7-25
Credit Snapshot: Toll Brothers 5-5-25
Credit Snapshot: D.R. Horton (DHI) 4-28-25
Credit Snapshot: Lennar (LEN) 4-15-25
Credit Snapshot: Taylor Morrison Home Corp (TMHC) 4-2-25
Lennar: Cash Flow and Balance Sheet > Gross Margins 3-24-25
KB Home 1Q25: The Consumer Theme Piles On 3-25-25
Toll Brothers 1Q25: Performing with a Net 2-20-25
Credit Crib Note: Lennar Corp (LEN) 1-30-25
D.R. Horton: #1 Homebuilder as a Sector Proxy 1-28-25
KB Home 4Q24: Strong Finish Despite Mortgage Rates 1-14-25
See also:
Credit Snapshot: Ashtead Group 7-21-25
Footnotes & Flashbacks: Credit Markets 7-21-25
Footnotes & Flashbacks: State of Yields 7-20-25
Footnotes & Flashbacks: Asset Returns 7-20-25
Mini Market Lookback: Macro Muddle, Political Spin 7-19-25
Retail Sales Jun25: Staying Afloat 7-17-25
June 2025 Industrial Production: 2Q25 Growth, June Steady 7-16-25
CPI June 2025: Slow Flowthrough but Starting 7-15-25
Mini Market Lookback: Tariffs Run Amok, Part Deux 7-12-25
Mini Market Lookback: Bracing for Tariff Impact 7-5-25
Payrolls June 2025: Into the Weeds 7-3-25
Employment June 2025: A State and Local World 7-3-25
Asset Return Quilts for 2H24/1H25 7-1-25
JOLTS May 2025: Job Openings vs. Filling Openings 7-1-25
Midyear Excess Returns: Too little or just not losing? 7-1-25