
Mini Market Lookback: Mixed Week Behind, Big Week Coming
A wave of macro headlines (FOMC, 2Q25 GDP, PCE inflation, Income and Outlays, JOLTS/Payrolls) and more bellwether earnings are on the way.


Works for the Marines, but maybe not for sound trade policy.
Earnings season has been reassuring overall across numerous bellwether industry groups in countering more bearish scenarios. So far, the macro and micro story lines have offered evidence to support those who see a cyclical cushion still in place for 2025 (we do also), but there are ample signs of slowing demand in numerous subsectors and evidence of tariff costs hitting expense lines (after all, the buyer pays) and some major consumer markets. This week brings earnings from 4 of the Mag 7 (MSFT, META, AAPL, AMZN) so that always makes for headlines.
While Trump struck a murky, somewhat opaque trade “deal” with Japan, tensions remain high with the EU, Canada, and Mexico. The small business sector and retailers are getting hit the hardest by tariffs, and the worst lies ahead with next week bringing the Aug 1 target date. More working capital cycles are gradually reflecting the effective dates of the tariff outlays in the inventory costs, and the Section 232 pipeline is just getting warmed up (pharma, semis, aircraft/parts, lumber).
Housing was very busy the past week in macro releases and single name earnings reports. The basic trend was lower closings (not for all), lower orders and a gradual slowdown and demand weakness showing up in lower gross margins. Meanwhile, auto earnings are just getting warmed up, and the tariff chaos was very much in evidence in GMs earnings commentary and earlier in the Stellantis pre-release. STLA and Ford will have full earnings releases and commentary teed up for this week. We also will see Aptiv and BorgWarner in the queue among larger suppliers after Lear reported this past week.
This week will mix disinformation with the usual wave of partisan toxicity as the FOMC weighs in, but the week will also see the advance estimate for 2Q25 GDP, which should shed more light on consumer and corporate investment trends. We also get June PCE inflation data and consumer Income and Outlays along with JOLTS, the Employment Cost Index, and the full Payroll numbers.
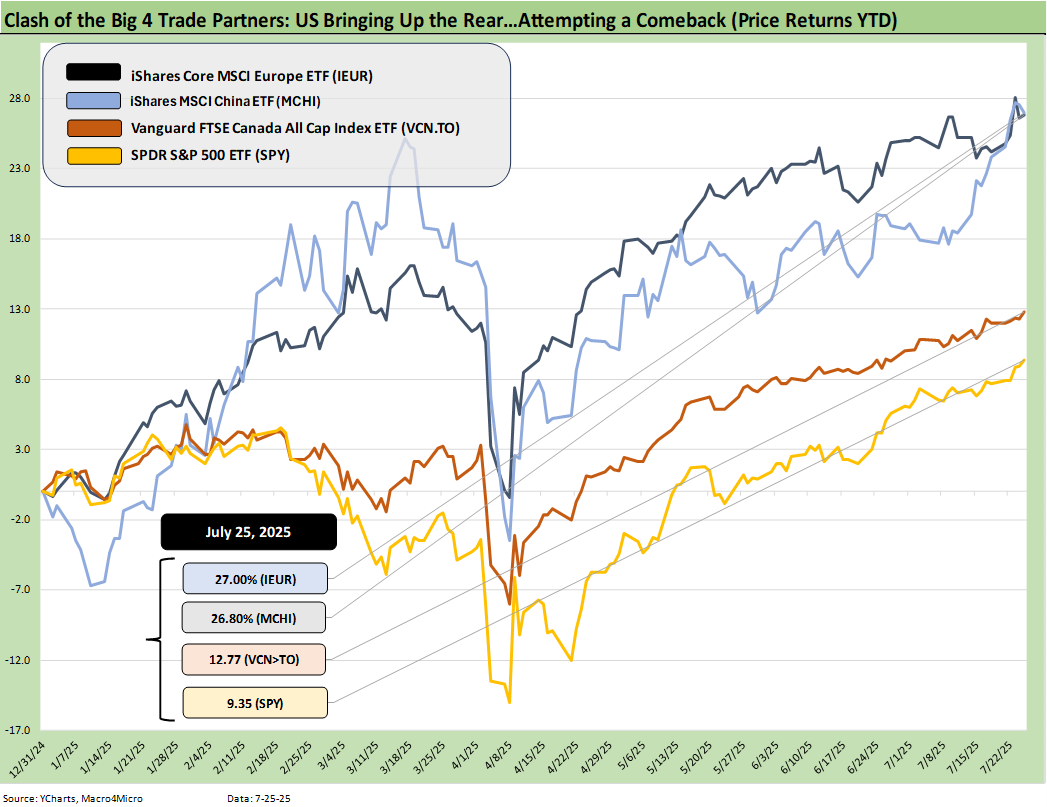
The above is our weekly update of the “Clash of the Big 4 Trade Partners” using a selection of their equity benchmarks and broad market ETFs. We use the S&P 500 for the US, and the SPY ETF is still in last place behind Europe, China, and Canada. The Golden Age had to change a flat tire, so the tradeoff of tariffs and tax stimulus will face a test in 2H25.
Tariffs are slowly starting to roll into transactions while there are many more to come and many just going into effect in coming days. It has been strange to see some people acting like the economic effects are already decided. It is a tribute to disinformation (and lies) and gullibility. The effects can only play out over months. They are determined by working capital cycles, the pricing strategies of the import buyer, the ability to effect price increases or take out costs, currency rates issues, and a long trail of effects and decisions from there.
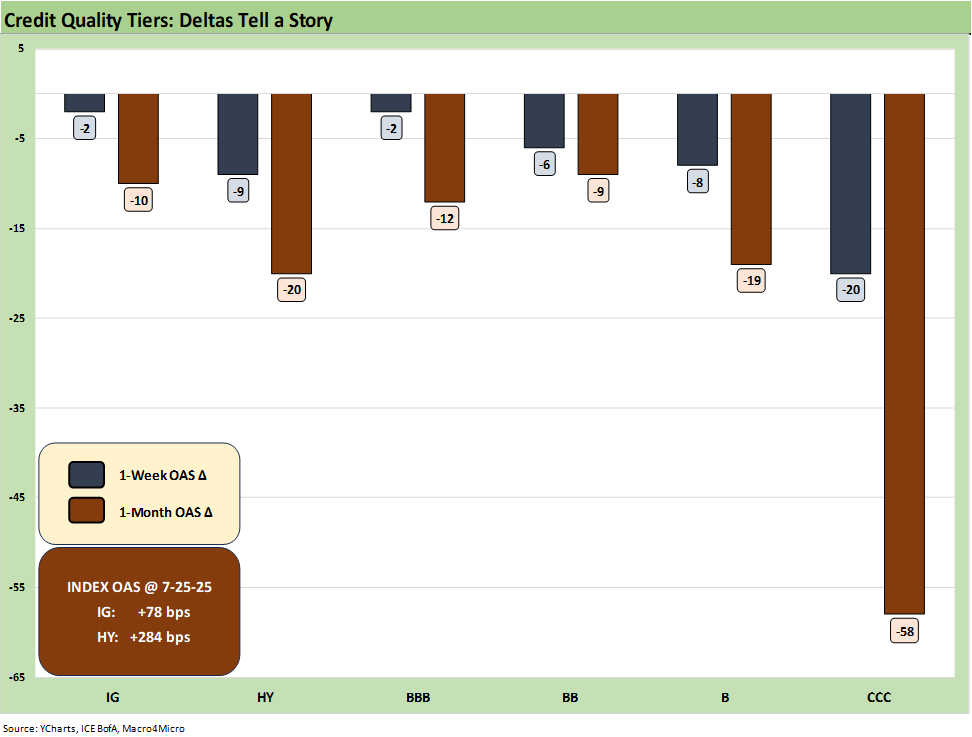
The IG and HY spread deltas are broken out above for the 1-week and 1-month time horizon. We also look at the credit tiers from BBB to CCC. We look in more detail at the credit spread action in a separate “Footnotes” commentary on Credit Markets. We will post the update on Monday. The recent trend line has been impressive in the rally from the post-Liberation Day panic. IG index OAS is near the lows of past credit cycle peaks and HY OAS is again in the June 2007 zone of the credit bubble.
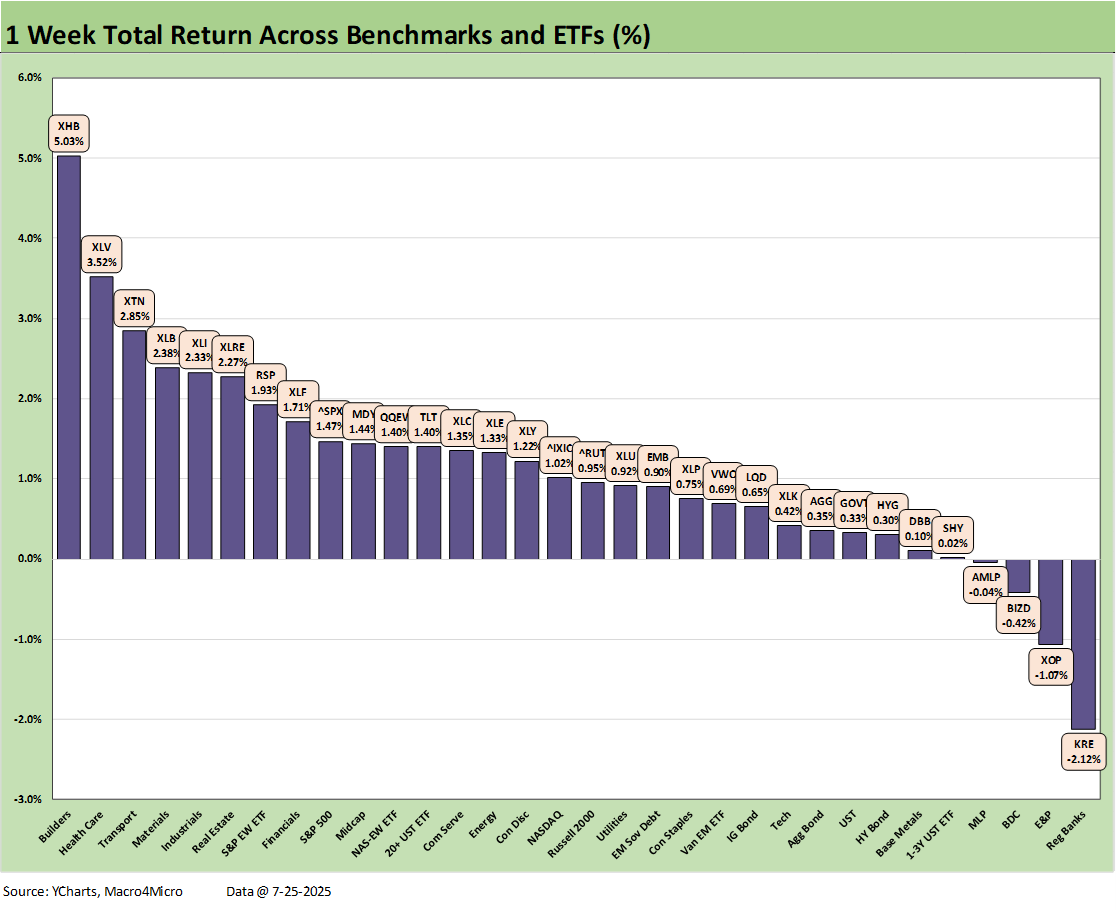
The 1-week returns across our 32 benchmarks and ETFs posted a score of 28-4 in a week when the S&P 500 and NASDAQ hit highs again. The S&P 500 saw 10 of 11 sectors rise with one flat (Consumer Discretionary). The most interesting move on the week was the rally in homebuilders that started right away with the D.R. Horton earnings release as the beaten down valuations in the Homebuilder ETF (XHB) got a reminder that the margin erosion is manageable and the free cash flow very healthy. The yield curve deltas (see separate chart below) were mixed but all the bond ETFs stayed in a positive return range with longer UST rates biased lower.
We see some of the 2025 out-of-favor ETFs such as Homebuilders (XHB), Health Care (XLV) and Transports (XTN) holding down the top 3 spots above. We note an interesting split between the large cap Financials ETF (XLF) in the top quartile and Regional Banks (KRE) in dead last as a slew of “SMid” regional banks reported this past week.
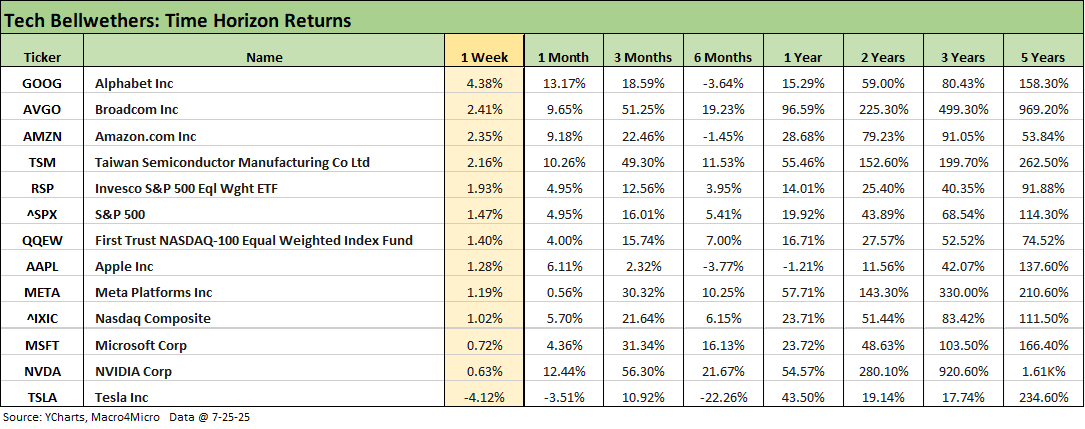
The tech bellwethers are heading for a busy week ahead with 4 more Mag 7 reporting this week (MSFT, META, AAPL, AMZN). The ETFs led by Mag 7 issuer concentration (XLC, XLY, XLK) did not make the top quartile of our 32 asset lines this week while the NASDAQ was near the bottom of the second quartile and the Equal Weight NASDAQ 100 ETF (QQEW) also resided in that quartile.
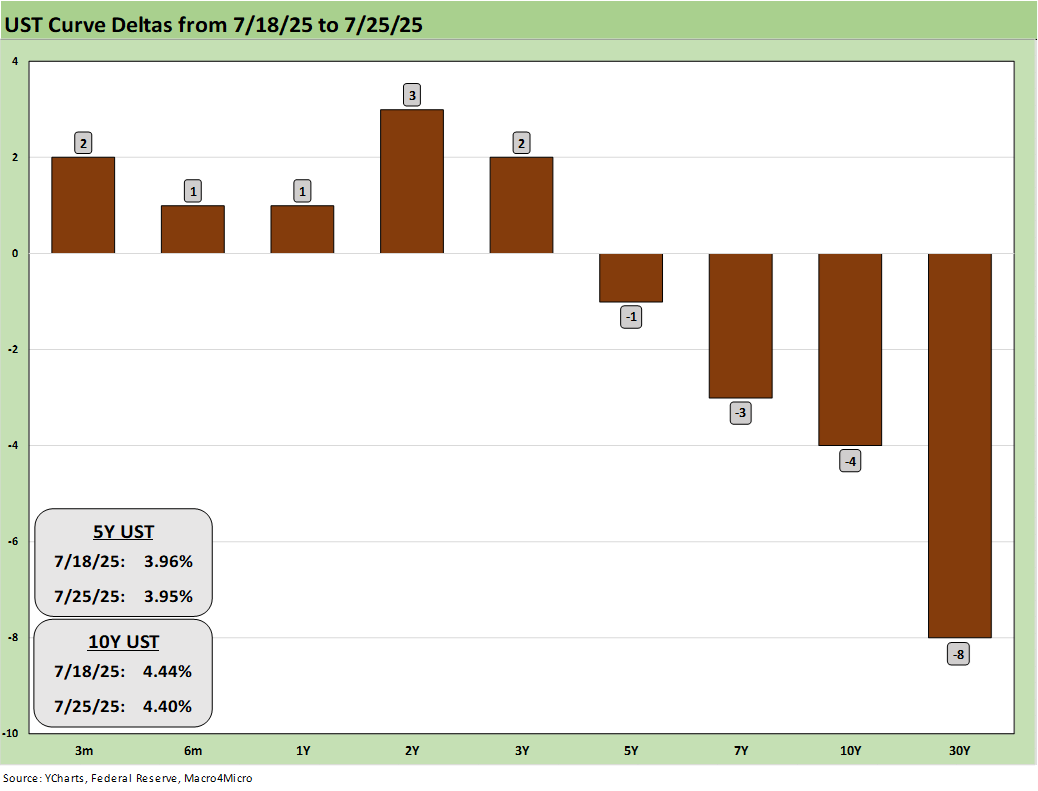
The above chart updates the UST deltas for the week with a modest bull flattener in low gear but with muted moves that still left all 7 bond ETFs with positive returns for the week with the long duration UST ETF (TLT) the winner of those 7 ETFs.
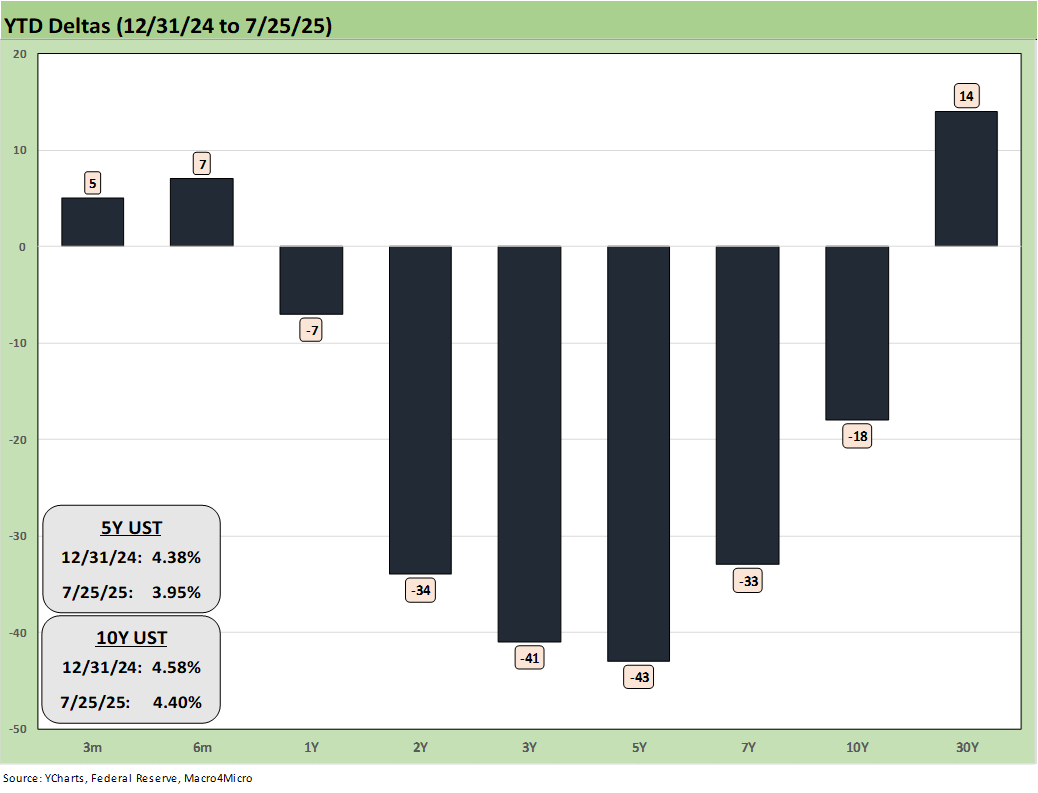
The above chart updates the UST deltas for the YTD 2025 with only the 30Y UST fighting the trends lower as seen in the short to intermediate part of the curve. The bull steepener kept the bond ETFs in positive range with a healthy assist in credit markets from spread compression. We will look at those time horizon returns separately in our Footnotes publication on asset returns to be published later this weekend.
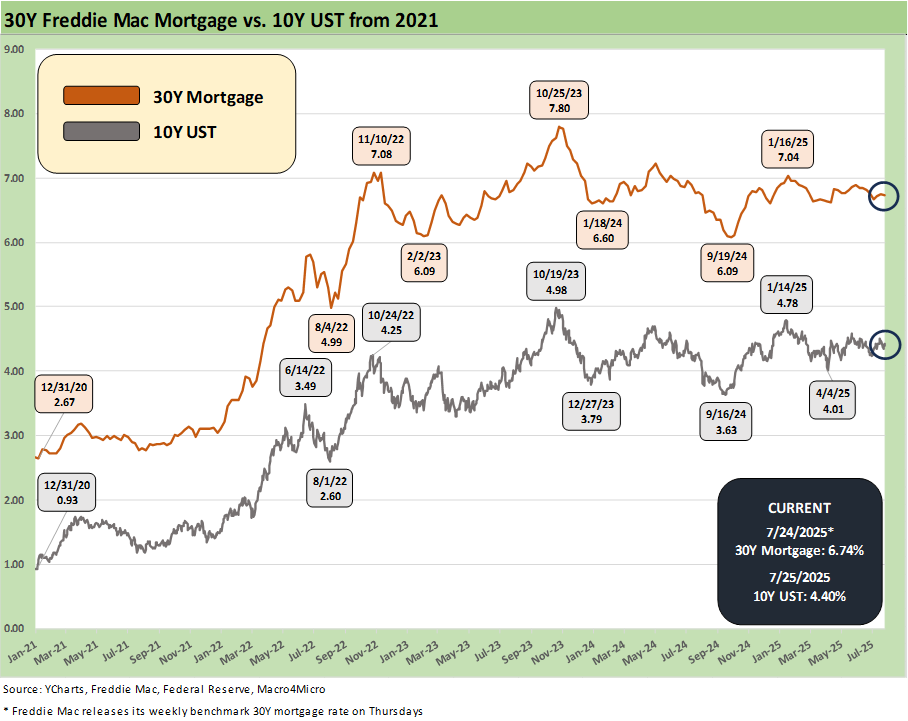
The above time series updates the 10Y UST vs. the Freddie Mac 30Y, and we still see the stubborn upper 6% range in place on the 30Y mortgage after the Freddie Mac benchmark was near 6.0% in Sept and early Oct 2024.
That earlier steepener in the face of easing offers a reminder that Fed easing (100 bps across 3 actions to wind down 2024) does not set the shape and slope of the yield curve. Thet gets back to the supply-demand balance for record UST supply, inflation anxiety, the direction of the dollar, and confidence in fiscal governance.
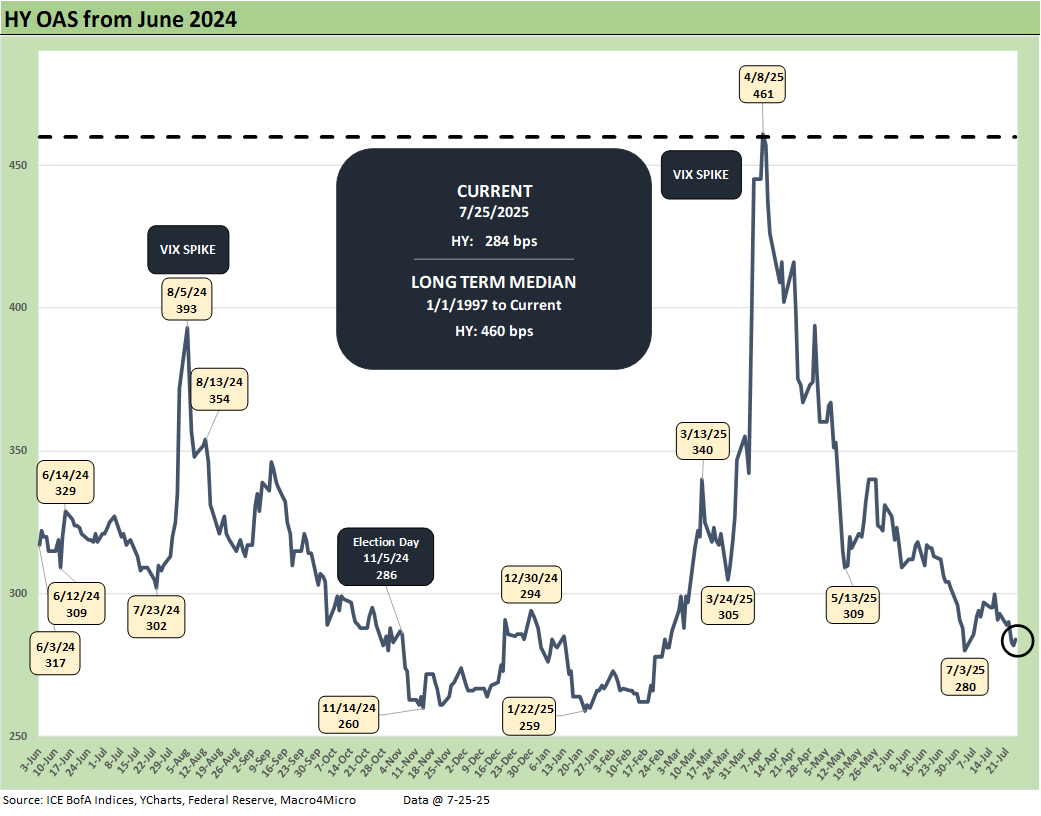
The above chart updates the HY OAS move on the week as HY spreads tightened to +284 bps from +293 bps on the week. That level put the current HY index within the June 2007 Hi-Lo range. That June 2007 period was the low credit spread month of the pre-crisis credit bubble.
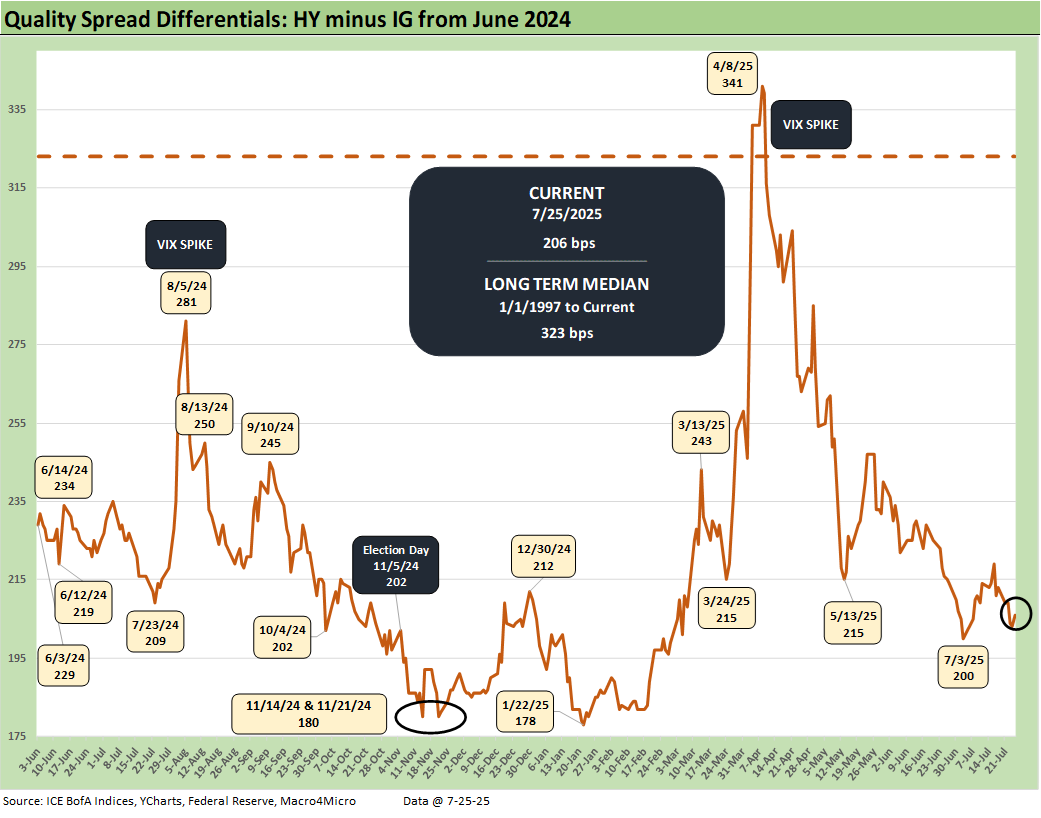
The “HY OAS minus IG OAS” quality spread differential compressed on the week by -7 bps to +206 bps. The differential remains comfortably above the Jan 2025 lows of +178 bps.
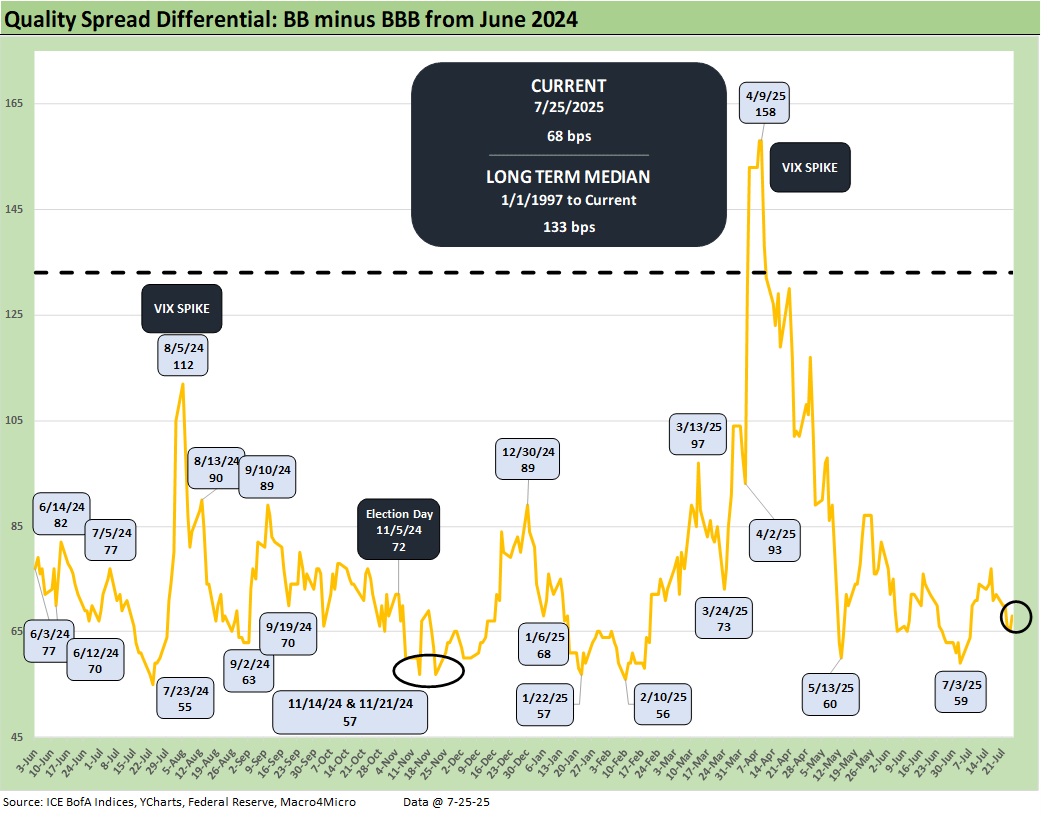
The “BB OAS minus BBB OAS” quality spread differential of +68 bps tightened by -4 bps on the week from +72 bps and remains above the mid to high 50 bps handles of previous lows.
Markets:
Durable Goods Jun25: Air Pocket N+1 7-25-25
Taylor Morrison 2Q25: Resilient but Feeling the Same Macro Pressure 7-25-25
New Home Sales June 2025: Mixed Bag 7-24-25
Existing Home Sales June 2025: The Math Still Doesn’t Work 7-23-25
PulteGroup 2Q25: Still-Lofty Margins see a Mild Fade 7-23-25
D.R. Horton 3Q25: Material Slowdown Still Good Enough 7-22-25
Housing Starts June 2025: Single Family Slips, Multifamily Bounces 7-18-25
Footnotes & Flashbacks: State of Yields 7-20-25
Footnotes & Flashbacks: Asset Returns 7-20-25
Mini Market Lookback: Macro Muddle, Political Spin 7-19-25
Housing Starts June 2025: Single Family Slips, Multifamily Bounces 7-18-25
Retail Sales Jun25: Staying Afloat 7-17-25
June 2025 Industrial Production: 2Q25 Growth, June Steady 7-16-25
CPI June 2025: Slow Flowthrough but Starting 7-15-25
Footnotes & Flashbacks: Credit Markets 7-14-25
Mini Market Lookback: Tariffs Run Amok, Part Deux 7-12-25
Mini Market Lookback: Bracing for Tariff Impact 7-5-25
Payrolls June 2025: Into the Weeds 7-3-25
Employment June 2025: A State and Local World 7-3-25
Asset Return Quilts for 2H24/1H25 7-1-25
JOLTS May 2025: Job Openings vs. Filling Openings 7-1-25
Midyear Excess Returns: Too little or just not losing? 7-1-25
Recent Tariff commentary:
US-Italy Trade: Top 15 Deficit, Smaller Stakes 7-18-25
US-France Trade: Tariff Trigger Points 7-17-25
Germany: Class of its own in EU Trade 7-16-24
US-Canada Trade: 35% Tariff Warning 7-11-25
India Tariffs: Changing the Music? 7-11-25
Taiwan: Tariffs and “What is an ally?” 7-10-25
US-Trade: The 50% Solution? 7-10-25
Tariff Man Meets Lord Jim 7-8-25
South Korea Tariffs: Just Don’t Hit Back? 7-8-25
Japan: Ally Attack? Risk Free? 7-7-25
US-Vietnam Trade: History has its Moments 7-5-25
US Trade in Goods April 2025: Imports Be Damned 6-5-25
Tariffs: Testing Trade Partner Mettle 6-3-25
US-UK Trade: Small Progress, Big Extrapolation 5-8-25
Tariffs: A Painful Bessent Moment on “Buyer Pays” 5-7-25
Trade: Uphill Battle for Facts and Concepts 5-6-25
Ships, Fees, Freight & Logistics Pain: More Inflation? 4-18-25
Tariffs, Pauses, and Piling On: Helter Skelter 4-11-25
Tariffs: Some Asian Bystanders Hit in the Crossfire 4-8-25
Tariffs: Diminished Capacity…for Trade Volume that is…4-3-25
For any1 interested, here are my Jun PCE inflation estimates:
https://arkominaresearch.substack.com/p/jun-2025-pce-inflation-estimate?r=1r1n6n