Asset Return Quilts for 2H24/1H25
We assemble monthly return quilts to track the moves across 2H24 into 1H25, and the ride got more volatile into 1H25.
And we are off into the second half…
We update a mix of monthly asset return quilts for the rolling 12 months using total returns and excess returns across fixed income and credit plus a multi-asset total return mix that includes some bellwether equity subsectors.
Reviewing the monthly patterns reminds us of the ride to get here, as asset risk is more volatile in 2025 due to tariff uncertainty and the aging cycle.
The 1H25 swings to the current record highs in equities come after two banner years for equities in 2023-2024 that were the best back-to-back since the late 1990s. We also see credit spreads back near some past historic lows.
The main threat near term is finality on the tariff structures, trade partner reactions, and a clear, empirical set of market data on how the tariff waves ahead will be received for the “reciprocals” and numerous high-volume Section 232 actions planned. The market awaits signs on how that all translate into prices, expenses, corporate profitability, and Fed policy.
The fixed income quilt above details monthly total returns across the credit tiers and UST index. The streak of strong performance for the CCC tier tells a story on the credit markets and how double digit yield and higher coupons have performed respectably. The 2025 swings of duration vs. credit reflect the uncertainty in tariff risks and some erratic moments in geopolitics. UST at the top or the bottom the past few months highlights the market mood shifts.
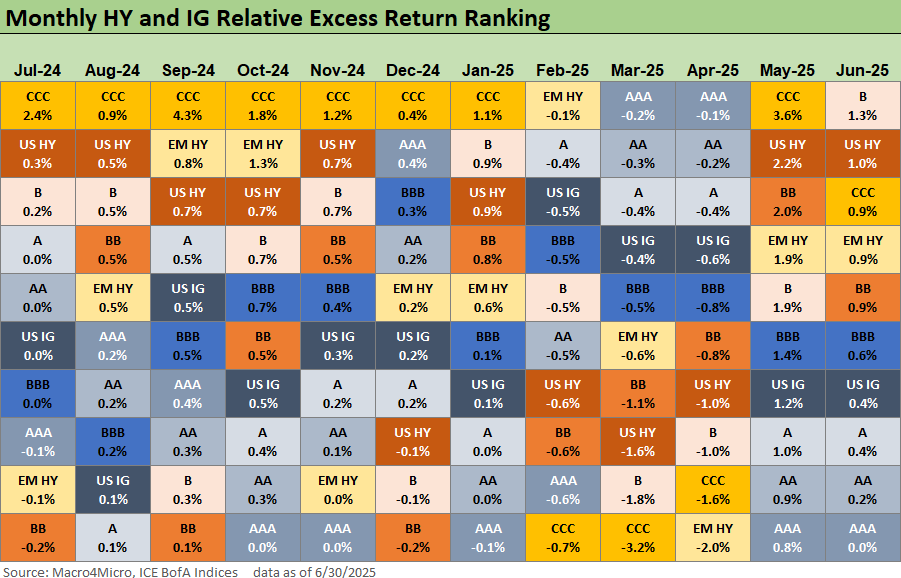
The credit asset classes are sorted out above by excess return ranking with the CCCs dominating 2H24 and a more mixed picture in 1H25 in price action month to month. The AAA pattern is reminiscent of the total returns and swings of the UST in the prior chart.
The multi-asset return quilt above uses a relevant collection of ETFs and cuts across debt and equities, with a wide range of underlying asset profiles. See the next chart for ticker references.
We find the swings in Russell 2000 small caps notable, especially when framed up with the big NASDAQ moves. As we cover in our weekly return publications, the US-centric small caps have struggled to get back into positive range YTD (see Footnotes & Flashbacks: Asset Returns 6-29-2025). That is a sign of low confidence in the cycle and how tariffs will fall on that peer group.
There is a lot of action to sort through this summer on final tariff actions and new Section 232s in some mission critical product groups for trade partners such as Pharma and Semis among others (Aircraft/Parts, Lumber, Copper). The White House will seek to round up twice the usual number of distractions (Note: anything goes wrong, it will be the Fed’s fault!).
See also:
Midyear Excess Returns: Too little or just not losing? 7-1-2
Footnotes & Flashbacks: Credit Markets 6-30-25
Footnotes & Flashbacks: State of Yields 6-29-2025
Footnotes & Flashbacks: Asset Returns 6-29-2025
Mini Market Lookback: Eye of the Beholder 6-28-25
Annual and Monthly Asset Return Quilt 2024 Final Score 1-2-25
Credit Returns: 2024 Monthly Return Quilt 12-26-24


