
Mini Market Lookback: Bracing for Tariff Impact
The usual partisan template saw deficit hawks go prostrate on the tax and spending bill while this coming week brings a tariff wave.


Bring me the reciprocals. All countries kneel! Tax all my subjects!
The UST curve moved higher and hit duration, but spreads were tighter in IG and HY. The week ended with record highs for the S&P 500 and NASDAQ. Equities also rose for the Dow, Russell 2000, and Midcaps. The S&P 500 saw 10 of 11 sectors positive and our peer group of 32 benchmarks and ETFs posted a score of 28-4 with the 4 in negative range comprised of bond ETFs.
The week was dominated by the One Big Beautiful Bill headlines and the payroll release, but the two did not move the needle much with jobs bringing a nice headline number but a more guarded “morning after” analysis that saw unfavorable occupational mix commentary (too much Government). The weaker private sector trends and lower quality of additions could signal challenges in coming months (see Payrolls June 2025: Into the Weeds 7-3-25, Employment June 2025: A State and Local World 7-3-25).
The tariff deal with Vietnam made many happy just to see a deal of any sort done while Trump indicated the letters (end of tariff pause) would start getting sent out to trade partners on Monday. Based on his Truth Social post on the Vietnam trade deal (“Vietnam will pay the US 20% tariffs”), we can expect a lot of spin and more disinformation on “who pays what” (see US-Vietnam Trade: History has its Moments 7-5-25).
Our take on the tax-and-spend bill (beautiful is not the word that comes to mind) is that a massive increase in deficits and the regressive impact on households tied to health care costs will take a toll on consumers at sea level as discretionary cash flow and contingent health care risks weigh on many. It was a good day for the top of the economic food chain and the usual visceral partisan crowd.

The above chart updates the Clash of the Big 4 trade partners we look at each week. We see the US benchmark pulling up the rear but clawing its way back into the game against Canada even if still a material distance behind Europe and China.

The above chart updates the 1-week spread deltas for IG vs. HY and from BBB down to CCC. IG was -9 bps tighter to +80 bps and HY -24 bps tighter to +280 as the market sees little signs of a crack in the credit cycle even if there are risks of more correlation whipsaws if Trump goes too far on tariffs. This week’s numbers include the effects of an index rebalancing.

The above chart updates the 1-week returns across the 32 asset line we track each week with the 28-4 score leaving the mix with only 4 bond ETFs in the red. The other 3 bond ETFs were in credit markets with IG (LQD), HY (HYG), and EM Sovereign debt (EMB) edging across the line into positive territory. The long duration UST 20+Y ETF (TLT) was in dead last but only slightly negative.
The winners across the 32 asset lines showed a healthy and diversified mix with Regional Banks (KRE) on top, Transports (XTN) at #2, Homebuilders (XHB) at #3 with perhaps some lift from lower mortgages, Materials (XLB) at #4, and the Russell 2000 rounding out the top 5. We see one Mag 7-heavy ETF in the top quartile mix with Consumer Discretionary (XLY) at #7.

The above chart lines up the tech bellwethers in descending order of weekly returns. We see 4 of the Mag 7 ahead of the S&P 500 and NASDAQ and 3 below the broad market benchmarks with Tesla and Meta in negative range. Tesla had a very rough 6 months. Looking back across 1 year, we see 2 out of 7 Mag 7 names in the red with Apple and Alphabet in negative range. Looking back 6 months, we see 4 of the Mag 7 in negative range with Apple, Alphabet, Amazon and Tesla really beaten up and Tesla especially volatile.

The above chart updates the UST deltas from the past week with the 2Y UST rising the most. The payroll numbers did not exactly kickstart the wheels turning on the other side of the Fed’s dual mandate to encourage easing. Job adds came in above expectation even with an asterisk on the occupation mix (see Payrolls June 2025: Into the Weeds 7-3-25, Employment June 2025: A State and Local World 7-3-25). As we go to print, the odds of unchanged fed funds for the July Fed meeting is just under 96% while the odds for one cut in Sept is just over 66% per the CME.
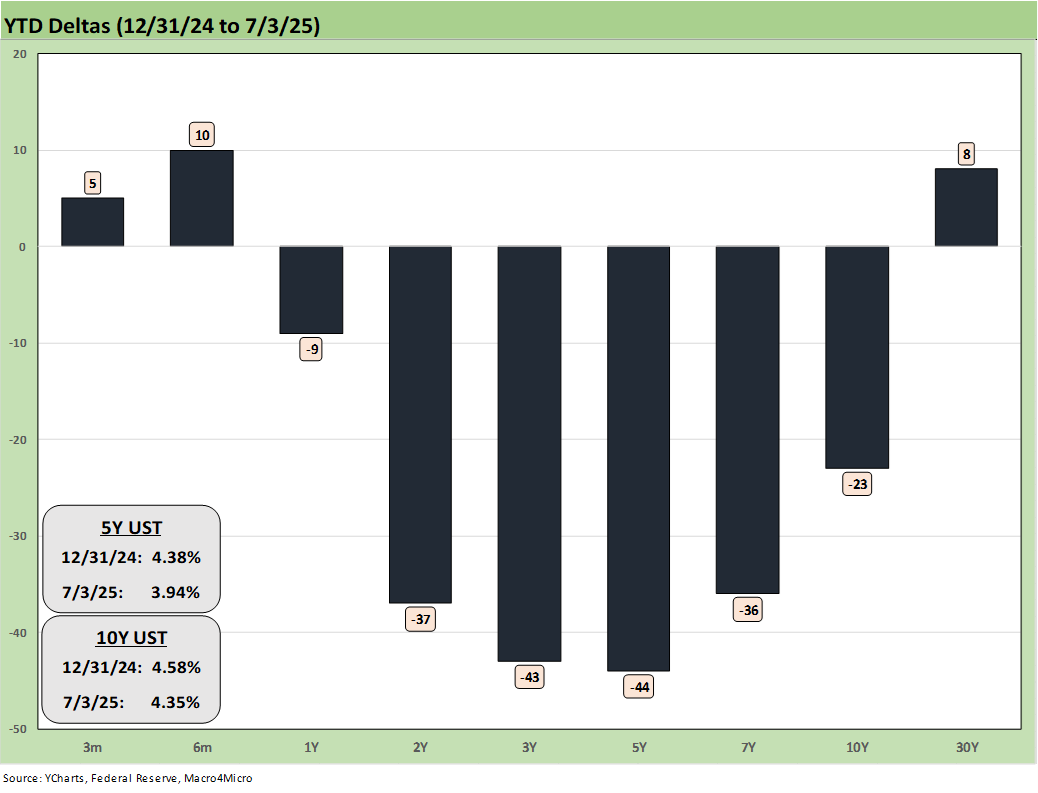
The above chart updates the YTD UST deltas. We see a bull steepener that supported bond ETF performance. We will detail time horizon bond returns in our separate Footnotes publication that we will post later this weekend.
The big test lies ahead before the Sept Fed meeting since the tariffs will be further along in the various working capital cycles. That includes the durable goods that use high tariff materials (notably steel and aluminum). In addition, the wave of “reciprocal” tariffs will be blasting out this coming week according to the headlines with “letters” to trade partners starting to go out on Monday.

The above chart updates the time series for 10Y UST vs. the Freddie Mac 30Y mortgage benchmark (releases Thursday at noon). The 6.67% shows mortgages edging lower after a few weeks near the 6.8% range.

The above chart details the move back under the 300 bps HY OAS line for the index with a solid rally and a rebalancing since last week’s +302 bps to the current +280 bps. HY OAS is now back inside of where the peak bubble month of June 2007 ended (+298 bps) after starting that month at +241 bps (see (Footnotes & Flashbacks: Credit Markets 2-17-25, HY Spreads: Celebrating Tumultuous Times at a Credit Peak 6-13-24).

The “HY OAS minus IG OAS” quality spread differential is now down to +200 from +214 bps last week and is knocking on the door of moving below the +200 bps line as we saw in Jan 2025 and Nov 2024 as noted in the chart.

The above chart updates the “BB OAS minus BBB OAS” quality spread differential. We see the +59 bps differential flat to last week after factoring in the index rebalancing moves with month end index changes. Compression in the BB tier has been the main driver YTD, and the +59 bps differential is close to the low ticks of 2024 and early 2025. The middle tiers of BB and BBB have been sound places to be positioned across 2025.
See also:
Payrolls June 2025: Into the Weeds 7-3-25
Employment June 2025: A State and Local World 7-3-25
Asset Return Quilts for 2H24/1H25 7-1-25
JOLTS May 2025: Job Openings vs. Filling Openings 7-1-25
Midyear Excess Returns: Too little or just not losing? 7-1-25
Footnotes & Flashbacks: Credit Markets 6-30-25
Footnotes & Flashbacks: State of Yields 6-29-2025
Footnotes & Flashbacks: Asset Returns 6-29-2025
Mini Market Lookback: Eye of the Beholder 6-28-25
PCE May 2025: Personal Income and Outlays 6-27-25
Durable Goods May25: Aircraft Surge, Core Orders Modest Positive 6-26-25
1Q25 GDP: Final Estimate, Consumer Fade 6-26-25
New Home Sales May 2025: Slip and Slide 6-25-25
KB Home 2Q25: Negative Industry Trends Keep Coming 6-25-25
Existing Homes Sales May 2025: Sequential Stronger, YoY Weaker 6-23-25
Mini Market Lookback: FOMC Spoke Clearly, Iran and Trump up next 6-21-25
Lennar 2Q25: Bellwether Blues 6-20-25
FOMC Day: PCE Outlook Negative, GDP Expectations Grim 6-18-25
Home Starts May 2025: The Fade Continues 6-18-25
May 2025 Industrial Production: Motor Vehicle Cushion? 6-17-25
Retail Sales May 25: Demand Sugar Crash 6-17-25
Mini Market Lookback: Deus Vult or Deus Nobis Auxilium 6-14-25
Credit Snapshot: Hertz Global Holdings 6-12-23
CPI May 2025: The Slow Tariff Policy Grind 6-11-25
Mini Market Lookback: Clash of the Titans 6-7-25
Past-Prologue Perspective for 2025: Memory Lane 2018 6-5-25