
PulteGroup 2Q25: Still-Lofty Margins see a Mild Fade
We look at Pulte 2Q25 earnings and guidance as high gross margins still rank near the top of the peer group.

Pulte (PHM) continues to post some of the best gross margins in the peer group at 27%, down from the 2022 peak of 30% but still well ahead of pre-COVID levels. Average selling prices held in well in the upper quartile of the major public builders but net new orders faded with backlogs running lower as we have seen frequently with the major builders.
PHM was quite clear it was planning for continued sector weakness and would slow land spend, reduce start rates, and focus on selling down excess spec inventory. That reflects the intrinsic working capital and operational flexibility that makes homebuilders safer in the credit realm than high fixed cost manufacturers or commodity-driven issuers.
In terms of credit quality, Pulte still deserves to be moved up into the single A tier with NVR and D.R. Horton on the balance of its financial metrics, profitability performance, and balance sheet strength (see Credit Snapshot: PulteGroup 5-7-25, Credit Crib Note: PulteGroup 8-11-24).
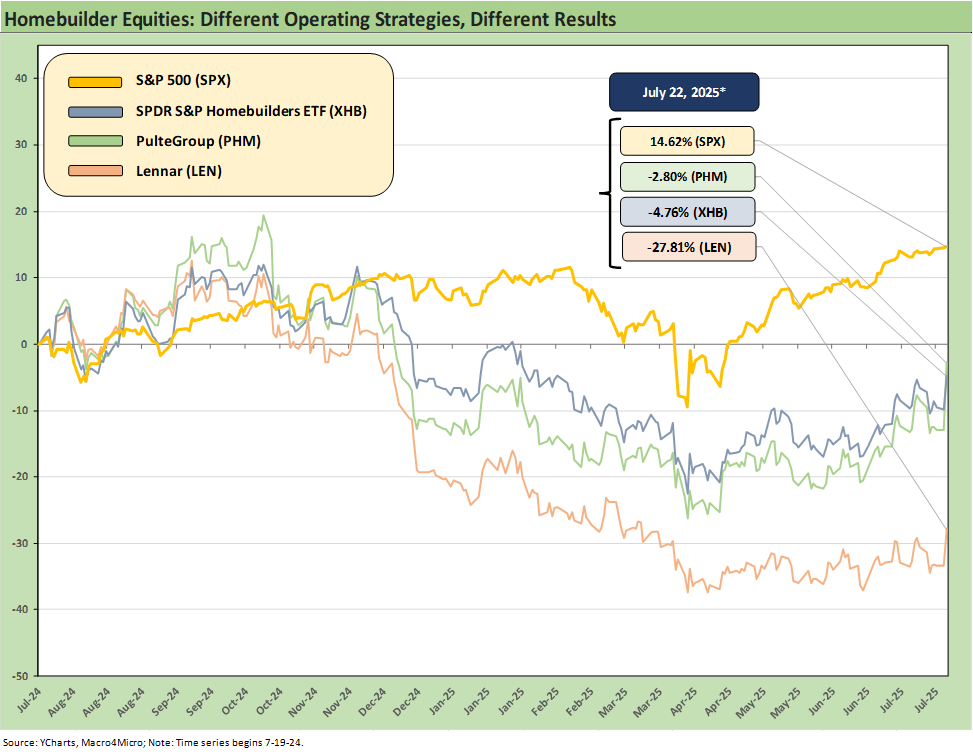
The above chart frames price returns of PHM stock vs. Lennar for a useful comp given the very different strategies employed by Pulte vs. the #1 homebuilder based on revenue. We also include the S&P 500 for a broad market benchmark as well as the Homebuilder ETF (XHB) for the trailing 1-year period. The homebuilder pain set in during 4Q24 after a stretch of leading performance by the XHB over the trailing 1-year ending in Sept 2024.
The high margin focus of PHM contrasts with the “even-flow” and “price to sell” strategy used by Lennar to keep inventory turning and in theory maximizing cash flow for buybacks and helps manage supplier costs and relationships (see Lennar 2Q25: Bellwether Blues 6-20-25, Credit Snapshot: Lennar (LEN) 4-15-25, Credit Crib Note: Lennar Corp (LEN) 1-30-25). The idea is that keeps LEN cash flow cranking up. The high margin players such as Pulte and luxury homebuilder Toll Brothers have held in better in the stock market across this rough patch (see Credit Snapshot: Toll Brothers 5-5-25), so LEN’s long game approach has not won the short-term stock performance contest.
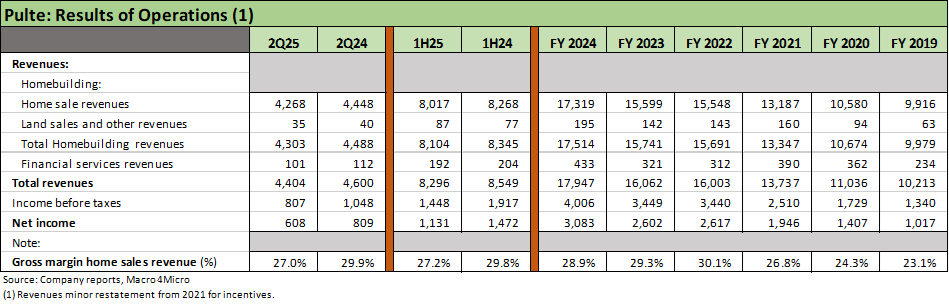
The above table updates the income statement trends for the most recent fiscal quarter ending in June (2Q25 for PHM). We are seeing revenue softening with PHM expecting more of the same market conditions ahead. PHM margins have been solid in peer group context at 27%, and PHM is guiding to 26% handle home sales gross margins for the 3Q25 and 4Q25 periods. The goal is to trim spec inventory down into a target range of 40% to 45% of production by year end from 47% at the end of 2Q25.
The wildcard will remain mortgage rates and the usual underlying variables debate that plays out on the screen each week (see Footnotes & Flashbacks: State of Yields 7-20-25). The yield curve anxiety around the Powell vs. Trump battles go beyond easing and lower short rates since disarray in the bond markets and the potential for Trump and Bessent to be on the wrong side of the tariff inflation debate would lead to UST curve steepening even with the front end easing. That would hit mortgage rates.
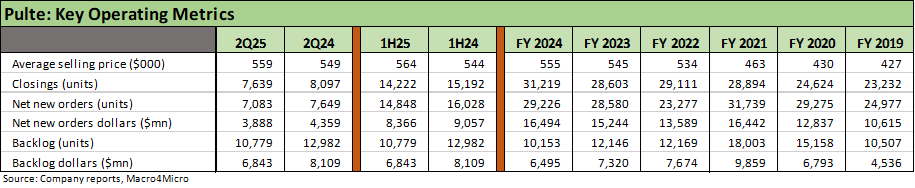
The above table updates the running weakness in volumes (closing and orders) with ASPs for PHM actually ticking higher in 2Q25 and YTD just as we saw in FY 2024. The 2Q25 ASP of $559K is in line with the $560K to $570K PHM expects in 3Q25 and 4Q25 and for the full year. The community count is expected to be 3% to 5% higher by year end.
Orders have faded in 2025, and that is not unusual in big builders reporting during 2025 as the backlogs broadly are running down. Some of the smaller public builders in growth mode are heading higher, but generally we see weakness in orders YoY as a common trend in 2025. As we cover in a segment closing chart further below, weakness in Florida and Texas, which are two massive housing markets, have not been offset by other regions even though the Midwest and Northeast performed well enough in 3Q25.
Among the items addressed on the earnings call, PHM continues to estimate a cost of $5,000 per unit for tariff costs in addition to incentive costs over 8% of gross sales vs. 6.3% in 2024. Both incentives and tariffs are still drags in 2025. In terms of tariffs, PHM sources around 20% to 25% of its lumber from Canada and the rest from the US. PHM cited the back half of 4Q25 for when tariffs would be hitting harder and continuing into 2026.
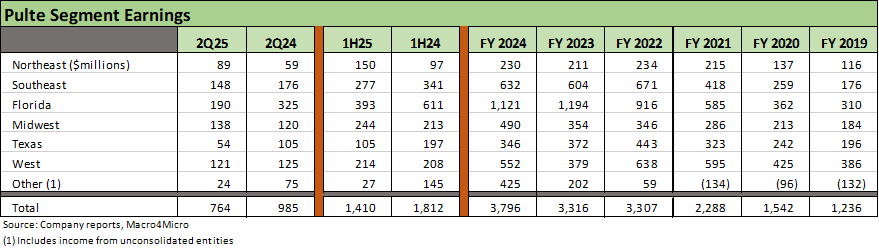
The segment earnings table above highlights the importance of Florida and the Southeast with Texas a high volume but lower earnings segment. Texas has by far the lowest ASP at $383K in 2Q25 while Florida was running at $551K. As is typically the case, the West at an ASP of $693K is a pricey segment but the Northeast leads in ASP at $770K for 2Q25 and $756K for 1H25. The West and Texas saw the steepest declines in YoY in new orders in the quarter.
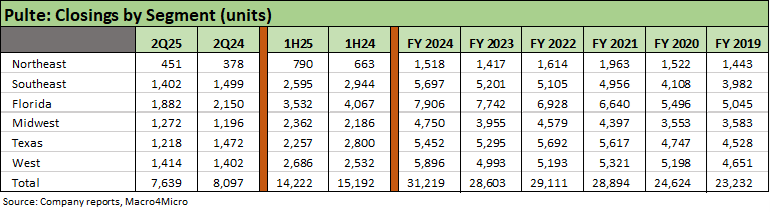
The above table updates the closing volumes and the mix by regional segment with the Northeast by far the smallest and Florida the highest. West and Southeast are in the next tier. Among headwinds PHM cited was some softer performance from the move-up segment that carries higher margins.
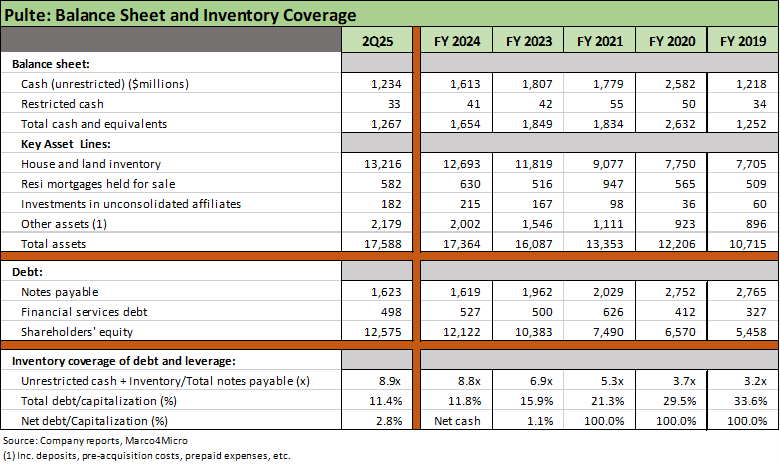
The balance sheet of Pulte is exceptionally strong just based on the significant multiple of total debt seen in the inventory/debt ratio at 8.9x and the net debt % cap of 2.8%. Total homebuilding debt of $1.6 bn is dwarfed by the asset side of the equation. With higher margins and steady growth (PHM expects to grow by 5% to 10% longer term), that financial health in turn translates into an equity market cap of close to $22 bn. That is a favorable vote from the market proxy on very hefty asset coverage in the PHM credit story.
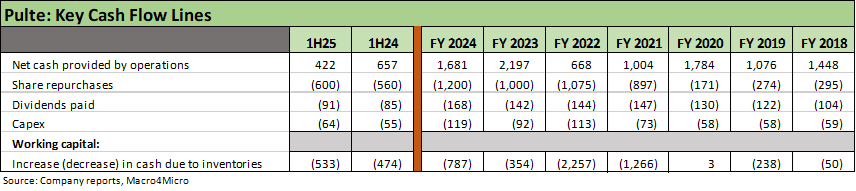
The cash flow generation strengths of the major builders and the aggressive capital allocation policies around buybacks is now “a given” for investors with the large public builders. Pulte is no different with its $1 billion-plus run rate YTD after $1.2 bn in 2024. In terms of cash flow deployment, during 1H25 PHM invested $2.5 bn in land acquisition and development and is on a path to $5 bn for the full year. PHM could see downward adjustments in 2H25.
Housing sector:
Housing Starts June 2025: Single Family Slips, Multifamily Bounces 7-18-25
New Home Sales May 2025: Slip and Slide 6-25-25
Existing Homes Sales May 2025: Sequential Stronger, YoY Weaker 6-23-25
Homebuilders:
D.R. Horton 3Q25: Material Slowdown Still Good Enough 7-22-25
KB Home 2Q25: Negative Industry Trends Keep Coming 6-25-25
Lennar 2Q25: Bellwether Blues 6-20-25
Credit Snapshot: Meritage Homes (MTH) 5-30-25
Homebuilder Rankings: Volumes, Market Caps, ASPs 5-28-25
Credit Snapshot: PulteGroup (PHM) 5-7-25
Credit Snapshot: Toll Brothers 5-5-25
Credit Snapshot: D.R. Horton (DHI) 4-28-25
Credit Snapshot: Lennar (LEN) 4-15-25
Credit Snapshot: Taylor Morrison Home Corp (TMHC) 4-2-25
Lennar: Cash Flow and Balance Sheet > Gross Margins 3-24-25
KB Home 1Q25: The Consumer Theme Piles On 3-25-25
Toll Brothers 1Q25: Performing with a Net 2-20-25
Credit Crib Note: Lennar Corp (LEN) 1-30-25
D.R. Horton: #1 Homebuilder as a Sector Proxy 1-28-25
KB Home 4Q24: Strong Finish Despite Mortgage Rates 1-14-25
See also:
Credit Snapshot: Ashtead Group 7-21-25
Footnotes & Flashbacks: Credit Markets 7-21-25
Footnotes & Flashbacks: State of Yields 7-20-25
Footnotes & Flashbacks: Asset Returns 7-20-25
Mini Market Lookback: Macro Muddle, Political Spin 7-19-25
Retail Sales Jun25: Staying Afloat 7-17-25
June 2025 Industrial Production: 2Q25 Growth, June Steady 7-16-25
CPI June 2025: Slow Flowthrough but Starting 7-15-25
Mini Market Lookback: Tariffs Run Amok, Part Deux 7-12-25
Mini Market Lookback: Bracing for Tariff Impact 7-5-25
Payrolls June 2025: Into the Weeds 7-3-25
Employment June 2025: A State and Local World 7-3-25
Asset Return Quilts for 2H24/1H25 7-1-25
JOLTS May 2025: Job Openings vs. Filling Openings 7-1-25
Midyear Excess Returns: Too little or just not losing? 7-1-25