
JOLTS May 2025: Job Openings vs. Filling Openings
A decent JOLTS report does not set the stage for the other half of the dual mandate making life easier for the Fed.


I am hired, I am hired not. I am fired, I am fired not.
Job Openings moving higher captured the headlines, but hires were down and so were layoffs/discharges. That in turn makes for a mixed picture where another 30-60 days can make a difference when the bulk of the tariffs remain about guesswork.
The bigger drama will come with the Thursday payroll release ahead of the July 4 holiday and we get a read on what decisions might have been made in the aftermath of the Liberation Day panic and any new actions taken to “brace for impact” on global sourcing or with respect to exposure to services businesses that will be hit (e.g. retail, travel, leisure and hospitality, manufacturing, freight and logistics, etc.).
The labor market has not been in a panic in economic decision making even employers are waiting for the full story on tariffs and how rattled the supplier chains will be. There are also pressing questions of what it will all mean for costs and – for many small businesses – the availability of inventory and critical inputs for their businesses (services or goods).

JOLTS is at a 1-month lag, so we still look to this Friday’s payroll release for a more timely read on how June played out. Job Openings for May data was solid at 7.8 million, which in turn marks an uptick of 374K. That 7.8 million is down YoY from 7.9 million in May 2024. The May 7.8 mn is higher than the peak number of 7.6 mn during Trump 1.0 in Nov 2018 but well off the 12.2 million peak openings of March 2022 under Biden. Many of those peak openings in 2022 have been filled along the way as we detail in the monthly payroll commentaries.
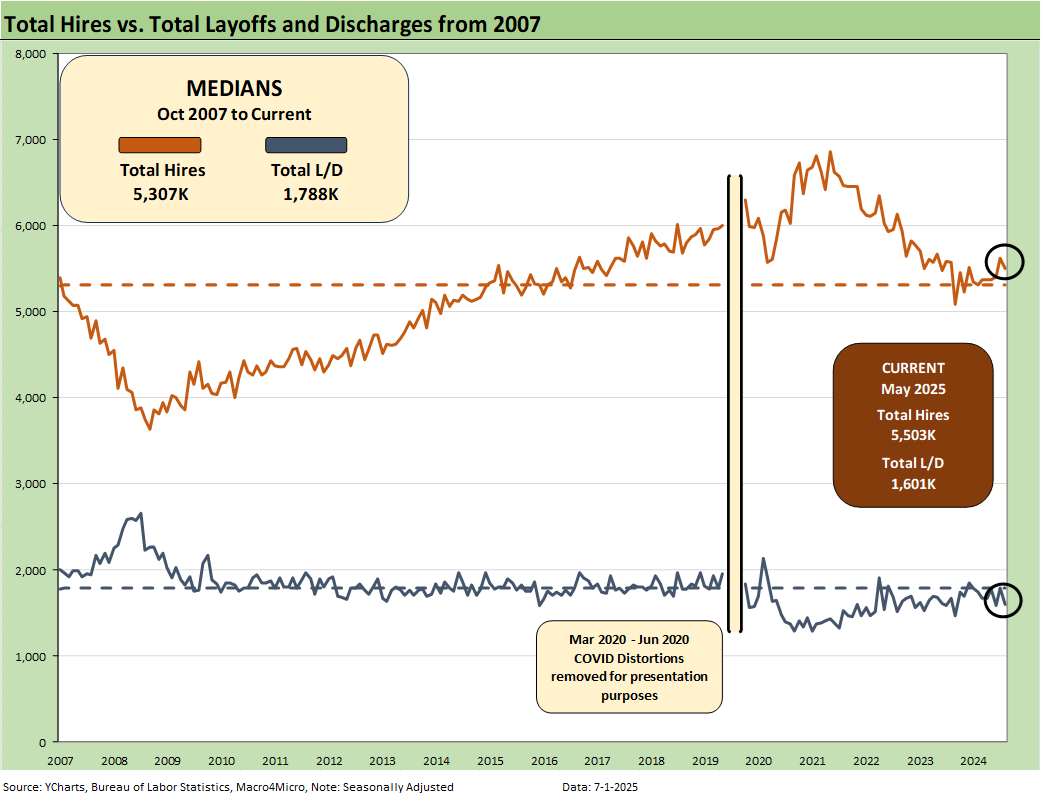
The above chart plots Hires vs. Layoff/Discharges on a SAAR basis. We remove the COVID numbers from this chart to support the visual value for “normal” periods. The COVID impacts are detailed further below.
Hires were down sequentially by -112K and down by -70K YoY. Layoffs/Discharges were lower by -188K MoM and down by -64K YoY, so that is a mixed result overall for “hires vs. fires.”
These days – and given the tariff headlines and softening consumer spending metrics – an increase in openings and signs of moderating hires and layoffs/discharges constitute balanced but constructive news for the broader economy. That is not a signal to the FOMC to rush out and ease rates until the tariff inflation risks have some supportive data points.
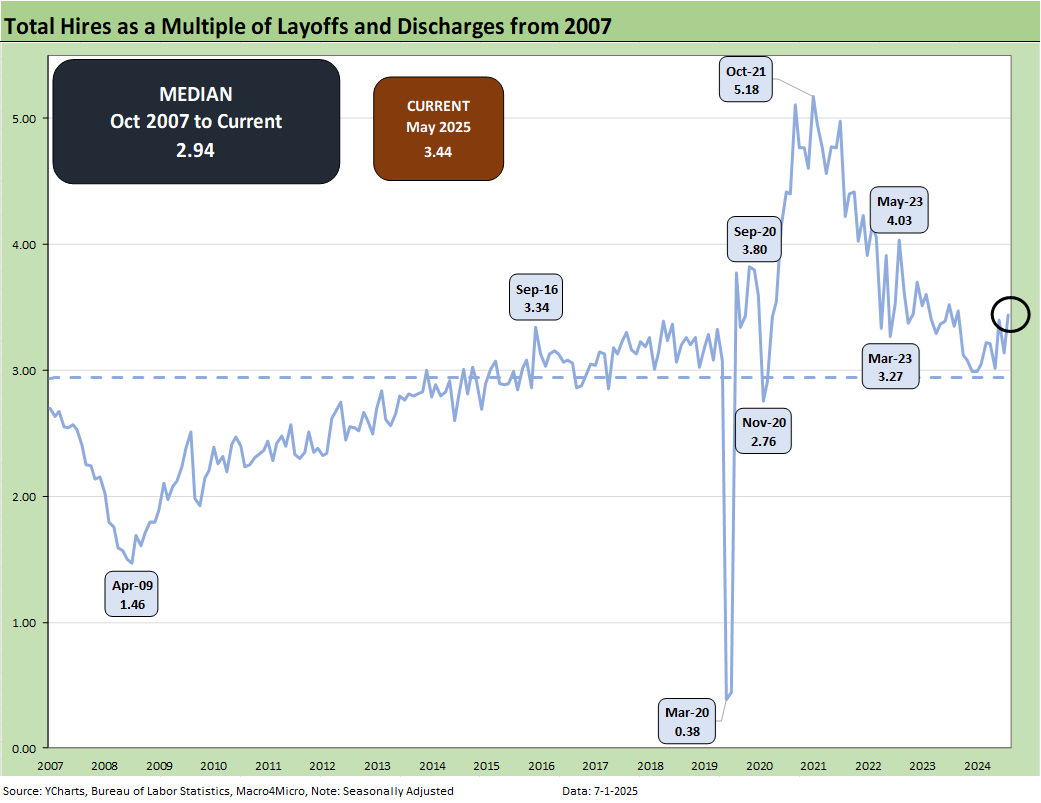
The above chart updates the ratio of Hires to Layoffs/Discharges. The relationship moved higher this month from 3.12 to 3.44 and is above the long-term median of 2.94 presented from 2007. That post-2007 period includes the longest recession since the Great Depression and the COVID pandemic.

The above chart plots Hires vs. Total Separations on a SAAR basis. Separations include Quits, Layoffs/Discharges, and “Other Separations.” Again, we remove the COVID numbers from this chart to support the visual value for “normal” periods. (COVID impacts are detailed further below.) Separations in total were lower by -71K sequentially and were down by -72K YoY.
We typically do not find “Total Separations” very interesting as a multi-line net number. The most important moving parts are Hires and Layoffs/Discharges. “Other Separations” could get more interesting in a world of mass deportation when people get “disappeared.” Did they “quit” by not showing up for work or did they get “Othered?” For May, “other separations” are not telling much of a story but moved higher by 40K to 349K MoM.
There is also the uncertainty of how the de facto labor force gets measured and how many are “off the books.” As the year goes on, those questions could be more important. Overall, the ICE numbers have been very low versus the election rhetoric but the visuals of armed masked men with no IDs along with the violent removal process has been a toxic political flashpoint. Beating on the father of 3 Marines and raiding a kids birthday party were low points among many low points.

The above text box is our recurring recap of the COVID period. Almost 28 million Separations combined in March-April 2020 is a brutal reminder of that period. That hopefully will be the last time we ever see that. With RFK Jr at the helm, you can never say never.

The Hires Minus Total Separations differential is plotted above. Both Hires and total Separations moved lower. The net number above moved lower sequentially MoM to +261K from +285K and remains well above the long-term median of +187K.
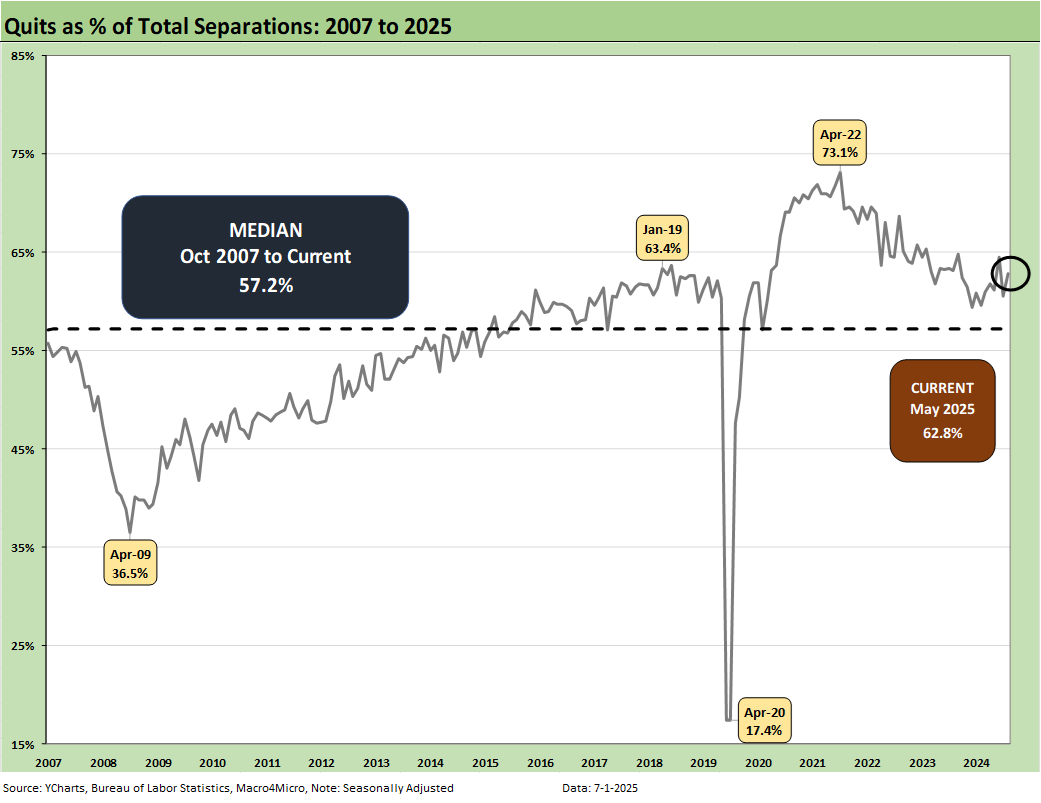
The time series for Total Quits as a % of Separations (SAAR basis) moved higher MoM to 62.8% from 60.4% and is above the long-term median of 57.2%. The classic “Quits Rate” is measured by Total Quits as a % Total Employment, and that metric ticked higher on the month to 2.1% from 2.0% in April (revised). The Quits rate is flat at 2.1% YoY.
See also:
Midyear Excess Returns: Too little or just not losing? 7-1-25
Footnotes & Flashbacks: Credit Markets 6-30-25
Footnotes & Flashbacks: State of Yields 6-29-2025
Footnotes & Flashbacks: Asset Returns 6-29-2025
Mini Market Lookback: Eye of the Beholder 6-28-25
PCE May 2025: Personal Income and Outlays 6-27-25
Durable Goods May25: Aircraft Surge, Core Orders Modest Positive 6-26-25
1Q25 GDP: Final Estimate, Consumer Fade 6-26-25
New Home Sales May 2025: Slip and Slide 6-25-25
KB Home 2Q25: Negative Industry Trends Keep Coming 6-25-25
Existing Homes Sales May 2025: Sequential Stronger, YoY Weaker 6-23-25
Mini Market Lookback: FOMC Spoke Clearly, Iran and Trump up next 6-21-25
Lennar 2Q25: Bellwether Blues 6-20-25
FOMC Day: PCE Outlook Negative, GDP Expectations Grim 6-18-25
Home Starts May 2025: The Fade Continues 6-18-25
May 2025 Industrial Production: Motor Vehicle Cushion? 6-17-25
Retail Sales May 25: Demand Sugar Crash 6-17-25
Mini Market Lookback: Deus Vult or Deus Nobis Auxilium 6-14-25
Credit Snapshot: Hertz Global Holdings 6-12-23
CPI May 2025: The Slow Tariff Policy Grind 6-11-25
Mini Market Lookback: Clash of the Titans 6-7-25
Payrolls May 2025: Into the Weeds 6-6-25
Employment May 2025: We’re Not There Yet 6-6-25
US Trade in Goods April 2025: Imports Be Damned 6-5-25
Past-Prologue Perspective for 2025: Memory Lane 2018 6-5-25