
Trade: Uphill Battle for Facts and Concepts
Carney’s White House visit did not look helpful. Trump threw out some insults as a warmup and came across badly in the press moments.


March of Folly Part N+1
We update the latest trade stats released today for the US with the world. The US Goods trade deficit hit an LTM all-time high for 1Q25 LTM. We include a focus on the Canada stats given the first post-election meeting of Trump and Carney.
The Goods trade deficits hit annual records three times in Biden’s term, twice in Trump 1.0, and now once again in Trump 2.0. Those all occurred after Trump negotiated the USMCA, which he called “the best and most important trade deal ever made by the USA” in December 2019. Today he questioned whether the USMCA was needed.
We have covered the trade flows topic at length and with plenty of fact charts in past commentaries (see links at the bottom), so will keep this one very brief and pictorial.
On the Canadian front, it will be interesting to see if the various groups there can put country ahead of party in a way the US has failed to do. The resource rich provinces of Alberta and Saskatchewan and the anti-pipeline, anti-carbon crowds in other provinces might fail to get on the same page. That “party over country problem” in the US has not been a winning formula.
Even if the plot has thickened, the inability of too many to “follow the plot” in economic context is still a problem. The idea that “buyer pays” the tariff is one of those “non-facts” that highlight the challenge given a strange but incorrect view Trump reiterated in his recent Time Magazine interview (see Mini Market Lookback: Earnings Season Painkiller 4-26-25).
“Mankind, it seems, makes a poorer performance of government than of almost any other human activity.”
- Barbara Tuchman from The March of Folly, From Troy to Vietnam

The above chart updates the path of the US trade deficit since the Reagan late 2.0 years. The two best US economies in the postwar years were under Reagan in the 1980s (see Presidential GDP Dance Off: Reagan vs. Trump 7-27-24) and Clinton in the 1990s (see Presidential GDP Dance Off: Clinton vs. Trump 7-27-24). That “best of” was true of GDP growth with very strong bull markets in stock as well (see Trump's “Greatest Economy in History”: Not Even Close 3-5-25).
Amnesia and/revisionism has since set in as new priorities are set by new leaders. Some pretend those were not great years for the US economy and for shareholders across many industries from Tech to Defense & Aerospace to Capital Goods (Caterpillar and Deere and their emerging global dominance).
The balanced budget and booming markets of the Clinton years (the only postwar President with two terms with no economic contractions) gave way to the explosion of budget deficits, wars, a housing bubble, a systemic bank crisis, protracted ZIRP and bailout, an oil patch meltdown, and a pandemic that also saw protracted periods of ZIRP and QE across the timeline.
The rise of global enterprises brought the buildout of low-cost sourcing set up by many industries. The goal was to compete effectively through lean manufacturing practices. The evolution of global operations met the goals of C-suites to meet their fiduciary duties to shareholders, grow their balance sheet, and invest in expansion. The cost of such global networks was a small haircut to GDP in the net trade deficit line in exchange for steady growth in the PCE, Fixed Investment and Government investment and services. We believe those simple facts get obscured in the rhetoric around “rip-offs” and “subsidies.” Those misconceptions might get you a grade of “D” in intro economics.
The new policies are set to undo and revamp a few decades of history. That does not come cheaply in economic costs and transition challenges. Damage can be done to global alliances and create more uncertainty as allies are alienated. The irony is that if you anger enough allies, the Section 232 and “national security” rationale become more relevant as you send trade partners looking for new allies after pissing them all off.

The above chart plots the import and export lines across the cycles. We always highlight the many multiplier effects that come with this growth in trade (see The Trade Picture: Facts to Respect, Topics to Ponder 2-6-25, Tariffs: Questions to Ponder, Part 1 2-2-25). It is about a lot more than a single border metric (trade deficit) that is a function of private sector consumer and corporate sector decisions. The decision was not made by the selling country. The absurdity of the current “rip-off” premise gets old quickly.

The above chart updates the import checklist for the US with the world (see US Trade with the World: Import and Export Mix 2-6-25). The #1 import for the LTM period was Pharma, and Trump just issued an executive order on pharma that sets the table for his next series of moves. The auto fight was always going to be big, but the pharma battle will set off a major confrontation with Europe (see US-EU Trade: The Final Import/Export Mix 2024 2-11-25). There is a lot of risk in a major clash with the EU for multiple reasons across the trade lines.

The above chart updates the LTM exports and calendar years from 2017. Once again, we see big retaliation risk that could come from high tariffs on the pharma line. Computer equipment can face retaliation as well, but it might come from obstruction along the supplier chain. For China, their dominance in generics and pharma intermediates also lurks as a supply shock threat.
Even a light scan of the import and export list underscores how hard it is for an undisciplined tariff process to avoid major fallout. That is especially the case when a strategy is so coercive and riddled with simplicity in economic thought. Being factually incorrect, notably on the “buyer pays” topic and excessive use of misinformation (talk with Xi – not talking with Xi, etc.), does not help the process.

The above chart updates the trade partner rankings by total trade (imports + exports). We list the top trade partners including each country and also include total Europe, EU, and Euro Area as line items. The “Big 4” trade partners are just under 57% of total trade.

The above chart details Trump’s least favorite trade partners in descending order of trade deficits. Vietnam and Ireland stand out given how rapidly they have climbed the past cycle.

The above chart updates total trade (exports + imports) for the Top 15.

The above chart details the metric of relative trade deficits as a % of exports. The theory on this ratio is tied to the idea of “bad stuff (deficits) divided by good stuff (exports).” While we do not embrace that perspective, the ratio does give some context to some of the major trade partners with large deficits. For example, Mexico and Canada do not make the list in a sign of the important export volumes to those partners. Vietnam and Ireland have very low exports from the US.

The above chart lines up the import volumes for the Top 15. While we often hear from Trump that Canada “doesn’t have anything we need,” there are $421 billion worth of decision makers in the private sector who say otherwise. Those statements by Trump fall short of rational in a free market becoming less free on tariff distortions. Sounds more like a progressive Democrat on a bad day.

The Top 15 export markets show the EU at #1, Canada at #2, and Mexico at #3. If you embrace the view that “one country’s exports meet a buyer’s need in another country,” it makes more sense than the bizarre notion that the buyer is somehow subsidizing the seller. The same on imports since someone in the US is buying the product for a reason (lower cost, product-specific specs, the lack of domestic alternatives, etc.).
Simple examples: A pair of CCM skates is not a Canadian subsidy. The import of potash is needed to fertilize crops and there is not an alternative in the US (it is very hard to say “we don’t need Canada” on that one). Western Canada Select crude is priced at a material discount to West Texas Intermediate (e.g. recently $9 to $10 per bbl) and has profit value to a refiner. Those refiners are looking to maximize their profit (very much a Trumpian impulse in his own P&L).
While economic debates have been turned around in a manner that bears little semblance (ok no semblance) to Econ 101, the trade logic is being sacrificed to one man’s cockamamie theory. It is one man’s own bias of terms that gets instantly political given the state of MAGA dynamics. Then the usual partisan somnambulists fall into line while the power hungry, knowledgeable, ethical equivocators who know better nod and stay with their personal ambition playbook. It is a mess.
A look at Canada…
In the next series of charts, we run through the Canadian stats. We have reviewed some of the issues in earlier commentaries (see Trade Exposure: US-Canada Import/Export Mix 2024 2-7-25, Aluminum and Steel Tariffs: The Target is Canada 2-10-25).

The above chart breaks out the timeline for the Goods trade deficit with Canada. The number can swing around with the price of crude oil and refined petroleum products. We usually highlight that the US has a Goods trade surplus ex-crude oil, and Trump of course never brings that up.
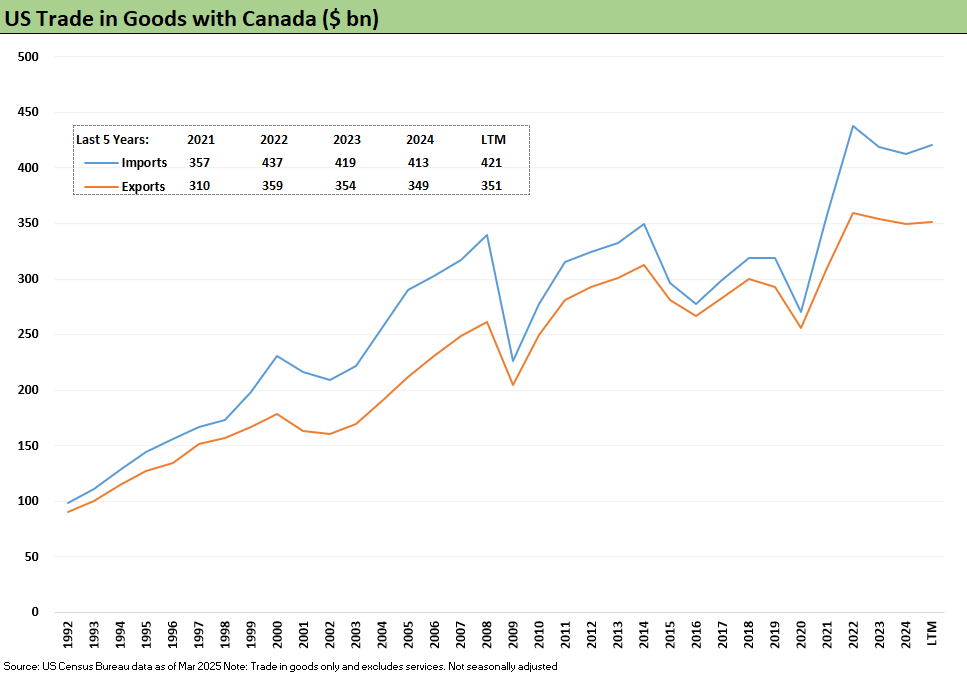
The above chart updates a time series angle on the import and export growth of the US with Canada starting back when the original NAFTA was being discussed.
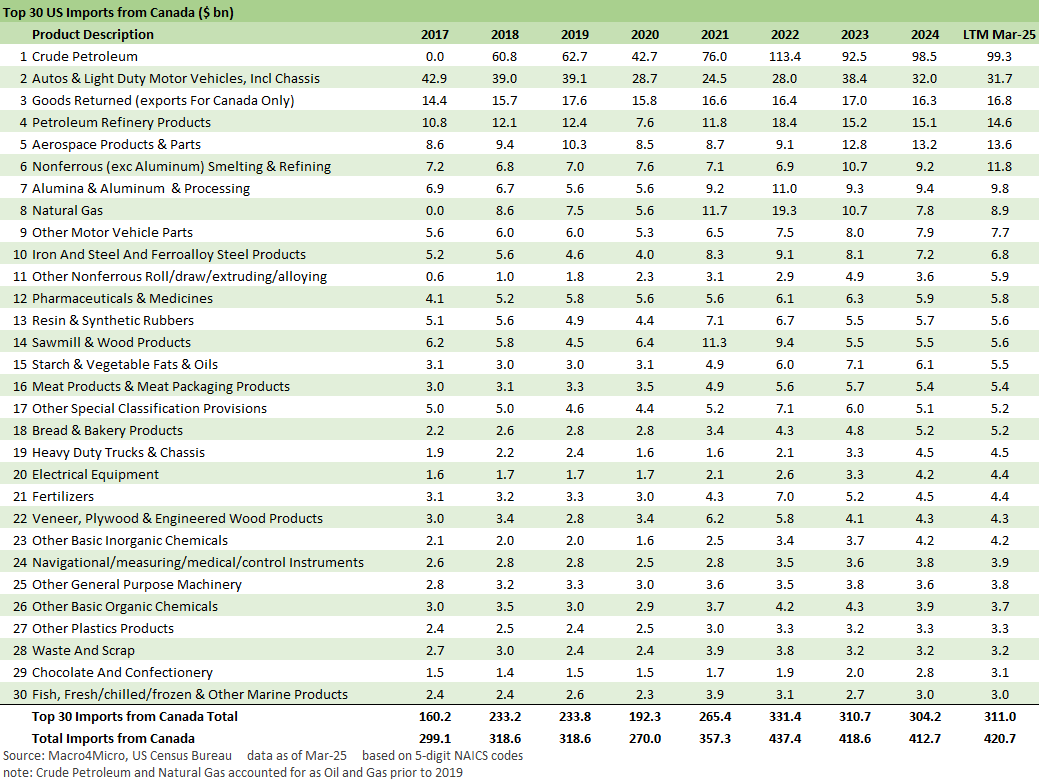
The last two charts update the import and export product lines to show where the numbers stand at LTM 1Q25 and across the period from Trump 1.0. For all of the noise about dairy (not detailed in the chart), the US has a significant surplus in dairy with Canada.
Canada has a supply management policy using what is essentially a “tariff rate quota” where high tariffs kick in above certain levels that the US has not hit. The misrepresentations on this score undermine trust, but that flaw includes a long list of items by now. Of course, that is minor compared to admitting to the use of economic coercion with the mission of an annexation of Canada, a G7 nation, NORAD partner, and NATO ally.
The import list includes low-cost aluminum where Alcoa and other majors have much more in capacity in Canada than the smaller slice in the US with its materially less competitive power costs (electricity a major part of aluminum processing costs). Alcoa was clearly not happy with the tariffs based on its stated view of the economics (covered in earlier commentaries).
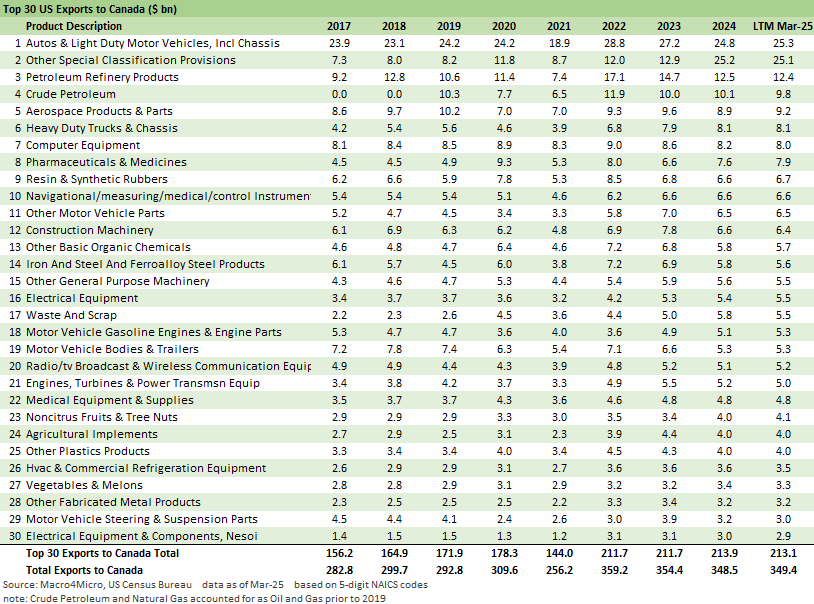
The above chart updates the export flow to Canada from the US. With the exception of refined products, there are a lot of value-added goods in the mix. The auto components flow and finished vehicles will be damaged by the tariffs in both exports and imports.
Tariff and Trade links:
Tariffs: Amazon and Canada Add to the Drama 4-29-25
Ships, Fees, Freight & Logistics Pain: More Inflation? 4-18-25
Tariffs, Pauses, and Piling On: Helter Skelter 4-11-25
Tariffs: Some Asian Bystanders Hit in the Crossfire 4-8-25
Tariffs: Diminished Capacity…for Trade Volume that is…4-3-25
Reciprocal Tariff Math: Hocus Pocus 4-3-25
Reciprocal Tariffs: Weird Science Blows up the Lab 4-2-25
Tariffs: Stop Hey What’s That Sound? 4-1-25
Tariffs are like a Box of Chocolates 4-1-25
Auto Tariffs: Questions to Ponder 3-28-25
Fed Gut Check, Tariff Reflux 3-22-25
Tariffs: Strange Week, Tactics Not the Point 3-15-25
Trade: Betty Ford Tariff Wing Open for Business 3-13-25
Auto Suppliers: Trade Groups have a View, Does Washington Even Ask? 3-11-25
Tariffs: Enemies List 3-6-25
Happy War on Allies Day 3-4-25
Auto Tariffs: Japan, South Korea, and Germany Exposure 2-25-25
Mini Market Lookback: Tariffs + Geopolitics + Human Nature = Risk 2-22-25
Reciprocal Tariffs: Weird Science 2-14-25
US-EU Trade: The Final Import/Export Mix 2024 2-11-25
Aluminum and Steel Tariffs: The Target is Canada 2-10-25
US-Mexico Trade: Import/Export Mix for 2024 2-10-25
Trade Exposure: US-Canada Import/Export Mix 2024 2-7-25
US Trade with the World: Import and Export Mix 2-6-25
The Trade Picture: Facts to Respect, Topics to Ponder 2-6-25