
Payrolls June 2025: Into the Weeds
The mix of the +147K nonfarm payroll growth raises questions on durability with half coming from government hiring.


Total nonfarm payrolls rose by +147K in June, which would be ample evidence of labor market resilience, but this month’s gains were concentrated in government payrolls. Private sector job gains slowed to +74K, marking the lowest growth since the hurricane-affected October 2024.
With a mixed bag of JOLTs and ADP data earlier this week in hand, a mixed signal today on private sector hiring will leave the Fed looking for another month’s worth of data on labor trends. The tariff-related expenses and pricing pressures are still lurking in the market as prebuilt inventories continue to obscure the full picture. Even with details on the Vietnam trade deal announced, the majority of key trade partner “deals” still need to be made with reciprocal tariff “deadline” as week away.
The positive news is that the core services sectors of the economy continued to produce positive payroll growth with Healthcare (+59K) and Leisure and Hospitality (+20K) still leading the way. However, the month saw a relatively wide breadth of payroll contractions as manufacturing in particular saw a -7K decline.
With durables and nondurable soft in jobs, there clearly is not a mad reshoring and expansion rush yet, so Bessent pitched the 100% capex ending today. We had that in the 2017 bill also. There still needs to be a good economic reason to build out capacity beyond tax planning. The sales pitch is tariffs will provide more incentive.
In our view, the overreliance of the payroll adds this month on public sector and healthcare suggests a cooling labor market. There will also be questions about what impact the Big Beautiful Bill will have on healthcare jobs across coming quarters. 2H25 kicks off for the Fed with both sides of the dual mandate still at risk of moving the wrong way and leaving a lot of eyes on the September meeting. The legislation just passed today will test the long-end (inflation, funding, etc.) of the curve on UST supply. The bill seeks to sell the story of counterbalancing growth incentives for the long-promised manufacturing renaissance.

The above chart covers the monthly deltas by key industry groupings that we track from Table B-1 of the Payrolls report. June at +147K is a welcome surprise for those that lowered their expectations after a negative ADP print. There were also some positive revisions in the backwards looking data that supports the ‘more jobs is better’ camp and makes the headlines look a bit better.
However, the line item mix of the payroll adds and even the revisions include evidence of weakening labor momentum. The core driver of payrolls this month is Government at +73K and specifically State and Local education at +63K. Whether a durable print or a timing quirk, it is not a sustainable source of continued payroll growth, leaving more importance to the July print on a one-month private sector dip or continued weakening trend.
The majority of the remaining growth came from +59K Healthcare, +20K Leisure and Hospitality, and +15K Construction adds. Healthcare has proven a very stable driver of payroll adds in recent times and will remain largely insulated from tariffs on the hospital and services side. In contrast pharma has material exposure to the tariffs ahead. The Big Beautiful Bill with Medicaid cuts could be a dampening factor.
The policy effects could change some of the growth trajectories, but Healthcare overall is set to remain a key noncyclical driver of labor growth on demographic need. On the other hand, the Leisure and Hospitality strength this month is less impressive than the already low print shows. The revisions added up to -30K payroll declines here, more than offsetting the +20K this month. That kind of offset gets overlooked but provides a gloomier outlook for more cyclical and discretionary consumer demand. The consumer data (PCE) has struggled lately.
The low bar of no contraction in the labor market was good enough for a positive reaction this morning, especially with digestion of moving parts of the Big Beautiful Bill set to pass. The market clearly has shown little deference to trade policy led volatility with the announcement of the Vietnam trade deal seemingly quickly overlooked by the market as well. The Fed will be watching closely though as tariff impacts are now set to fuel the debate around further upward pressure at the long end of the curve. How a potential rate cut gets framed against inflation pressures easing or labor market cooling will be a key focus. The FOMC median is still calling for two cuts this year.
Into the weeds…

The next series of charts break out granular detail of various occupation lines and industry groupings from this morning’s release with some key histories shown. We start with the broadest level that compares the Public and Private split and the Goods-Producing and Service-Providing sectors. The message this month is clear in a Government-led month where the Private to Public split is about 50/50 but the overall market is much closer to 85/15.
As we discussed, an outlier month of education gains at the State and Local level hides weakness in some of the underlying Private sector, especially as we see a continued struggle in Manufacturing this year. We still do not see standout effects directly linked to tariff policy and see weaker cyclical growth and still negative manufacturing numbers as an adverse signal. The shift towards more goods-producing capacity still has a long road ahead but the cost of tariffs whether on consumer demand dampening, rising prices, or rising unemployment is still a reality. The timing mismatch could still lead to near-term pain. The outstanding trade policy risk may be tempered as more trade deal details are announced, but retaliation risks still remain.

The overall manufacturing picture is shown above and the contraction this month is -7K, with -5K in Durable goods and -2K in Nondurables. The YTD Durables number of -12K continues the slide down with the LTM total now -85K. The pain this year has been focused in the Transportation sector but Computer and Electronics this month was the main driver down at -5K.
There is little positive news in the recent history above, but one that may see some good news from the tariff impact are the various metal-related lines that have seen minor growth this year as the 232 actions have given enough economic incentive to use domestic Steel and Aluminum suppliers. However, that still raises important questions around tradeoffs as the transportation lines weakness and other metals and materials-intensive supply chains face tough decisions amidst rising costs.

The Nondurables manufacturing lines are shown above with a rather unremarkable month though at least with more positives than negatives. We still view these as examples of declining domestic production needs and where no amount of tariff regimes could reignite significant domestic investment.

The Construction number this month was one of the few positive takeaways at +15K, even as some of the Building Construction lines shuffled to the Trade Contractors lines. The increase is a positive for optics, but more hiring of trade contractors may reflect project execution rather than new starts. There is plenty of need from power generation, but the overall outlook for breaking new ground looks rockier in the above.
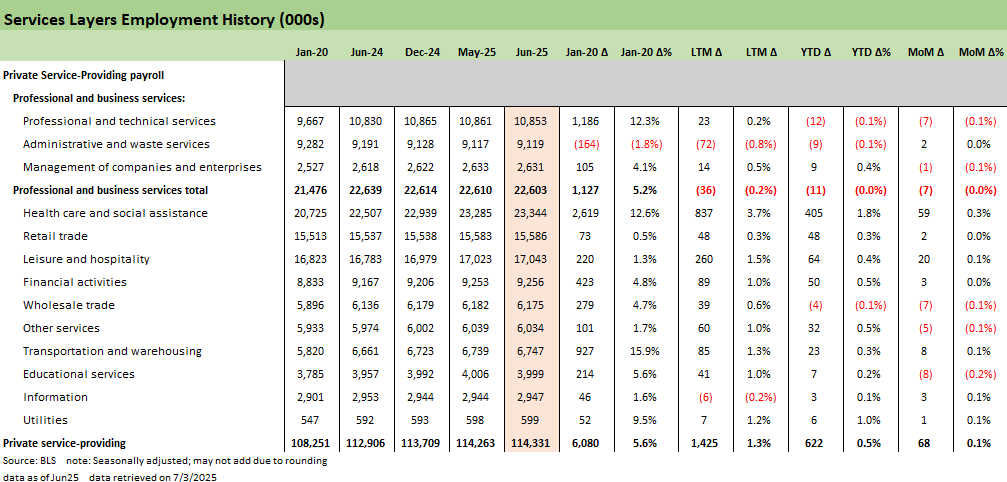
The Services lines are shown above, with the majority of growth usually stemming from the above lines. We covered some of the details already above, and the main standout continues to be the Healthcare lines. The YTD running total for Healthcare jobs is +405K out of +782K nonfarm payroll adds in 2025, vastly outstripping the growth rate elsewhere. That is not a new trend by any means, but with so many additional stress points for employers, we wonder whether the narrow breadth of payroll gains this year is masking signs of the labor market actually cooling. Overall, the numbers above are much more mixed with most industries closer to flat when excluding the larger moves in Healthcare and Leisure.

Last, we cover the Government employment lines that add up to an unusually large +73K. The State and Local numbers continue the trend of strong hiring from these sectors in the recent history as post-COVID sees State payrolls up 6% and Local up 4%. The growth here remains impressive, but this month has seen some questions around timing effects given the unusually large education numbers at the end of the school year.
See also:
Employment June 2025: A State and Local World 7-3-25
Asset Return Quilts for 2H24/1H25 7-1-25
JOLTS May 2025: Job Openings vs. Filling Openings 7-1-25
Midyear Excess Returns: Too little or just not losing? 7-1-25
Footnotes & Flashbacks: Credit Markets 6-30-25
Footnotes & Flashbacks: State of Yields 6-29-2025
Footnotes & Flashbacks: Asset Returns 6-29-2025
Mini Market Lookback: Eye of the Beholder 6-28-25
PCE May 2025: Personal Income and Outlays 6-27-25
Durable Goods May25: Aircraft Surge, Core Orders Modest Positive 6-26-25
1Q25 GDP: Final Estimate, Consumer Fade 6-26-25
New Home Sales May 2025: Slip and Slide 6-25-25
KB Home 2Q25: Negative Industry Trends Keep Coming 6-25-25
Existing Homes Sales May 2025: Sequential Stronger, YoY Weaker 6-23-25
Mini Market Lookback: FOMC Spoke Clearly, Iran and Trump up next 6-21-25
Lennar 2Q25: Bellwether Blues 6-20-25
FOMC Day: PCE Outlook Negative, GDP Expectations Grim 6-18-25
Home Starts May 2025: The Fade Continues 6-18-25
May 2025 Industrial Production: Motor Vehicle Cushion? 6-17-25
Retail Sales May 25: Demand Sugar Crash 6-17-25
Mini Market Lookback: Deus Vult or Deus Nobis Auxilium 6-14-25
Credit Snapshot: Hertz Global Holdings 6-12-23
CPI May 2025: The Slow Tariff Policy Grind 6-11-25
Mini Market Lookback: Clash of the Titans 6-7-25
Payrolls May 2025: Into the Weeds 6-6-25
US Trade in Goods April 2025: Imports Be Damned 6-5-25
Past-Prologue Perspective for 2025: Memory Lane 2018 6-5-25
Tariffs: Testing Trade Partner Mettle 6-3-25