
D.R. Horton 3Q25: Material Slowdown Still Good Enough
D.R. Horton (DHI) as the #1 homebuilder (by units) turned in a decent quarter relative to expectations and sent stocks flying.


The market justifiably has been anxious about the housing cycle and homebuilder expectations, but a big week for major builder earnings is already demonstrating the financial resilience even in the face of high single digit declines in revenue. We had D.R. Horton and Pulte on the screen today with steady sequential margins, resilient cash flow and constructive guidance that eases some anxiety even if volume and pricing are down YoY for DHI.
Closing volumes for the quarter beat the high end of guidance. Forward revenue guidance for FY 2025 was tightened and raised on the low end. Buybacks estimated for FY 2025 bumped higher from $4.0 bn to a range of $4.2 bn to $4.4 bn with dividend guidance flat at $500 mn. The capital allocation offers a fresh reminder of the exceptional cash flow fundamentals of the major builders.
Orders were flat for the June quarter (3Q25) while home closings were down by -4.1% YoY. The homebuilding gross margin of 21.8% was flat sequentially but down YoY from 24.0%.
Balance sheet liquidity and leverage remains extraordinary for a low A tier issuer with homebuilding inventory 12.5x net homebuilding debt. The stand-alone entities separate from the homebuilding operations are also stand-alone borrowers where the credit is not guaranteed by the homebuilding subsidiaries (see Credit Snapshot: D.R. Horton 4-28-25 , Credit Crib Note: D.R. Horton (DHI) 8-8-24, D.R. Horton: Credit Profile 4-4-23). That adds some extra asset protection value to the DHI bond story, but the consolidated leverage is quite low regardless.
This week will also see other major builder earnings and more signals on the housing markets from NVR, Taylor Morrison (TMHC), Meritage (MTH), M/I Homes (MHO), and Century Communities (CCS).
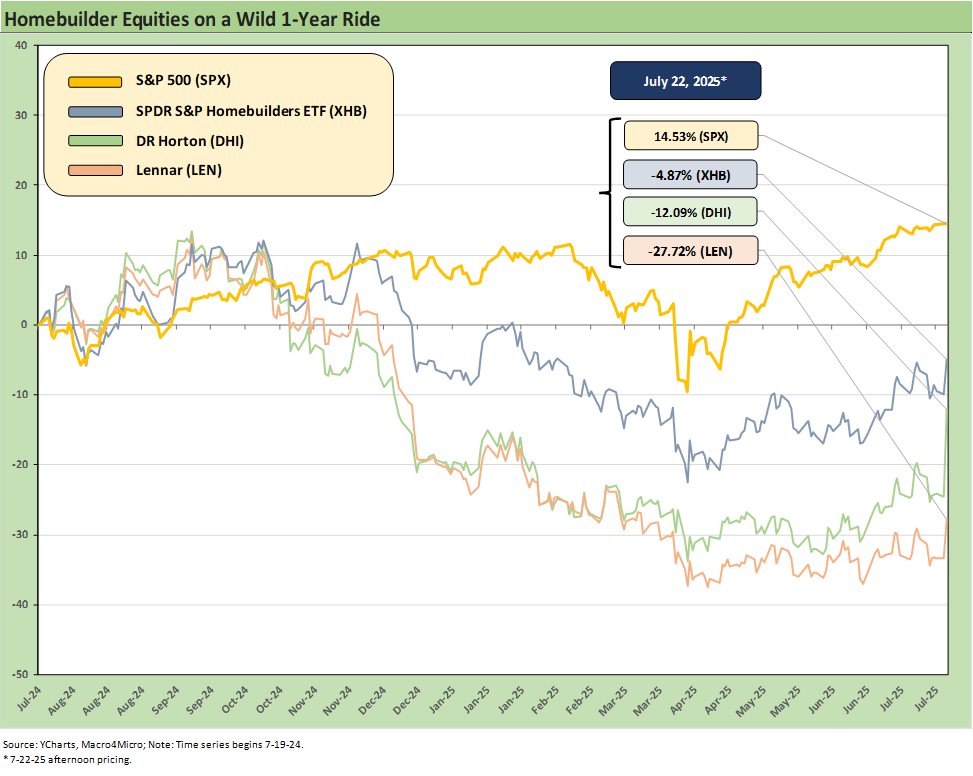
The above stock price return series frames the punishing stock price action for the homebuilders after leading the trailing 1-year return through the end of Sept 2024. As national scale bellwethers and industry leaders, DHI and LEN served as a housing sector proxy and underperformed the broader market and Homebuilder ETF (XHB), which also includes some major suppliers.
We cover the key drivers in our housing sector and single name research (see links at bottom), so we won’t revisit much of that here. In a “price x volume” business, volumes have been going the wrong way but pricing is also now struggling. The mix asterisk (region, product tier) is intrinsic to any time series on average selling prices, but the pressure has been forming for a while now.
The worry over a flagging consumer has been a recurring theme despite some constructive data points such as retail sales last week. Stubbornly high mortgage rates, materially higher home prices vs. that seen in the pre-COVID period are among the easy items to check off as drivers of the revaluation of homebuilder equities. Affordability strain remains a constant.
From a credit quality vantage point, however, the credit profile of the builders remains very much intact with strong balance sheets, exceptional asset coverage, and cash flow fundamentals that arguably deserve higher ratings even if the housing cycle keeps turning down.
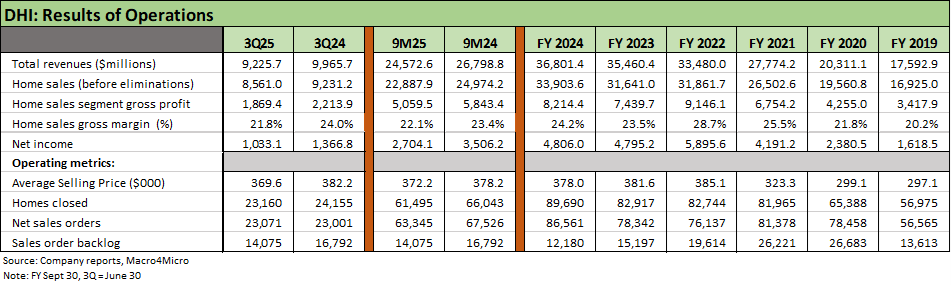
The above table updates a cross-section of key financial and operating metrics. We see volumes and average selling prices lower in 2025. DHI has one of the lowest ASPs among the major builders (see Homebuilder Rankings: Volumes, Market Caps, ASPs 5-28-25).
Gross margins in 3Q25 (June quarter for DHI with its Sept FY) came in better than expected despite all the challenges and remains above pre-COVID levels even if well down from the post-COVID peak of 2022 (28.7%). Orders and backlog are down through 9M ended 6-30-25 even if orders flattened out in 3Q25 vs. 3Q24.
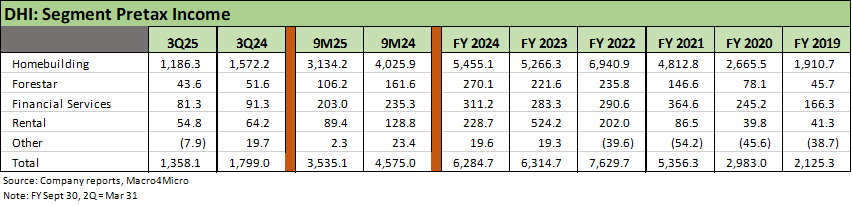
The above table updates the “consolidating” segment disclosure across the various DHI business lines including Forestar (land and lot development), rental building operations (single family and multifamily), and financial services. Separate from this disclosure is the geographic segment details for the homebuilding operations, but that awaits the 10Q. The business line segment disclosure above show how all business units have seen declining pretax earnings in 2025.
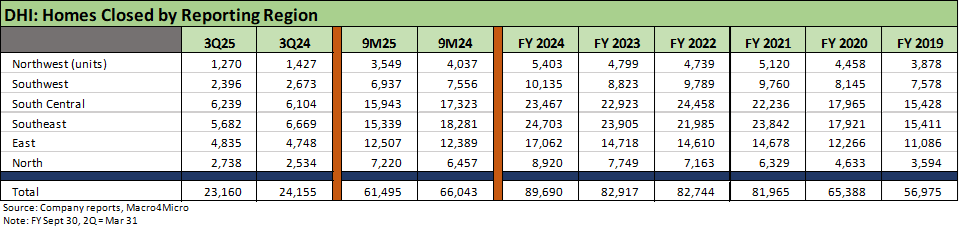
Volume has been going the wrong way for the industry as well as DHI, and we see 3 of 6 geographic segments moving lower to an overall decline on total closings. Some regions have been more resilient than others.
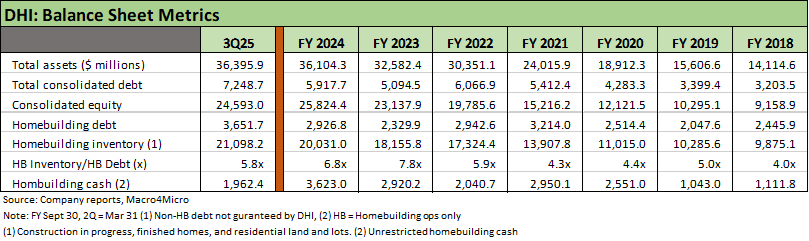
The above table updates the key balance sheet lines and underscores the solid liquidity and substantial excess asset coverage even just looking at inventory lines vs. total debt. DHI’s market cap is in excess of $40 billion and compares favorably relative to DHI’s low net debt and total debt numbers.
We highlight that the non-homebuilding debt is not guaranteed by the same homebuilding subsidiaries that are guarantors for the homebuilding debt/bonds. Each of the other business line units – Rental, Forestar, Financial Services – are stand-alone credits that support their own debt.
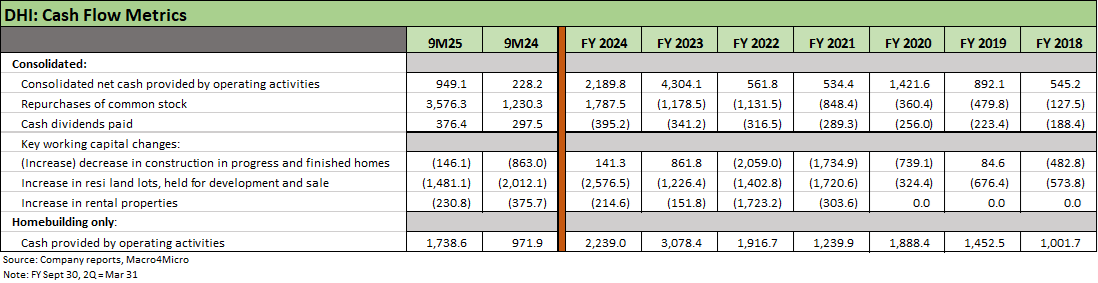
The above table updates the operating cash flow data along with some of the major moving parts of the working capital lines and capital allocation trends. We see the impressive level of stock buybacks and dividends. The stand-alone cash flow of the homebuilding operations is also highlighted at the bottom of the table. That massive base of free cash flow helps bondholders sleep at night even if the market faces a more notable downturn as inventory gets liquidated and translates into cash flow generation.
Housing sector:
Housing Starts June 2025: Single Family Slips, Multifamily Bounces 7-18-25
New Home Sales May 2025: Slip and Slide 6-25-25
Existing Homes Sales May 2025: Sequential Stronger, YoY Weaker 6-23-25
Homebuilders:
KB Home 2Q25: Negative Industry Trends Keep Coming 6-25-25
Lennar 2Q25: Bellwether Blues 6-20-25
Credit Snapshot: Meritage Homes (MTH) 5-30-25
Homebuilder Rankings: Volumes, Market Caps, ASPs 5-28-25
Credit Snapshot: PulteGroup (PHM) 5-7-25
Credit Snapshot: Toll Brothers 5-5-25
Credit Snapshot: D.R. Horton (DHI) 4-28-25
Credit Snapshot: Lennar (LEN) 4-15-25
Credit Snapshot: Taylor Morrison Home Corp (TMHC) 4-2-25
Lennar: Cash Flow and Balance Sheet > Gross Margins 3-24-25
KB Home 1Q25: The Consumer Theme Piles On 3-25-25
Toll Brothers 1Q25: Performing with a Net 2-20-25
Credit Crib Note: Lennar Corp (LEN) 1-30-25
D.R. Horton: #1 Homebuilder as a Sector Proxy 1-28-25
KB Home 4Q24: Strong Finish Despite Mortgage Rates 1-14-25
See also:
Credit Snapshot: Ashtead Group 7-21-25
Footnotes & Flashbacks: Credit Markets 7-21-25
Footnotes & Flashbacks: State of Yields 7-20-25
Footnotes & Flashbacks: Asset Returns 7-20-25
Mini Market Lookback: Macro Muddle, Political Spin 7-19-25
Retail Sales Jun25: Staying Afloat 7-17-25
June 2025 Industrial Production: 2Q25 Growth, June Steady 7-16-25
CPI June 2025: Slow Flowthrough but Starting 7-15-25
Mini Market Lookback: Tariffs Run Amok, Part Deux 7-12-25
Mini Market Lookback: Bracing for Tariff Impact 7-5-25
Payrolls June 2025: Into the Weeds 7-3-25
Employment June 2025: A State and Local World 7-3-25
Asset Return Quilts for 2H24/1H25 7-1-25
JOLTS May 2025: Job Openings vs. Filling Openings 7-1-25
Midyear Excess Returns: Too little or just not losing? 7-1-25