
Taylor Morrison 2Q25: Resilient but Feeling the Same Macro Pressure
Taylor Morrison delivered mixed numbers in 2Q25: revenue up, closings up, prices down, orders down, margins modestly lower.


In a very busy week for homebuilder reporting, Taylor Morrison (TMHC) posted up a reasonable quarter in industry context including higher volumes that more than offset lower prices and generated higher home sales revenues. Then again, the lower orders at TMHC reinforce the housing sector pressures we have heard about in other earnings calls.
We still see TMHC well positioned to be investment grade on the balance of factors, but the balance sheet progress has been slowed in the capital allocation balancing act. Inventory remains more than triple total homebuilding debt, and the cash flow resilience has a lot of risk-mitigating value for bondholders during a period of cyclical debate.
The macro crossroads for homebuilders right now is a cyclical slowdown that could feed more optimistic mortgage rates and yield curve scenarios that would give the housing sector the lift it needs if mortgage rates retrace to the 6% area seen with the Sept 2024 easing.
The flip side of the favorable mortgage rate scenario is any tariff-driven inflation or stagflation would take a negative toll. Any setback in housing would need portfolio context since a curve steepening or stagflation bout flows into a lot of portfolio line items and a broader repricing of credit risks. Homebuilders have the intrinsic cushion of inventory liquidation that generates cash flow in slowing markets.
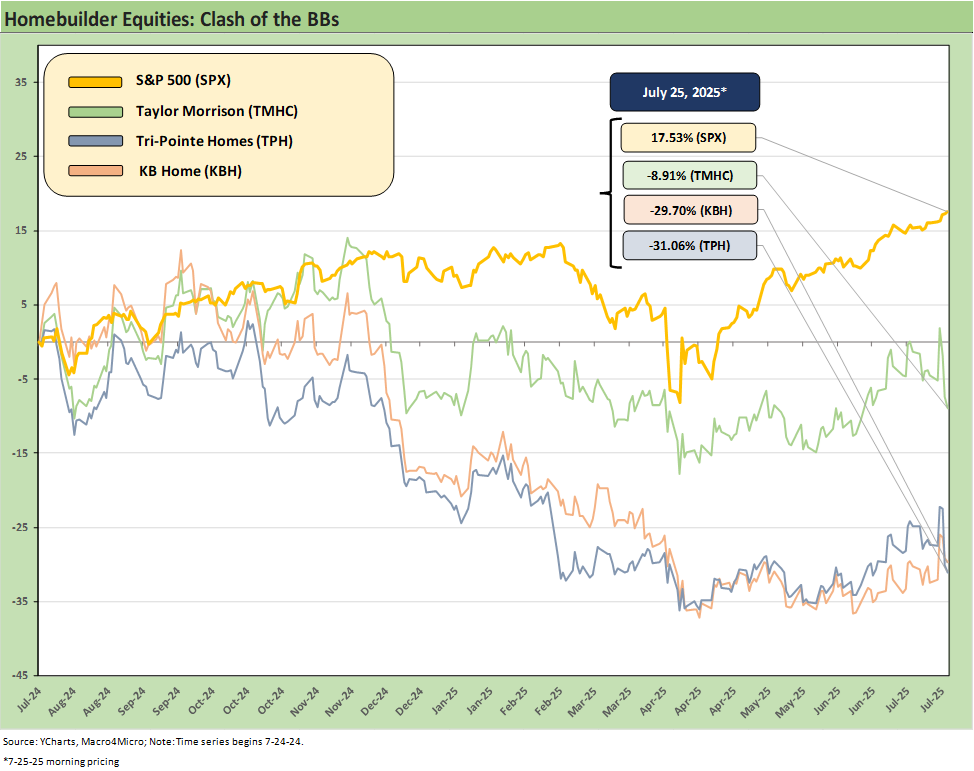
The above chart frames TMHC against some other bellwether BB tier homebuilding bond issuers – KB Home (KBH) and Tri Pointe (TPH). TMHC is a name we have had a positive view on and still do in peer group context (see Credit Snapshot: Taylor Morrison Home Corp (TMHC) 4-2-25, Credit Crib Note: Taylor Morrison Home Corp 5-20-24).
TMHC is a solid high BB tier composite and remains well positioned even though the builders are heading into a soft patch as covered in our housing sector macro commentaries and single name work (see links at bottom). TMHC has 3 index bonds with relatively short maturities (2027, 2028, 2030) and 5% handle coupons.
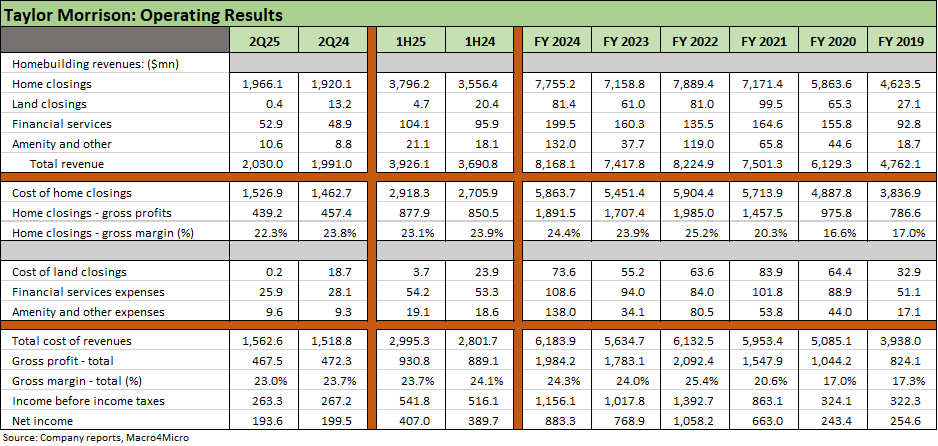
The above table details the operating results for TMHC with the headline numbers showing higher home closing revenues for 2Q25 and 1H25. Financial services revenue is also higher for both 2Q25 and 1H25. As we detail in the next chart, TMHC posted higher volumes in 2Q25 but slightly lower ASPs.
The wind down of the peak period in 2025 will see the housing sector turn on pricing strategies and mortgage rates. The homebuilders – like the potential existing home sellers – need to make a decision on pricing to clear the market and push transaction volumes higher. Many potential buyers (first time or move-up) are waiting for a clear read on where mortgage rates will head in the broader market whether that UST move is tied in part to the fed or to the broader economic and inflation impacts (tariffs, etc.) on the 10Y UST that drives 30Y mortgage rates.
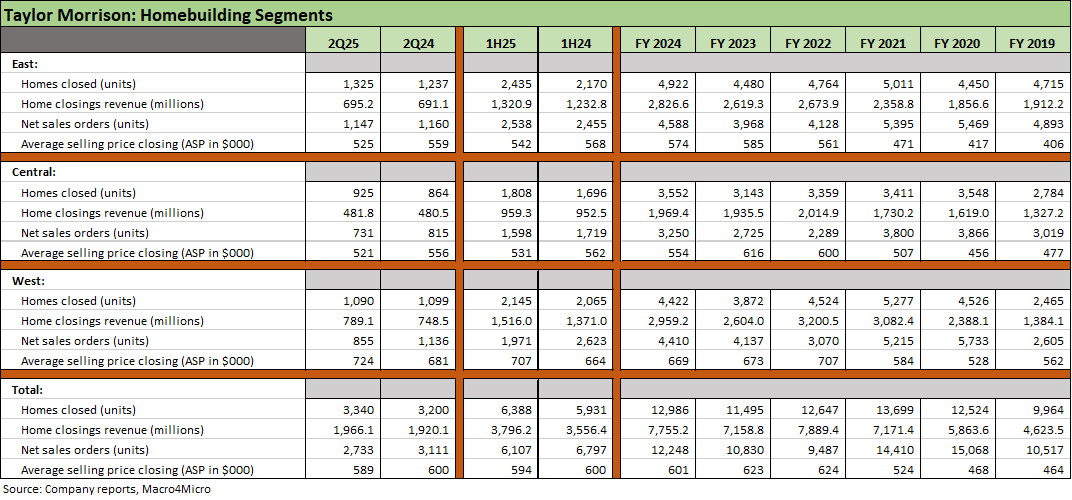
The above table digs into the three geographic segments and related metrics. The homebuilders tend to be more creative in how they classify different regional segment breakdowns. The “East” for TMHC is heavy on Florida metro areas and also includes Atlanta and Charlotte. “Central” includes the major Texas metros plus Denver and Indianapolis. The “West” includes Southern California, the Bay Area, Sacramento, Las Vegas, Phoenix, and Seattle as well as Portland.
As a reminder (see Credit Crib Note: Taylor Morrison Home Corp 5-20-24), TMHC made its big expansion push with the acquisition of AV Homes in 2018 and William Lyon (announced 2019, closed Feb 2020). Those deals took TMHC into the upper tier of builders (note: you see the jump in revenue above and assets below from 2019 to 2020).
For the 2Q25 quarter, we see favorable volume trends in the East with closed homes higher and a decline in orders. For Central, closed homes also rose but orders declined more sharply. The West was “flattish” in closings but also down in orders. The TMHC metrics across regions is a reminder that the timing of community openings and the use of incentives and pricing strategies is still a “quarter-in, quarter-out” battle.
For the 2Q25 numbers in the most recent report, the East gross margins declined from 26.3% to 23.7% for the 3 months. The Central segment saw 2Q25 gross margins drop from 25.3% to 21.9%. The West held in better with segment gross margins rising from 20.8% to 23.1%. For six months, the East decline was more muted at 26.6% to 25.2% while the Central numbers saw a decline from 25.7% to 23.1%. The West weighed in with a rise in gross margins from 20.4% to 23.3%. In industry context, these are good margins and higher than the 2019-2021 levels at TMHC.
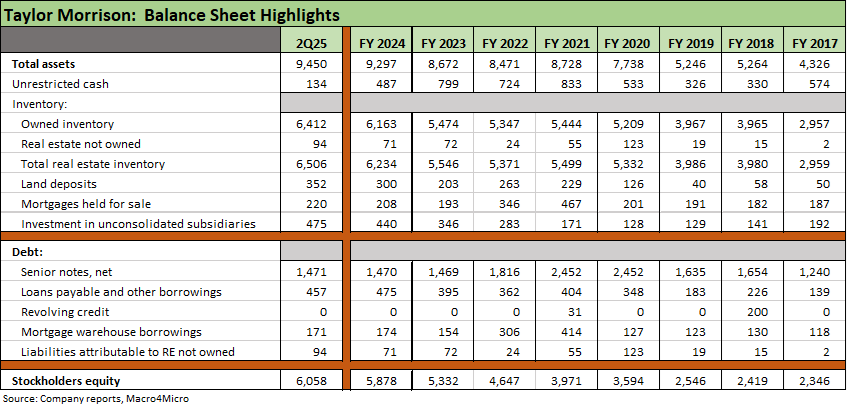
The above table updates the balance sheet history, and we see assets more than doubling from 2017 on the AV Homes and William Lyon acquisitions as well as on organic growth and steady investment that ran alongside the ZIRP years and a range of housing trends covered in other commentaries. The seasonal downtick of cash with the inventory build and buybacks is not significant at this point.
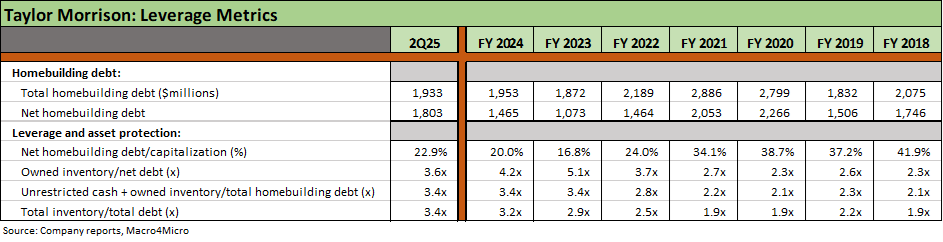
The above table breaks out some book value leverage metrics and asset coverage ratios we like to use to frame the relative balance sheet comfort zone in a slowdown. The ratio of owned inventory to net debt of 3.6x is solid and especially when you consider that any slowdown or defensiveness around inventory levels can drive house/lot liquidation and generate more cash flow. It also typically leads to slower growth plans or an outright decline in land spend and development outlays.
The total inventory to total homebuilder debt ratio of 3.4x is also quite strong even if nowhere near the much higher multiples seen with high BBB and low A tier builders. TMHC bonds trade more like a BBB tier corporate issuer than a BB for good reason.
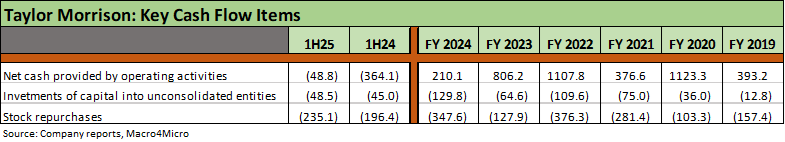
The above table gives a simple view of some key cash flow lines with the main one for TMHC being its relative scale of buybacks across time since the last fiscal year before COVID. For some context on the rate of buybacks in 2025, TMHC indicates the company will buy back at least $350 mn in shares relative to an equity market cap of $6.0 billion (7-25-25). That is a relatively aggressive buyback at just under 6% of market cap (note: TMHC does not pay a dividend).
Housing sector:
New Home Sales June 2025: Mixed Bag 7-24-25
Existing Home Sales June 2025: The Math Still Doesn’t Work 7-23-25
Housing Starts June 2025: Single Family Slips, Multifamily Bounces 7-18-25
Homebuilders:
PulteGroup 2Q25: Still-Lofty Margins see a Mild Fade 7-23-25
D.R. Horton 3Q25: Material Slowdown Still Good Enough 7-22-25
KB Home 2Q25: Negative Industry Trends Keep Coming 6-25-25
Lennar 2Q25: Bellwether Blues 6-20-25
Credit Snapshot: Meritage Homes (MTH) 5-30-25
Homebuilder Rankings: Volumes, Market Caps, ASPs 5-28-25
Credit Snapshot: PulteGroup (PHM) 5-7-25
Credit Snapshot: Toll Brothers 5-5-25
Credit Snapshot: D.R. Horton (DHI) 4-28-25
Credit Snapshot: Lennar (LEN) 4-15-25
Credit Snapshot: Taylor Morrison Home Corp (TMHC) 4-2-25
Lennar: Cash Flow and Balance Sheet > Gross Margins 3-24-25
KB Home 1Q25: The Consumer Theme Piles On 3-25-25
Toll Brothers 1Q25: Performing with a Net 2-20-25
Credit Crib Note: Lennar Corp (LEN) 1-30-25
D.R. Horton: #1 Homebuilder as a Sector Proxy 1-28-25
KB Home 4Q24: Strong Finish Despite Mortgage Rates 1-14-25
See also:
Credit Snapshot: Ashtead Group 7-21-25
Footnotes & Flashbacks: Credit Markets 7-21-25
Footnotes & Flashbacks: State of Yields 7-20-25
Footnotes & Flashbacks: Asset Returns 7-20-25
Mini Market Lookback: Macro Muddle, Political Spin 7-19-25
Retail Sales Jun25: Staying Afloat 7-17-25
June 2025 Industrial Production: 2Q25 Growth, June Steady 7-16-25
CPI June 2025: Slow Flowthrough but Starting 7-15-25
Mini Market Lookback: Tariffs Run Amok, Part Deux 7-12-25
Mini Market Lookback: Bracing for Tariff Impact 7-5-25
Payrolls June 2025: Into the Weeds 7-3-25
Employment June 2025: A State and Local World 7-3-25
Asset Return Quilts for 2H24/1H25 7-1-25
JOLTS May 2025: Job Openings vs. Filling Openings 7-1-25
Midyear Excess Returns: Too little or just not losing? 7-1-25