
Existing Home Sales June 2025: The Math Still Doesn’t Work
June existing home sales saw median prices hit the highest ever, even while inventories remain well above the early 2022 lows.


Still trying to figure out this “inventory higher, prices higher, volumes slower” thing…
Flat volumes YoY for existing home sales and a slight decline sequentially (-2.7%) reflect many of the same variables that have kept transaction volumes under pressure and the bid-offer seller-buyer gap with existing inventory higher YoY as prices keep rising.
The steady climb in home equity is good news for net worth on the books, but the impaired mobility and locked in mortgages (“golden handcuffs”) remains a challenge with homebuilders even citing it as undermining their move-up segment business.
We saw 3 of 4 regions post lower volumes (South, Midwest, Northeast) including the critical South region with its leading share (46%) of existing single family home (note: the South is even higher for new home sales at 56%).
The above chart shows the sales deltas by price tier, and we see broad increases ex-the lowest price bucket. These numbers are generated on a “Not Seasonally Adjusted” (NSA) basis rather than a SAAR basis. We see 5 of the 6 tiers higher YoY. We look at this mix from a different angle in the final chart in this collection. We see a major disconnect between the SAAR and NSA data this month in framing a trend.
The lower price tier can more logically get squeezed out based on mortgage qualifications and monthly payment stress. That is a pattern we have seen frequently over the past year and seems likely to remain a factor with mortgage rates getting back into the high 6% zone lately. The rising price trends are not helping the affordability challenge, but mortgage rates are a very important variable for monthly payments.
The barriers to selling in a “move up” trade, to downsize, and/or to make an empty nester change still faces the “locked in” mortgage problem of trying to sell a 3% or 4% mortgage house and take on a high 6% to low 7% mortgage on other side of the trade. That is not a new problem, but it gets harder for sellers/buyers to capitulate and transact when the mortgage market stays stubborn. Diminished cyclical confidence along with consumer sentiment has been a factor as well.
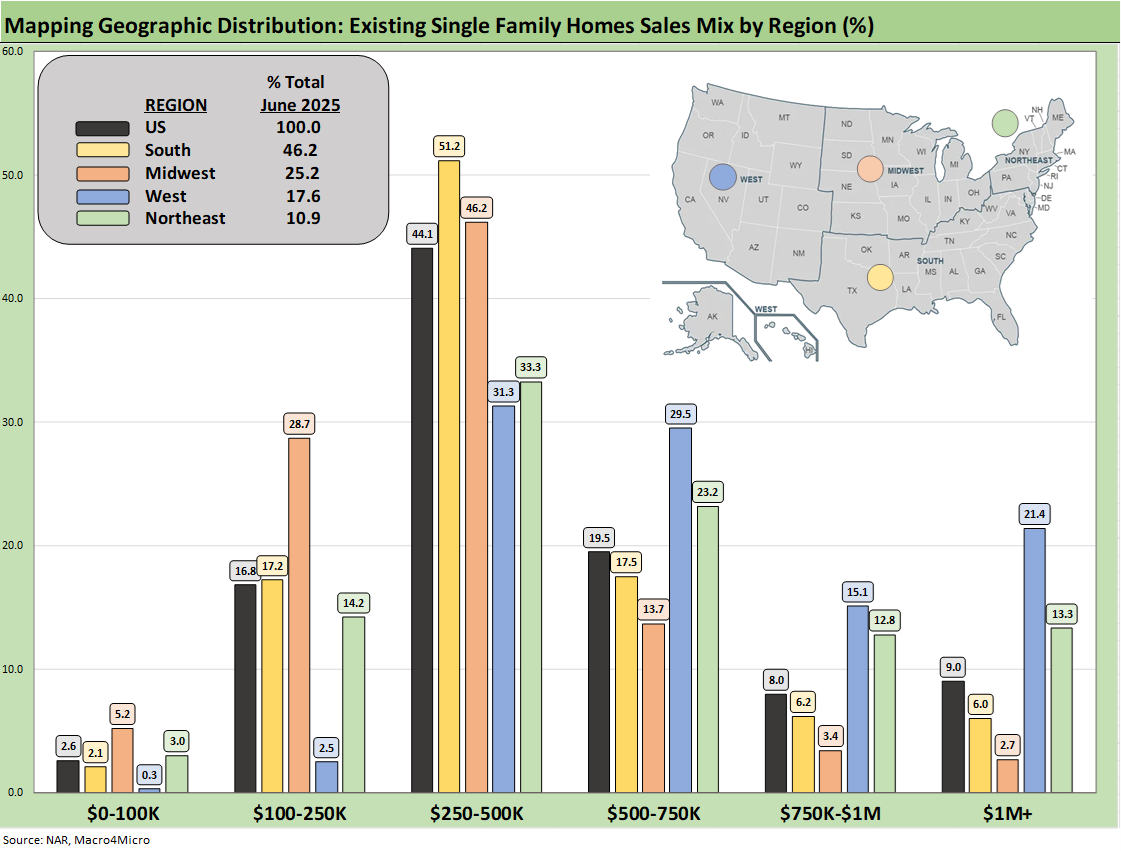
The above chart shows the geographic mix of volumes and details on price mix by region. The South is the main event in single family volumes whether new or existing at around 46% of volumes for single family existing.
For the bar chart, we break out the mix for each region by price tier. For example, the South shows almost 51% of its existing home sales volume in the $250k to $500K and over 17% of its sales in the $500 to $750K bucket. The bars for each region add up to 100% (occasionally a rounding miss). The high cost of homes in the West (notably California) is clear enough in the West price mix just by glancing at the bar chart with 21% at prices over $1 million. The second highest in the $1 million club is the Northeast at 13%.
We see a big concentration in the $250K to $500K bracket for all regions at over 44% of the total and a heavy weighting in the $100K to $250K bracket for the Midwest at almost 29%. The map explains what states are in each Census region. There is a very wide range of home price profiles in the West and Midwest.
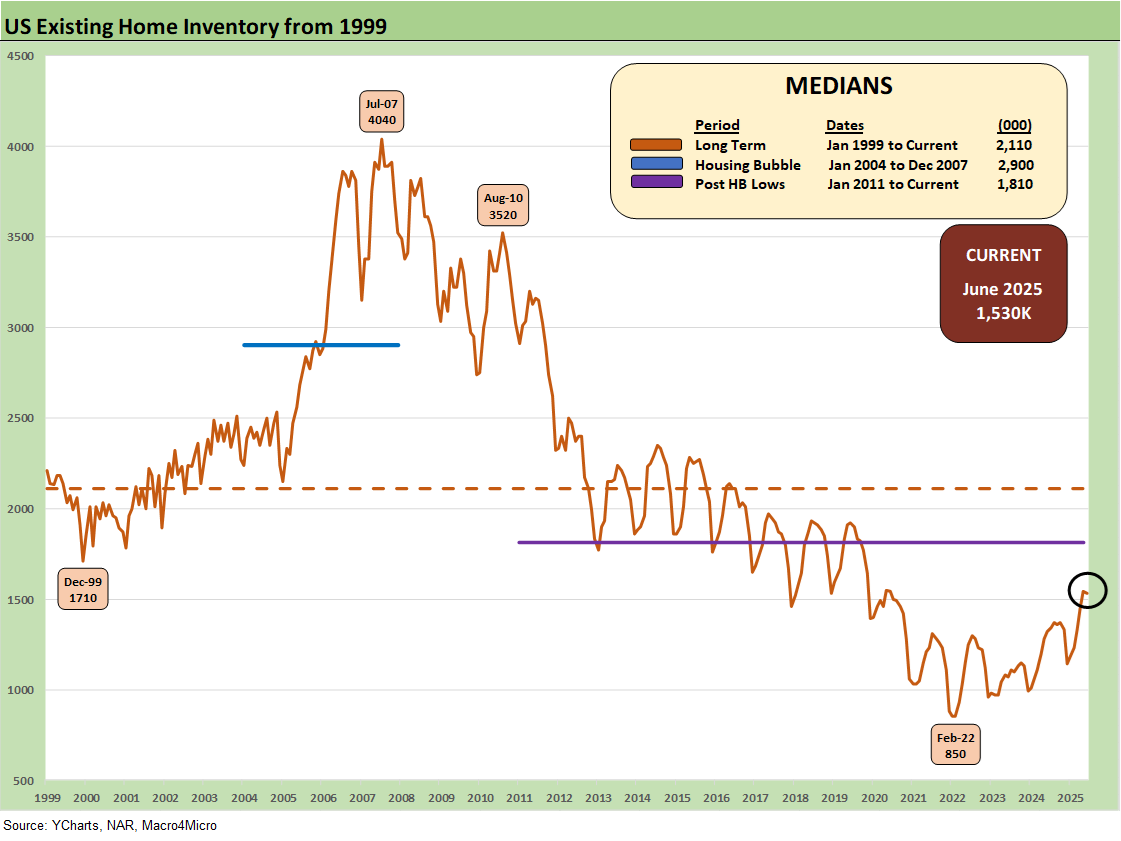
Inventory ticked lower slightly by -0.6% to 1.53 million units but almost 16% higher YoY after rising by over 20% in May. The existing home inventory balance has shown a steady rise off the sub-1 million lows of 2022-2023. Inventory had risen into the 1.3 million handle range in 2024 before dipping back down to a recent low of 1.14 million to close out 2024. We have bounced off those numbers in 2025 to get back to the current 1.53 million.
We see the Feb 2022 lows at 850K above when demand was very high just before the tightening cycle kicked into gear in March 2022. Separately, single family home inventory is up by +15.5% YoY and flat at 0% sequentially. Condos and Co-op inventory is up by +18.3% YoY but -1.5% from May 2025.
The ability of prices to push higher to a new record in the face of rising YoY inventory has been one of the more multilayered issues across price tiers and regions. Whether it is the time-honored gaps between seller and buyer or the belief that a sharp yield curve move could favor one side or the other, volumes suffer (and brokers are not too happy either).
We see the NAR focusing on 6.0% as the trigger point for a sharp rise in sales. The mortgage market was last at 6% in Sept 2024 around the FOMC easing but only briefly before the UST curve went higher and steeper and took mortgage rates along with it. Fed funds cuts (that was 100 bps in 3 moves) are not magic for mortgages.
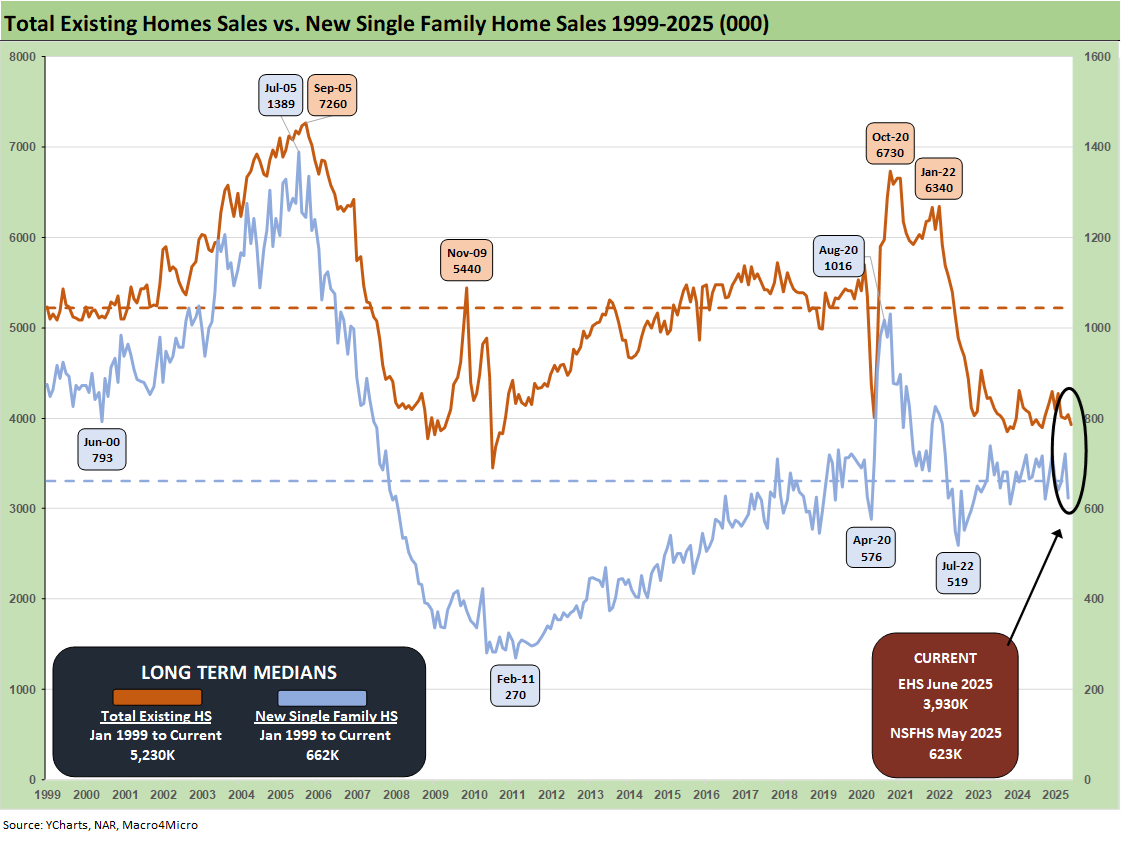
The above two-sided chart updates the trend line in total existing home sales vs. new single family homes. We get the new home sales numbers for June on Thursday, so we include the May 2025 new home number above. With mortgage rates in the high 6% range again and Freddie Mac’s benchmark at 6.75% as set last Thursday (fresh number tomorrow), the affordability headwinds remain alive.
Color from the homebuilders in some recent earnings reports has been somewhat mixed. The feedback from 1Q25 and recent 2Q25 reports so far is that the mortgage buydowns and incentives have not been as effective in the new home sales market even as the existing home sales markets are still seeing a gap between what the seller wants and how the buyer sees the world. The price expectation gap in turn continues to undermine transaction volumes.
We see a continued rise in inventory and higher median prices, which show that the existing home sales market remains in somewhat of a state of dysfunction. That reinforces the view that there are some expectation challenges in the buyer and seller ranks.
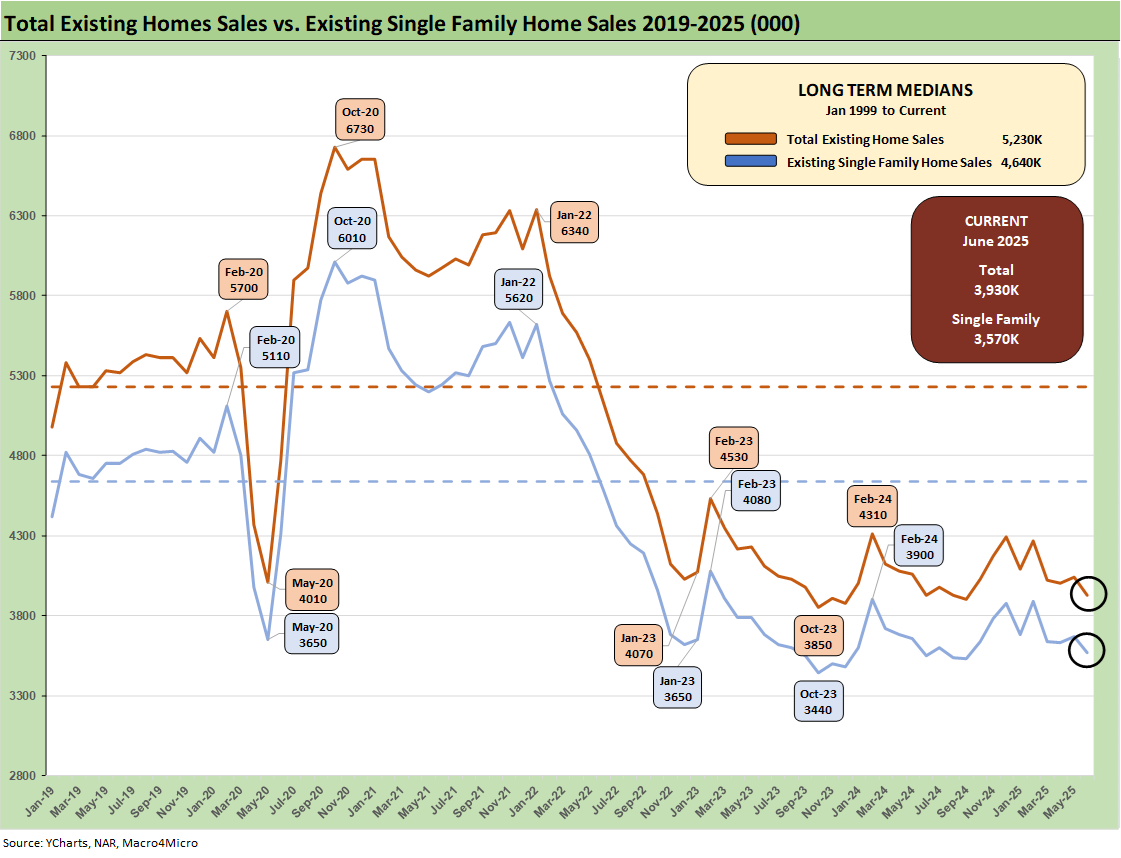
The above chart breaks out the timeline for single family alone of 3.57 million vs. total existing home sales of 3.93 million, which is well below the long-term median (from Jan 1999) of 5.23 million for total existing homes. Single family was -3.0% sequentially and +0.6% YoY. The lower line is ex-condo/ex-co-ops. We saw 360K in condos and co-ops in June 2025, up from 380K in June 2024 (revised) and flat with 360K in May 2025.
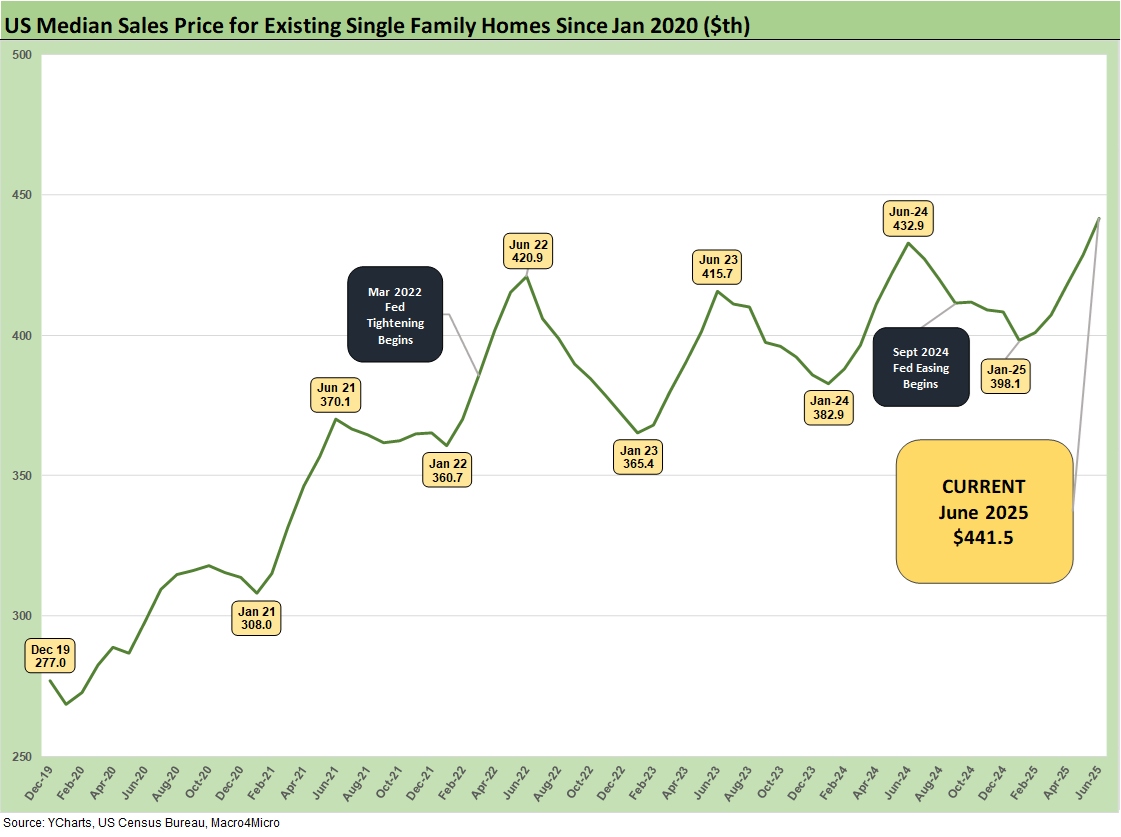
The above chart updates the median price for existing single family homes at a record $441.5 K. June 2025 eclipsed the June 2024 high of $432.9K. The median price in June 2025 is dramatically above the $308K back in Jan 2021 and $277K in Dec 2019 when mortgage rates were in a different zip code.
Potential sellers and buyers had some recent mortgage relief in the low 6% range in late Sept and early Oct before rates pushed back to the 7% area. We saw 6.75% posted by Freddie Mac’s benchmark in the most recent set of weekly changes. Mortgage News Daily survey was at 6.78%.
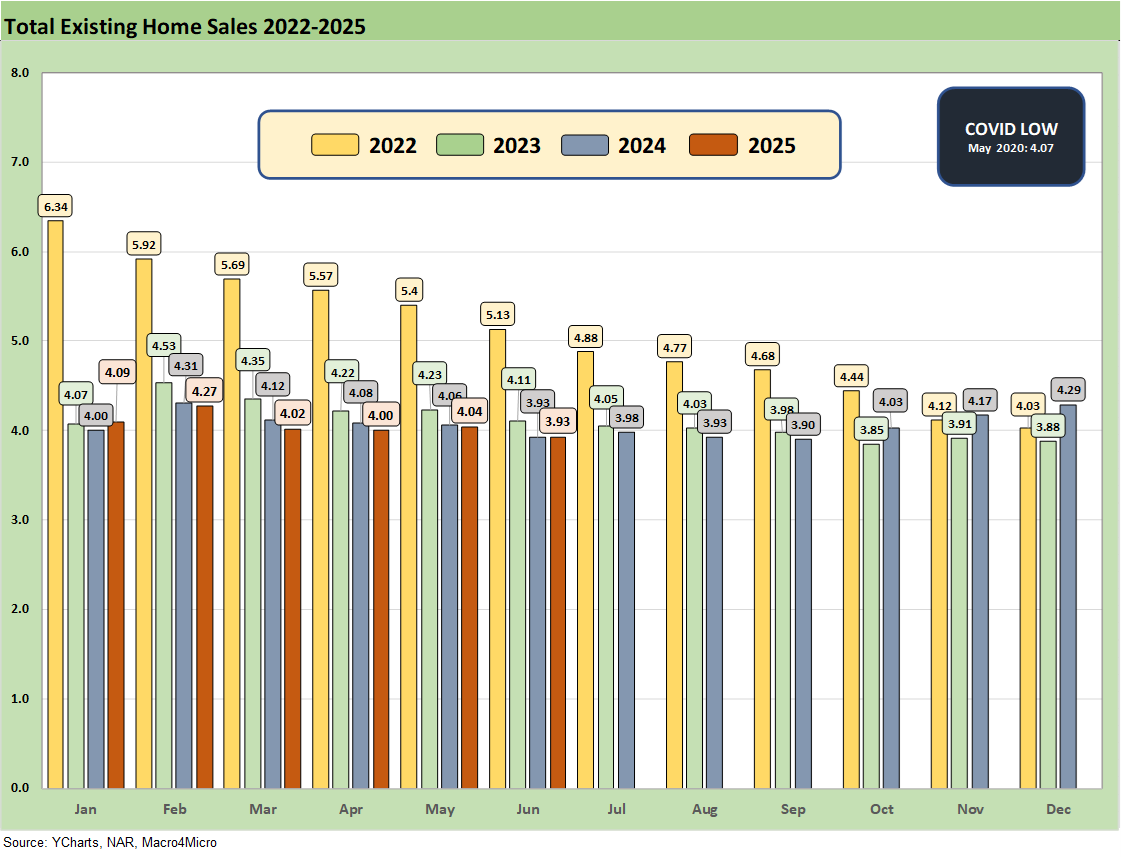
The above chart updates the monthly existing home sales across the timeline from Jan 2022 through June 2025. The existing home sales volume is a long way from the mid-6 and high 5 million handles of 2021 and then into early 2022 when many homeowners refinanced, and new buyers locked in low mortgages. ZIRP ended in March 2022 and then the UST migration began.
The June 2025 total of 3.93 million is below the May 2020 COVID trough of 4.07, so there are not too many bragging rights in current run rates. We had a few more sub-4 million handles along the way as noted in the chart, so this has been a brutal period for real estate brokers.
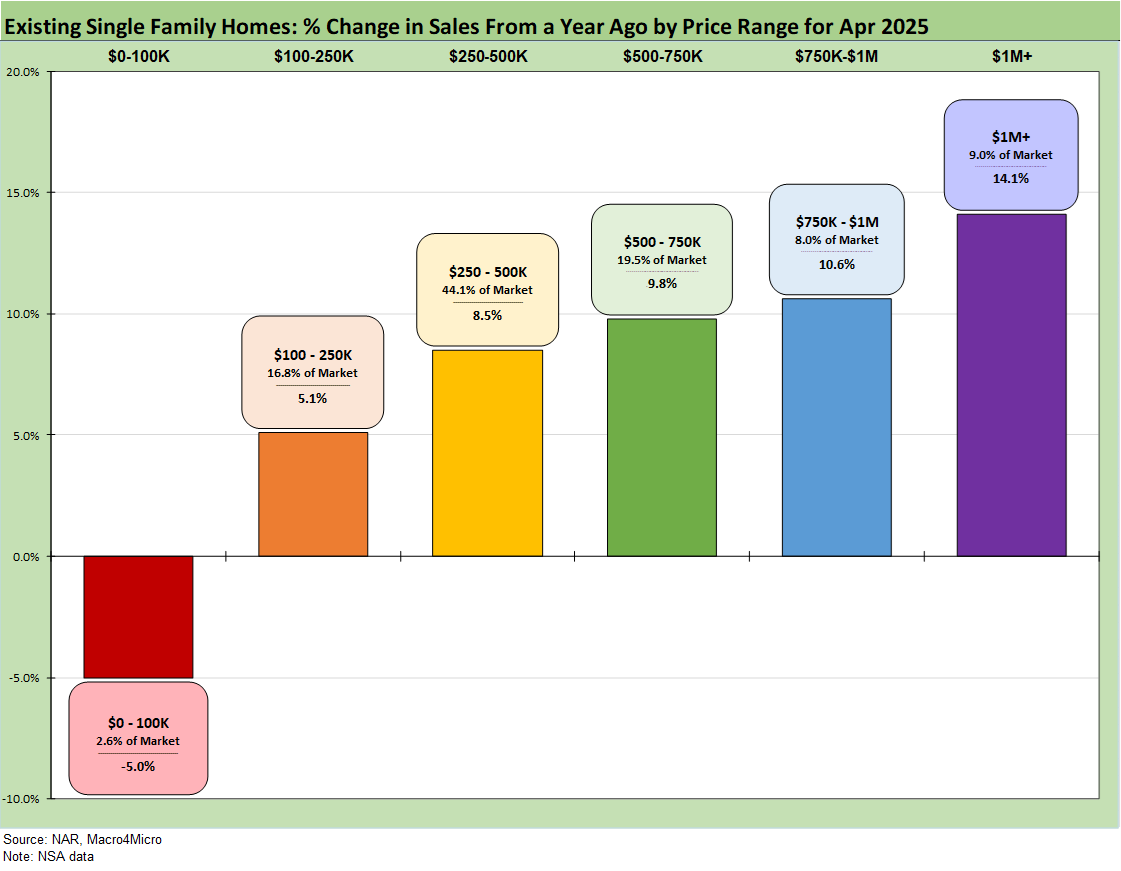
The above chart revisits the topical area addressed earlier on the existing home sales deltas by price tier. These are not seasonally adjusted (NSA) numbers provided by the NAR, and there are some material clashes with SAAR and NSA this month. The largest tier is the $250K to $500K at over 44% of sales volumes, and that was at +8.5% in a month that is in the peak selling season.
June 2025 existing home sales comes not long after March 2025 saw headlines such as the “lowest since spring 2009” tag. As a frame of reference, March 2009 was when the S&P 500 hit a low and GE Capital was trading in the credit markets like a high-risk name with major bankruptcies soon arriving in autos as the spring unfolded.
The challenge for the lower tier buyer is not as evident this month with the $100K to $250K tier at +5.1% in a tier that comprises 16.8 % of volume. The $500K to $750K tier is 19.5% of the market and was up by +9.8% for June using NSA numbers. We see the $1+ million up by +14.1% for June. The highest price tier is +9.0% of the market.
Housing sector:
Housing Starts June 2025: Single Family Slips, Multifamily Bounces 7-18-25
New Home Sales May 2025: Slip and Slide 6-25-25
Existing Homes Sales May 2025: Sequential Stronger, YoY Weaker 6-23-25
Homebuilders:
PulteGroup 2Q25: Still-Lofty Margins see a Mild Fade 7-23-25
D.R. Horton 3Q25: Material Slowdown Still Good Enough 7-22-25
KB Home 2Q25: Negative Industry Trends Keep Coming 6-25-25
Lennar 2Q25: Bellwether Blues 6-20-25
Credit Snapshot: Meritage Homes (MTH) 5-30-25
Homebuilder Rankings: Volumes, Market Caps, ASPs 5-28-25
Credit Snapshot: PulteGroup (PHM) 5-7-25
Credit Snapshot: Toll Brothers 5-5-25
Credit Snapshot: D.R. Horton (DHI) 4-28-25
Credit Snapshot: Lennar (LEN) 4-15-25
Credit Snapshot: Taylor Morrison Home Corp (TMHC) 4-2-25
Lennar: Cash Flow and Balance Sheet > Gross Margins 3-24-25
KB Home 1Q25: The Consumer Theme Piles On 3-25-25
Toll Brothers 1Q25: Performing with a Net 2-20-25
Credit Crib Note: Lennar Corp (LEN) 1-30-25
D.R. Horton: #1 Homebuilder as a Sector Proxy 1-28-25
KB Home 4Q24: Strong Finish Despite Mortgage Rates 1-14-25
See also:
Credit Snapshot: Ashtead Group 7-21-25
Footnotes & Flashbacks: Credit Markets 7-21-25
Footnotes & Flashbacks: State of Yields 7-20-25
Footnotes & Flashbacks: Asset Returns 7-20-25
Mini Market Lookback: Macro Muddle, Political Spin 7-19-25
Retail Sales Jun25: Staying Afloat 7-17-25
June 2025 Industrial Production: 2Q25 Growth, June Steady 7-16-25
CPI June 2025: Slow Flowthrough but Starting 7-15-25
Mini Market Lookback: Tariffs Run Amok, Part Deux 7-12-25
Mini Market Lookback: Bracing for Tariff Impact 7-5-25
Payrolls June 2025: Into the Weeds 7-3-25
Employment June 2025: A State and Local World 7-3-25
Asset Return Quilts for 2H24/1H25 7-1-25
JOLTS May 2025: Job Openings vs. Filling Openings 7-1-25
Midyear Excess Returns: Too little or just not losing? 7-1-25