
Tariff Man Meets Lord Jim
We look at the import and export mix of Thailand and Malaysia as a fresh round of tariff action promises more expense pressure for US buyers.


We follow up on some more Asian trade partners – Thailand and Malaysia – as food for thought as investors ponder how the tariffs will have to flow through to “somewhere” as the buyers/importers write the check to customs and those tariff payments need to find an economic outcome on the other side.
Trump stayed on his “selling country pays” bender in a televised cabinet meeting and Q&A today. He dragged his trade head into the theme of “taking in record amounts” of cash from countries as part of his “lie by repetition” strategy. He even managed to toss in “rigged election” a few times so “seller pays the tariff” did not feel lonely.
Trump is getting more aggressive with each passing week as he added a 50% Section 232 copper tariff today in his cabinet meeting and threatened a “very, very high rate, like 200%” on pharmaceuticals. Just given the nature of the person, we cannot rule out that he may actually believe the selling nations do pay the tariff. A tariff of that scale on pharma would virtually assure a trade war with the EU given the outsized role of pharma imports in EU-US trade (see US-EU Trade: The Final Import/Export Mix 2024 2-11-25).
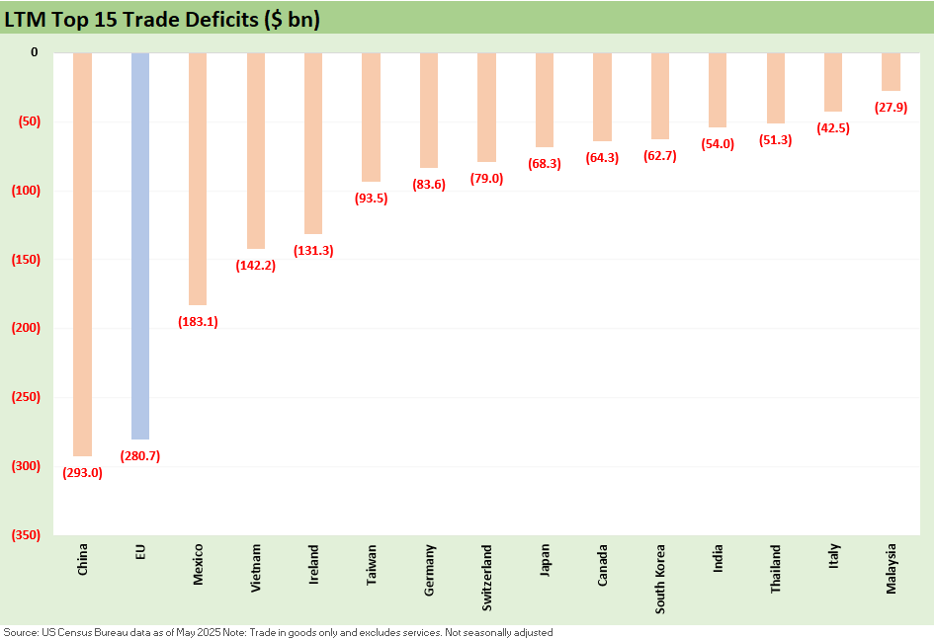
The above chart is the Top 15 trade deficit chart we used in our recent Vietnam commentary (see US-Vietnam Trade: History has its Moments 7-5-25). We see a heavy mix of Asia trade partners with 8 of the 15 largest deficits from Asian countries with 4 nations from Europe before the EU itself along with Canada and Mexico.
Among those in the news this week were Thailand and Malaysia. Thailand is also in the checklist of Top 15 importers. When it comes to the second tier of Asian trade partners behind China, Japan, South Korea, Vietnam, and Taiwan, we like to look for the product group exposures. That usually comes back to semis/electronics and the “labor arb” mix such as textile-based products (apparel, footwear). As a % of overall total US imports, such nations can be low in the mix %, but they can carry a higher share of narrow product groups and be concentrated suppliers to US consumer products companies (e.g. Nike) or retailers.
With semis/electronics in the crosshairs for the next round of Section 232 decisions (Section 232 tariffs on copper released today at 50% was an eye-opener), there is no telling what lies in store for semis and related integrated product systems. This broad category is a major factor in Asian imports including Thailand and Malaysia as noted below. Semis and related products are major staple items in Asian trade. Taiwan is another major trade partner on the list ahead.
For clothing and footwear, that does not rattle the foundation of the economy and rebuilding American manufacturing might, but it sure matters to retailers and households that need to feed and clothe the home team. Those lines show up in some trade partner product ranks such as Vietnam, Indonesia, India, and some of the other Asian trade partners we looked at in Tariffs: Some Asian Bystanders Hit in the Crossfire (4-8-25).
The apparel and footwear bucket is about votes and sensitivity of the consumer. Those product groups show up in the top of the import ranks annually (see US Trade with the World: Import and Export Mix 2-6-25). The impact will be slower and may not be at full force in back-to-school season, but it will matter.
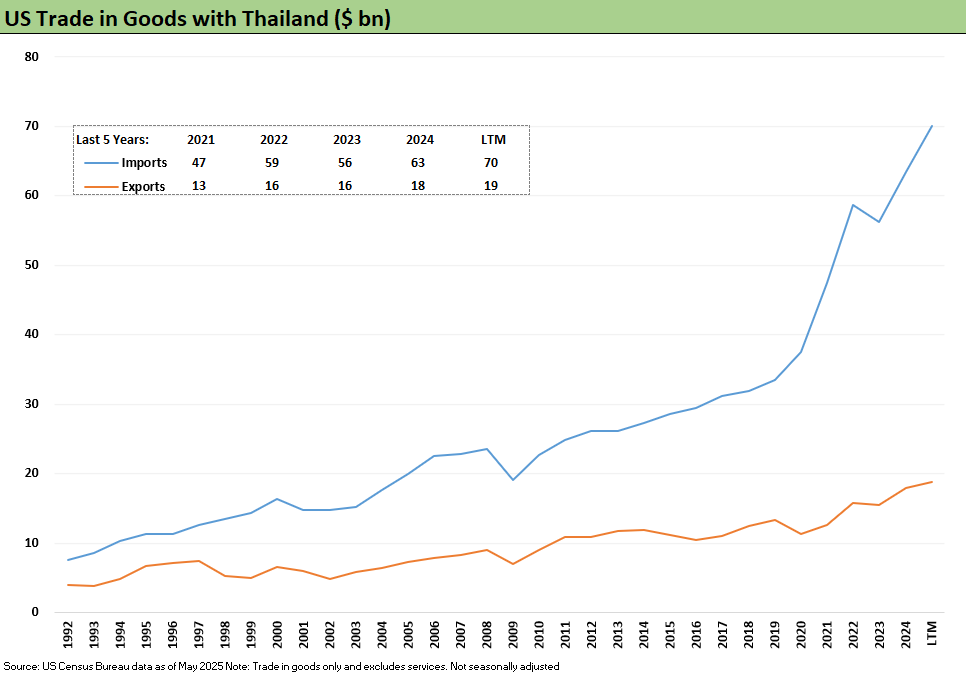
Thailand as a trade partner faces 36% tariffs for now…
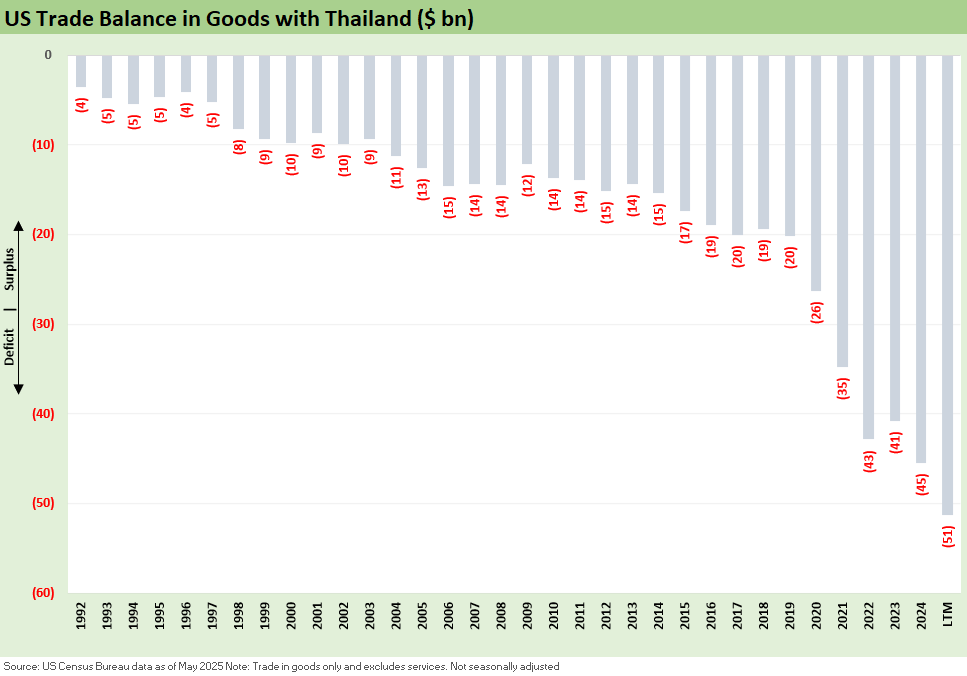
The above chart highlights the trajectory of the Thailand trade deficit. Given the mix and the nature of the tech boom and explosive growth in global low-cost sourcing, there is no surprise in the rise.
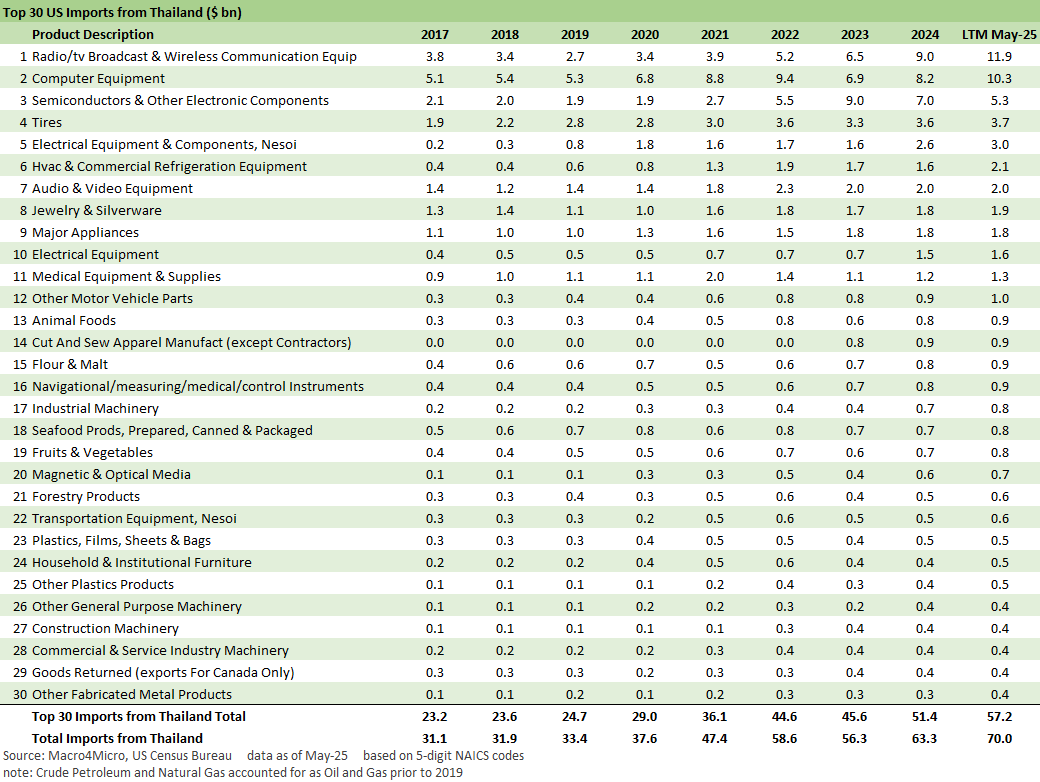
The above chart tells a tech-centric mix story but with a wide range of supply chain lines from autos to clothing and across appliances/equipment for household and industrial use. “Tires” is near the top at #4 and is part of a broader story of where tires get made. Asia is the leader in tire production (various sources estimate half are made there with China and South Korea as major players). Other nations such as Mexico have also expanded. They all face high tariffs.
We highlight tires for the simple reason that there are many basic household items that sneak up on consumer budgets. Tires are not cheap and for many drivers an accessory item (i.e. they upgrade for style). They also come in handy while driving new and used vehicles (4 of them plus a spare is a good plan!) Tires are a natural part of the transaction flow with tens of millions of new and used vehicles changing hands each year. Another underappreciated item in tariff dialogue is furniture and “cut and sew apparel.” It all adds up, and the cumulative effects of tariffs will weigh on household economic realities.
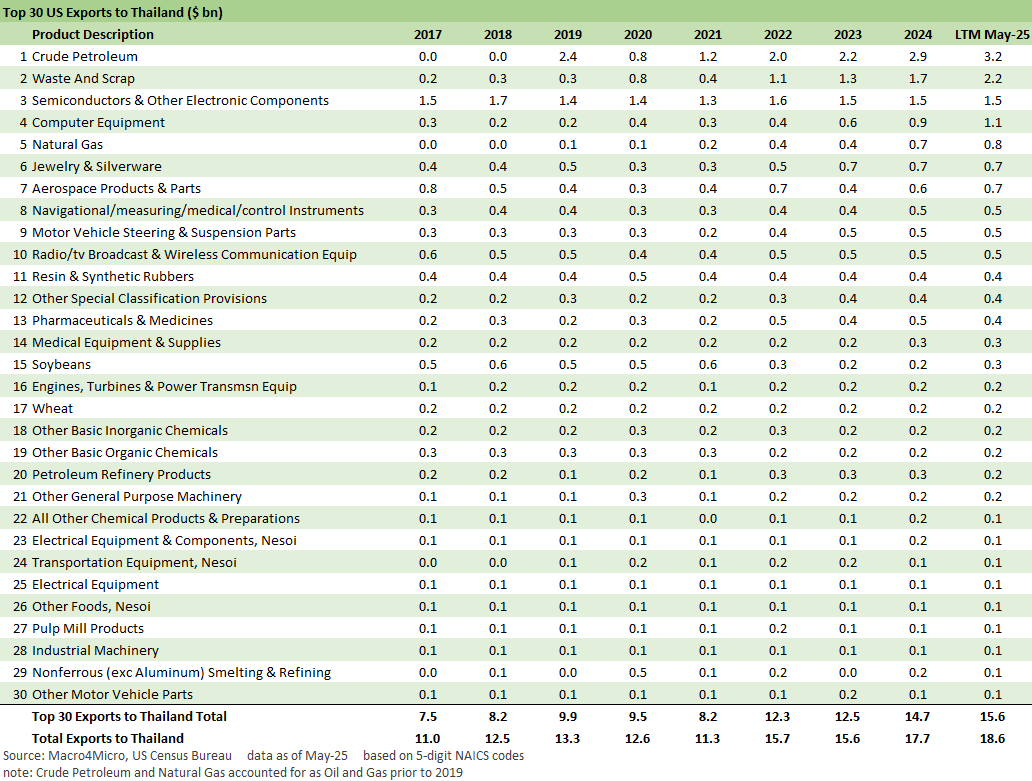
The above chart shows that there is not much to target for Thailand retaliation. They have little leverage apart from tactical supply weapons (disrupt production lines, etc.) and threatening to change energy and ag suppliers. In the end, the US buyer gets stuck paying the tariff, and the buyers may not have alternatives. That is where higher expenses, lower earnings and/or higher prices enter the picture. It is not rocket science.
The above chart is just another visual to show how imports pulled away from exports since the post-crisis period and the longest US expansion in history unfolded. The US operators decided low-cost sourcing was better than high-cost sourcing or “no source available.” These simple dynamics do not show up as part of the tariff dialogue out of the White House. These were decisions by US buyers to drive their growth and profitability.
Malaysia as a trade partner at 25% tariffs for now…
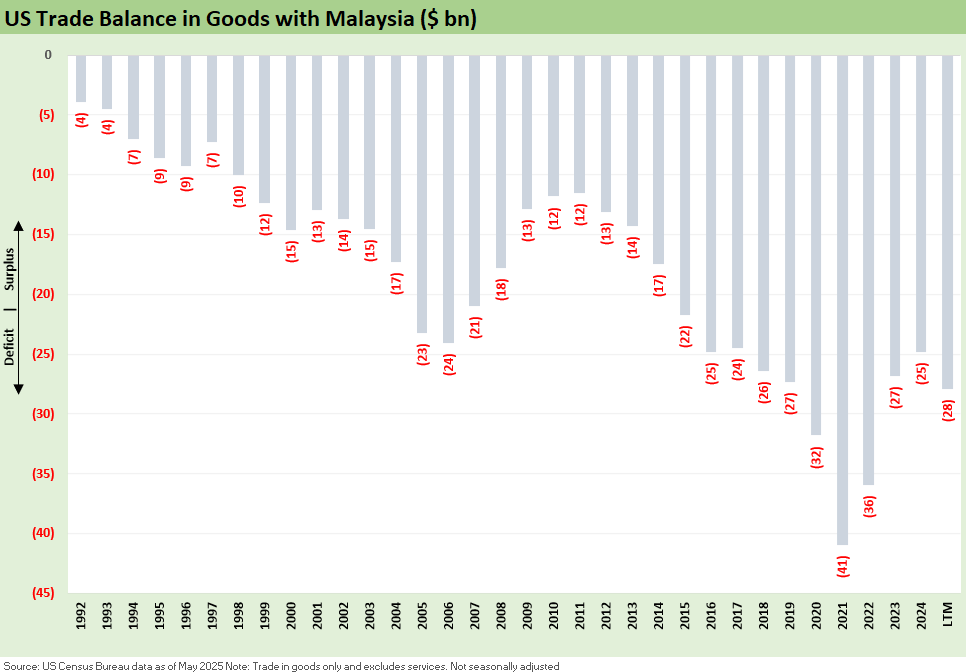
The above chart details the history of the trade deficit with Malaysia. It has been trending lower in recent years from the peak.
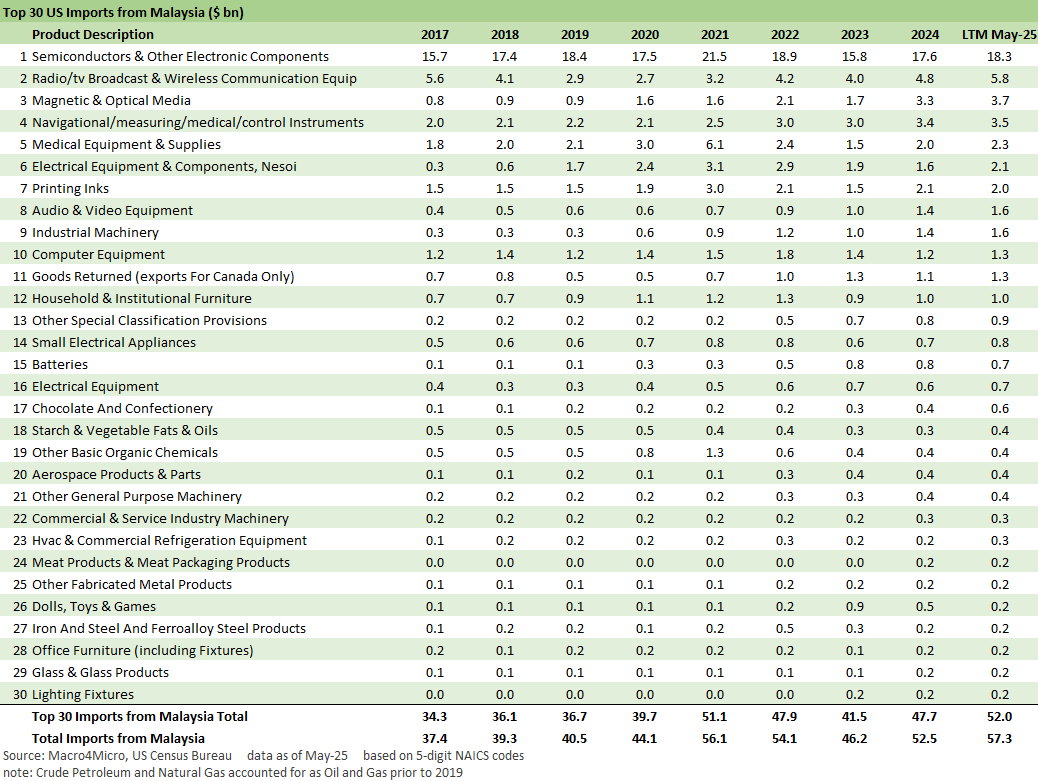
The above chart details the import product groups from Malaysia, and we see a heavier mix of value-added semis and electronics and components serving an array of end markets, tech-based equipment, and industrial machinery. We look at this list and we see a lot of commercial and industrial expense lines going higher in the US with these tariffs. There is no frictionless wheel. Earnings go down, other costs get cut, or prices rise. While the seller could cut price, the old rule of “call me when we get there” applies.
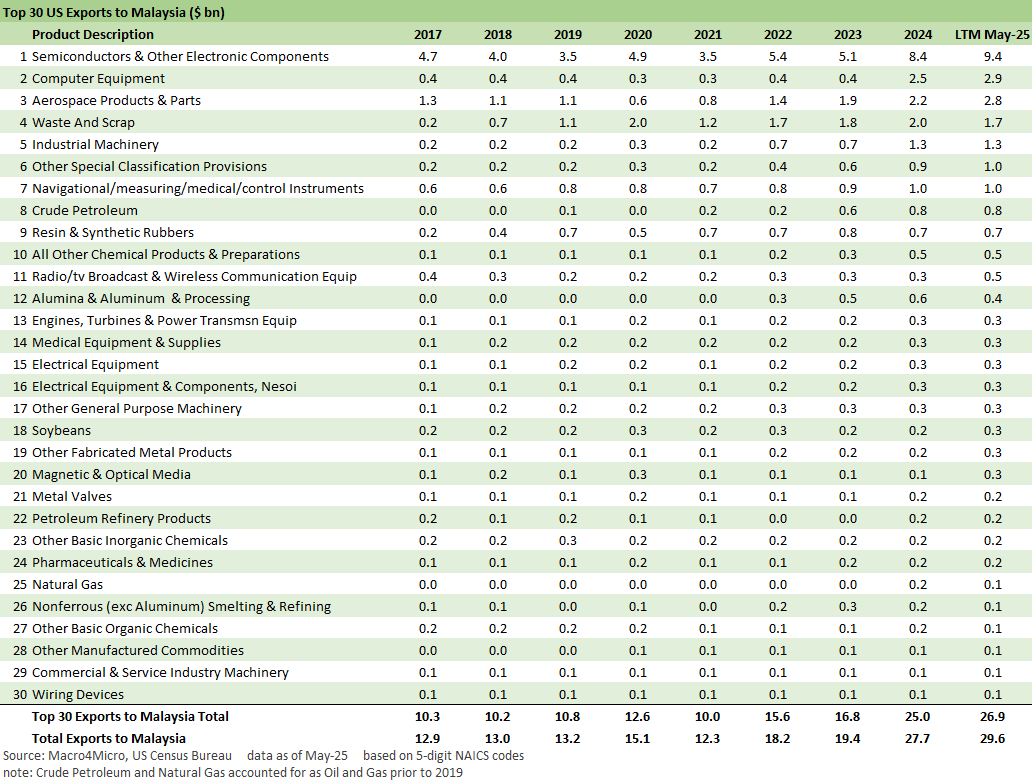
The above chart highlights the roundtrip nature of the semi and component chain between the US and Malaysia. The various legs of the journey on tech equipment always ends up being a bit of a maze between various countries in Asia and including exports from the US (some of that assembled in Mexico). The exports to Malaysia really don’t make much of a target list for retaliation.
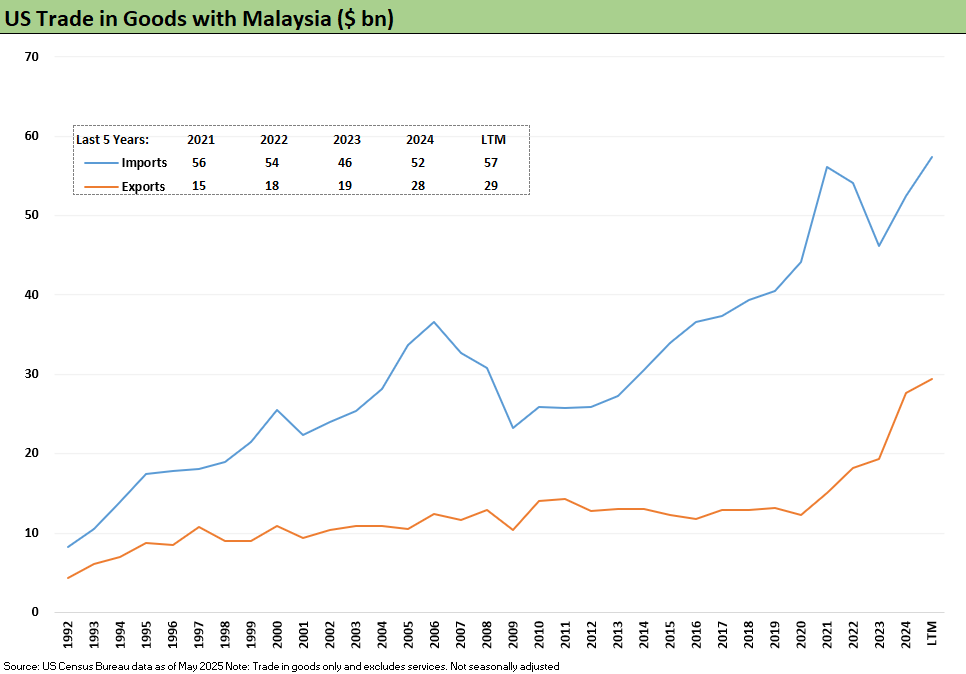
The above chart wraps the last of the time series on how total imports vs. exports trended. Global trade expansion and the desire for low cost supplier sourcing across the longest expansion in US history from June 2009 through early 2020 had a logical effect on imports. The arm’s length buyer in the US sought them out, but the propaganda paints them as trade partners “ripping us off.” Dumb is not new to Washington.
Tariff related:
South Korea Tariffs: Just Don’t Hit Back? 7-8-25
Japan: Ally Attack? Risk Free? 7-7-25
US-Vietnam Trade: History has its Moments 7-5-25
US Trade in Goods April 2025: Imports Be Damned 6-5-25
Tariffs: Testing Trade Partner Mettle 6-3-25
US-UK Trade: Small Progress, Big Extrapolation 5-8-25
Tariffs: A Painful Bessent Moment on “Buyer Pays” 5-7-25
Trade: Uphill Battle for Facts and Concepts 5-6-25
Tariffs: Amazon and Canada Add to the Drama 4-29-25
Ships, Fees, Freight & Logistics Pain: More Inflation? 4-18-25
Tariffs, Pauses, and Piling On: Helter Skelter 4-11-25
Tariffs: Some Asian Bystanders Hit in the Crossfire 4-8-25
Tariffs: Diminished Capacity…for Trade Volume that is…4-3-25
Reciprocal Tariff Math: Hocus Pocus 4-3-25
Reciprocal Tariffs: Weird Science Blows up the Lab 4-2-25
See also:
Footnotes & Flashbacks: Credit Markets 7-7-25
Footnotes & Flashbacks: State of Yields 7-6-25