
Footnotes & Flashbacks: Asset Returns 7-27-25
Asset returns show duration lagging, credit spreads frothy, and equities resilient at new highs as the tariff clock ticks on.


Simple enough. Just don’t step on them, right?
As we go to print, the headlines are signaling an EU “deal” with one of those loose tariff “framework” deals we keep seeing with Team Trump. For the EU, the main terms include a 15% number (also applies to autos, not steel or aluminum), but major questions are open on the future Section 232 tariffs on pharma, semis and aircraft/parts. 15% beats a 30% baseline and 25% on autos, and it beats a trade war.
A 15% number follows the Japan deal and raises the bar for Canada and Mexico to look for 15% as the focus now moves back to the USMCA trade partners, who for their own part are probably looking at a radical overhaul or end of the USMCA in 2026. In the end, the EU being able to attach a 15% number with no tariffs on US exports and an investment/purchase package will be seen as materially narrowing trade war risk with our #1 trade partner.
Even if the deal is perceived as a de facto surrender by the EU and a retreat from fair and open trade dictated by seller/buyer decisions, the end result is less risk over the short term and an adjustment period for a number of industries longer term.
The past week saw fresh highs in equities and a constructive, if mixed, reporting season that are certainly not sending recession signals.
If Trump can treat Canada and Mexico with level playing field respect (e.g. 15% baseline) as the #2 and #3 trade partners behind the EU, then there could be a pathway out of this mess even at the cost of higher expenses to buyers and higher prices flowing across the supplier to OEM chain. As a reminder, the US has a trade surplus with Canada ex-crude oil.
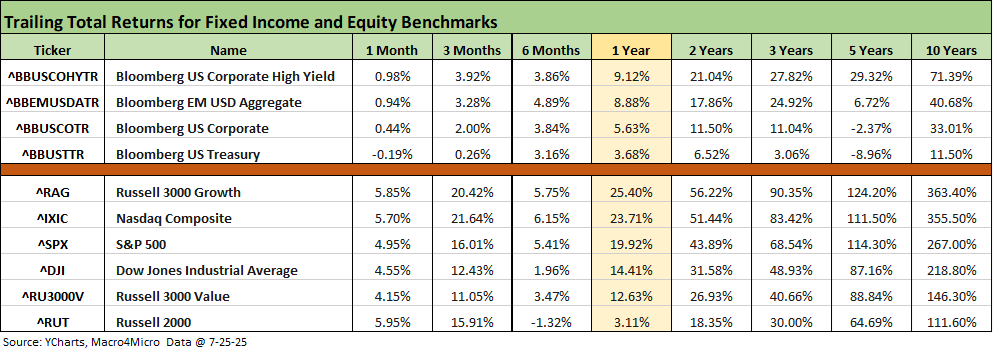
The above table updates the high-level equity and debt benchmarks we watch each week. We see duration in a struggle the past 1-month and 3-month periods and looking back 1- year. Credit assets are performing well on more spread compression the past month supporting credit returns. We see equities across the board turning in very strong 1-month and 3-month numbers with the bounce off the post-Liberation Day panic. Looking back at the 6-months and 1-year time horizons, we see the Russell 2000 small caps struggling.
The rolling return visual
In the next section, we get into the details of the 32 ETFs and benchmarks for a mix of trailing periods. Below we offer a condensed 4-chart view for an easy visual on how the mix of positive vs. negative returns shape up. This is a useful exercise we do each week looking for signals across industry groups and asset classes.
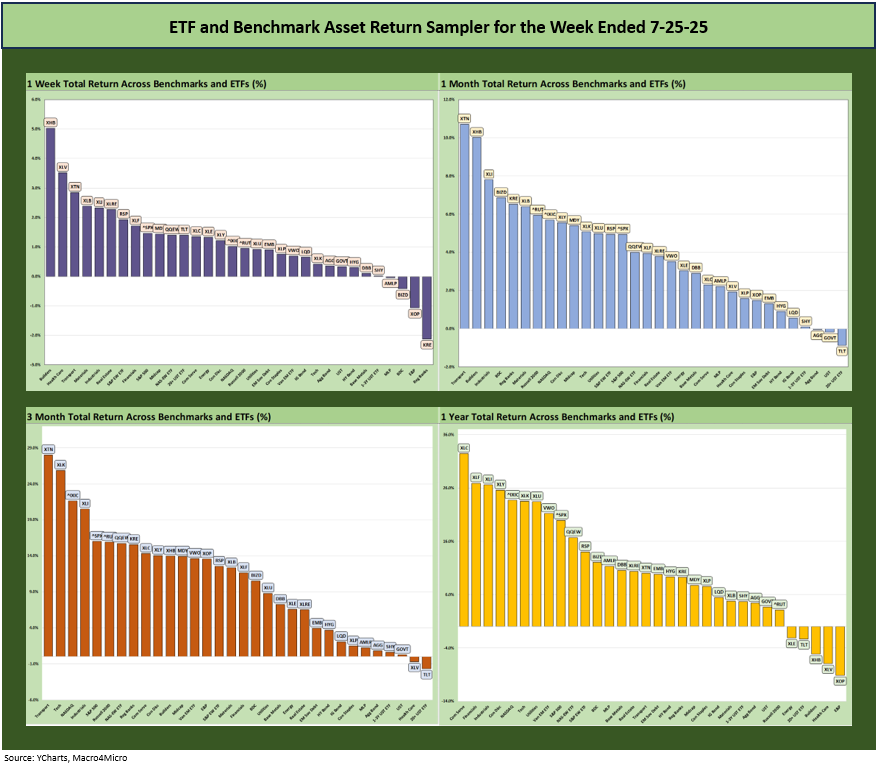
The return symmetry story is easy enough over the time horizons above with an overwhelming bias toward the positive side. The YTD period (shown above, detailed further below) posts a 31-1 score. For all of the tariff turmoil and policy battling, the configuration of asset returns have been strong overall in 2025, 2024 (see Footnotes & Flashbacks: Asset Returns for 2024 1-2-25), and 2023 (see Footnotes & Flashbacks: Asset Returns 1-7-24) after the tightening cycle and UST curve whipsaw of 2022.
The numbers tend to disagree with the “dead country” theme pushed by partisans. The asset class returns across 2023 and 2024 are matters of fact. For all the tariff concerns and debate on that front, there is a timeline ahead where those side effects will be answered in goods prices and corporate earnings.
The Magnificent 7 heavy ETFs…
Some of the benchmarks and industry ETFs we include have issuer concentration elements that leave them wagged by a few names. When looking across some of the bellwether industry and subsector ETFs in the rankings, it is good to keep in mind which narrow ETFs (vs. broad market benchmarks) get wagged more by the “Magnificent 7” including Consumer Discretionary (XLY) with Amazon and Tesla, Tech (XLK) with Microsoft, Apple, and NVIDIA, and Communications Services (XLC) with Alphabet and Meta.
This week the market will see earnings from Microsoft, Meta, Apple and Amazon.
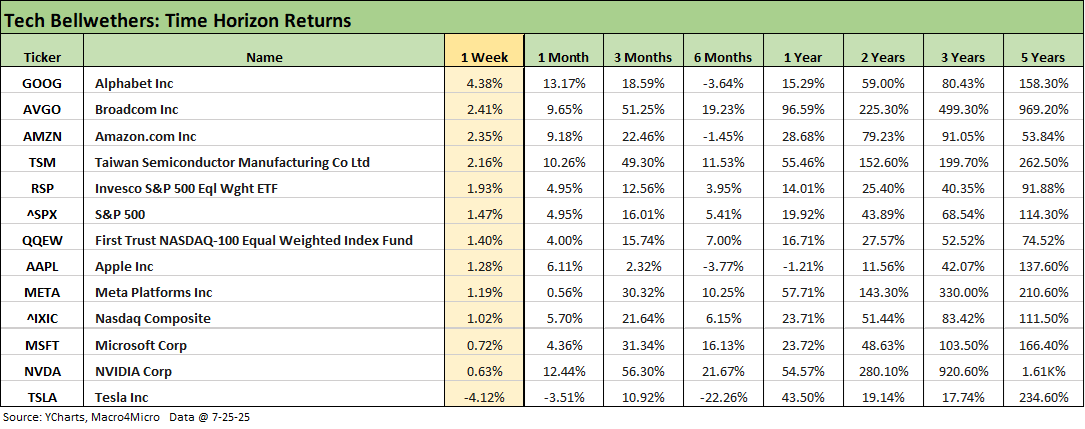
We already looked at the tech bellwethers in Mini Market Lookback: Mixed Week Behind, Big Week Coming (7-26-25). We line them up in descending order of returns for the week, and Tesla sits in Last place with a -4.1% number after its weak earnings report. The rest were positive. The S&P 500 outperformed 5 of the Mag 7 this week and the Equal Weight NASDAQ 100 ETF (QQEW) beat the same 5 for the week with Alphabet and Amazon ahead.
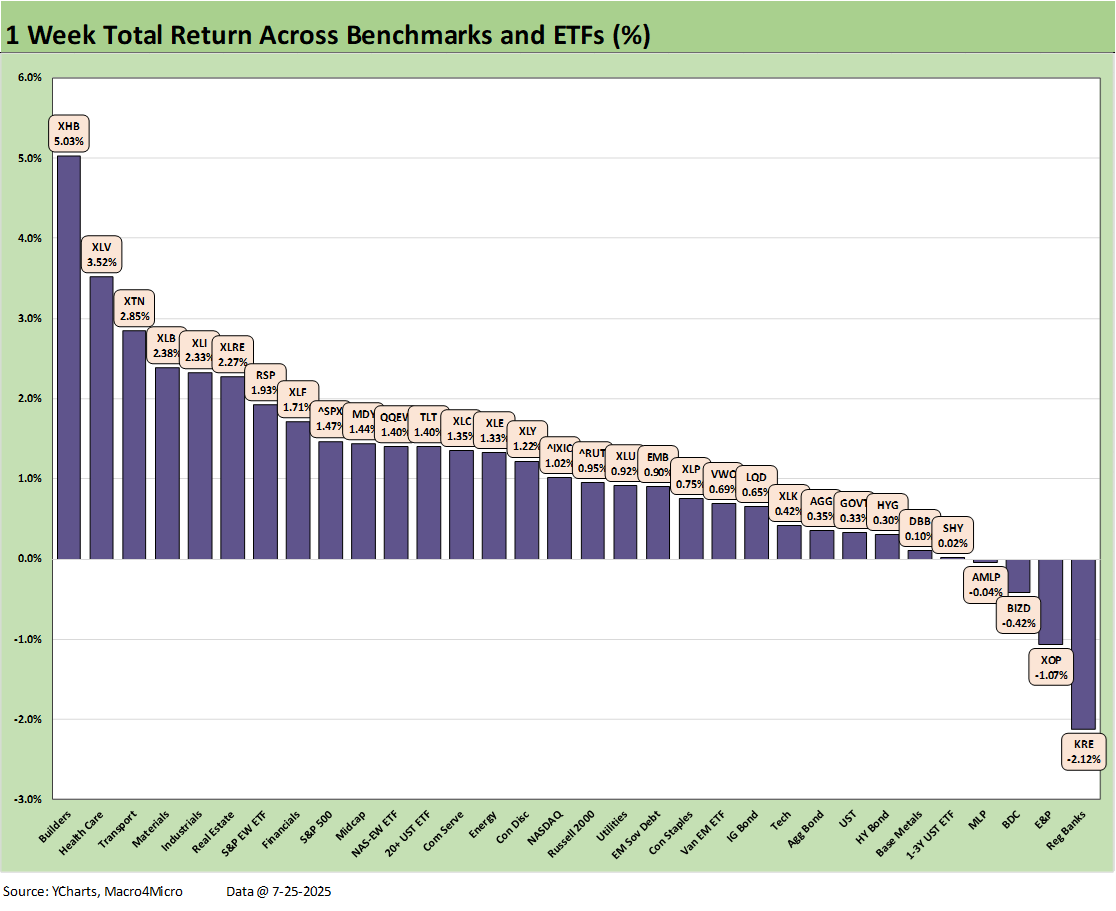
We looked at the 1-week mix of returns in Mini Market Lookback: Mixed Week Behind, Big Week Coming (7-26-25) with the main theme being the “out of favor” comeback the past week with Homebuilders (XHB), Health Care (XLV), and Transports (XTN) locking down the top 3 positions. Each of those three are in the bottom quartile YTD, so it has been a rough ride in 2025 for those industries facing any combination of a policy onslaught (including tariffs in that bucket) or a high level of sensitivity to the longer end of the UST curve.
As we detail below, asset classes that have fared badly YTD include those with sensitivity to rates and curve steepening such as Real Estate (XLRE) and the long duration UST ETF (TLT). The UST steepener debate will be the boiling kettle from now until the fall as the contentious Trump vs. Powell drama continues and the expenses related to the tariffs get paid at the border to customs. Then the goods continue their economic journey that begins with the pre-tariff seller’s price. If you believe 100% of the tariff will be paid by the seller, you can maybe get a job as the head of the House Ways and Means Committee, but you better not bring it up in an interview in the private sector.
Inflation focus is alive and well…
The risk of price creep across product lines will be under scrutiny with each CPI and PCE release. For PCE, we have a fresh set of numbers this week (see PCE May 2025: Personal Income and Outlays 6-27-25). PCE inflation remains above target and is going in the wrong direction (as in higher in the last report). Meanwhile, every CPI report will see investors scanning each product line for the latest MoM trends. We saw ample examples already across numerous household items in the recent reports even if many pretend they were not there to see (CPI June 2025: Slow Flowthrough but Starting 7-15-25).
Headline inflation and core metrics are important, but the flowthrough into individual lines matter more to that household daily experience. Energy weakness has hurt upstream E&P (see XOP in dead last YTD and second to last above), but low gasoline prices in the peak driving season has been good for consumers’ out of pocket experience.
From here, let’s see how back-to-school season and peak holiday periods play out with high tariffs on the “labor arb” countries (Mexico, Asia) hitting the retail experience. Even then, there will be more Section 232 targets at the border that will not be in the numbers yet. A little more inflation and more focused attacks on Powell with record UST supply and uncertain dollar trends make for a challenging calculus on UST steepening risk. The bond vs. equity and sectoral allocations will be sharpening up planning in the fall.
The “dismal science” will need to run its course on tariffs…
The pro-tariff crowd is trying to pretend the debate is already over and decided on tariffs and inflation even though the “reciprocals” are only just about to start at the new levels and the earlier wave is only just now rolling into working capital cycles. Furthermore, some of the biggest and most contentious Section 232 moves lie ahead such as pharma and semis.
The next wave of Section 232 could still generate some major dislocations along the supplier chain and clashes with trade partners. Aircraft/parts Section 232 are likely to have carveouts, but the aircraft maintenance business could see some material cost pressures where they can exercise pricing power (need to keep the planes in the air and airworthy).
For now, Trump is rounding up twice the usual number of talking head lapdogs to get on CNBC and bark louder about Powell and tariffs. As time rolls on, the slow but steady tariff effective dates and working capital cycles and capex costs will be rolling into the transaction flow and that can tell a cleaner story with better data. For the pro-tariff partisans, it is hard enough to get them to admit the “buyer writes the check.”
The echo chamber of “tariffs don’t affect prices” (it sounds so much dumber when you don’t use the word “inflation”) has to lead to a conclusion of higher expenses for many companies (hearing plenty of examples loud and clear during earnings season) or some impact on pricing strategies. Most companies need to pursue a range of mitigating cost and mix strategies first if possible. Price increases will come at a lag for many. Hearing companies such as GM and Stellantis discuss these issues is useful. That is for separate commentaries. Ford is on deck this week as is the full report from Stellantis.
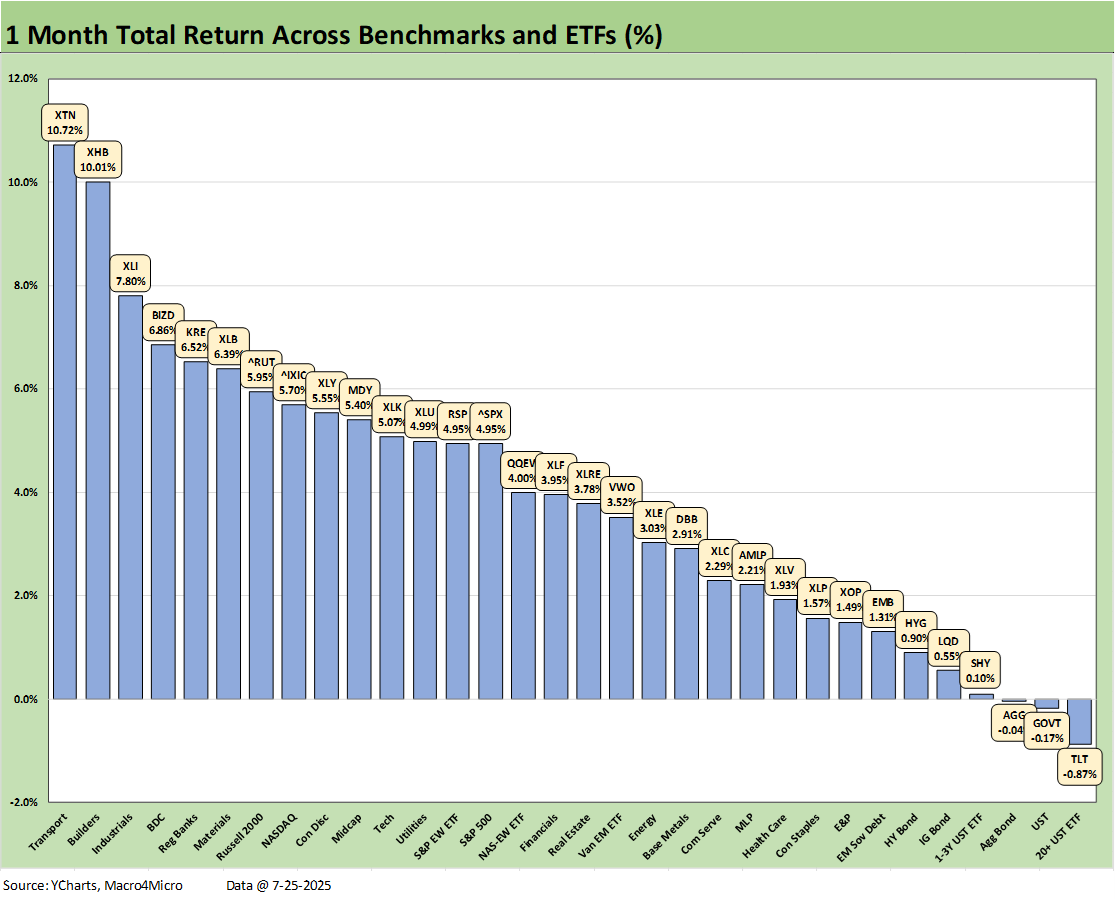
The 1-month score is 29-3 with 3 bond ETFs in the red. We see the bottom quartile with 7 of 8 comprised of bond funds. E&P (XOP) is at the top of the bottom quartile as the only industry equity ETF. We see Transports at #1 and Homebuilders at #2 in the top quartile after a protracted period of beatdowns as discussed earlier. We see Industrial (XLI) at #3, BDCs (BIZD) at #4 and Regional Banks (KRE) at #5 despite the weakness seen the past week with many SMid cap regionals weighing in and sending KRE to the bottom for the week.
Industrials (XLI) at #3 is a favorable sign as the smoke somewhat lifts on many tariff outcomes (ex-the USMC trade partners). Notably, XLI is #1 YTD also so the cyclical confidence in manufacturing industry remains anchored despite the unit cost worries and tariff fallout for supplier chains. Decent volumes at lower unit margins ahead are still at least forward motion on the cycle. Earnings reports and guidance will tell some more stories in the next few weeks.
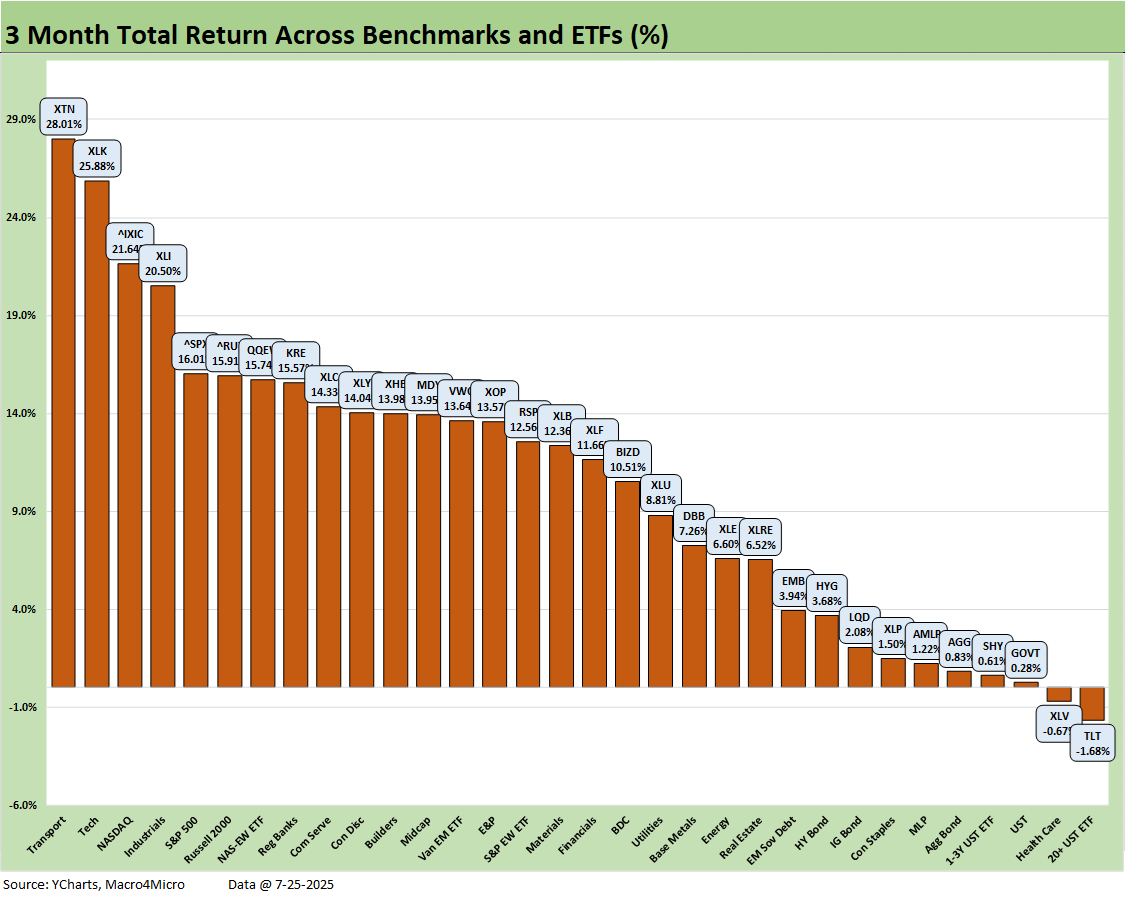
The 30-2 score for the trailing 3 months does not present much mystery coming off the Liberation Day plunge and bounce since that early April sell-off. The bottom quartile shows 5 of 8 as bond ETFs with the long duration UST ETF (TLT) one of 2 lines in negative range, joined by the Health Care ETF (XLV). We see HY (HYG) and EM sovereign bonds (EMB) at the bottom of the third quartile.
The tariff-driven April plunge and ensuing rebound sent Transports (XTN) back to #1 with some help from upward revisions in Airline guidance. The Tech ETF (XLK) at #2 and NASDAQ at #3 are reflected in the earlier table showing the rolling 3-months for the tech bellwethers that includes NVIDIA over +56%, Broadcom over 51%, and Microsoft at over 31% among larger XLK constituents.
We see Industrials (XLI) in the top 5 with a nice sign for breadth seeing the S&P 500 and Russell 2000 both in the top quartile joined by the Equal Weight NASDAQ 100 (QQEW). QQEW offers a reminder that it is more than just Mag 7 in the rally.
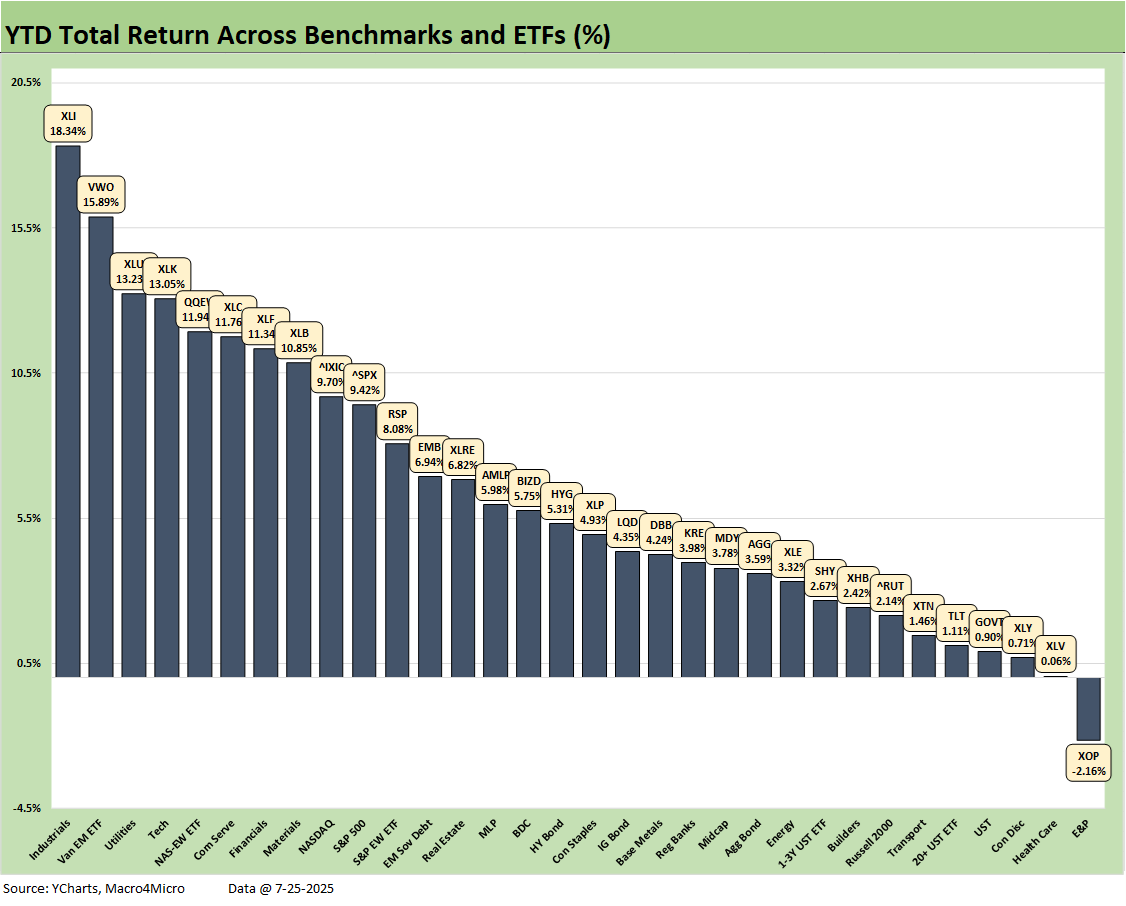
The YTD scoresheet of 31-1 says enough on its own with only the E&P ETF (XOP) in the red. The median returns YTD are only around the low 5% area so the “all-time high” headlines we keep seeing come with the qualifiers that the broad market benchmarks are on track for a return year below the past two years. There is a lot of year left in 2025 and some major moving parts around inflation, tariffs, and the FOMC that can lead to a wider range of outcomes.
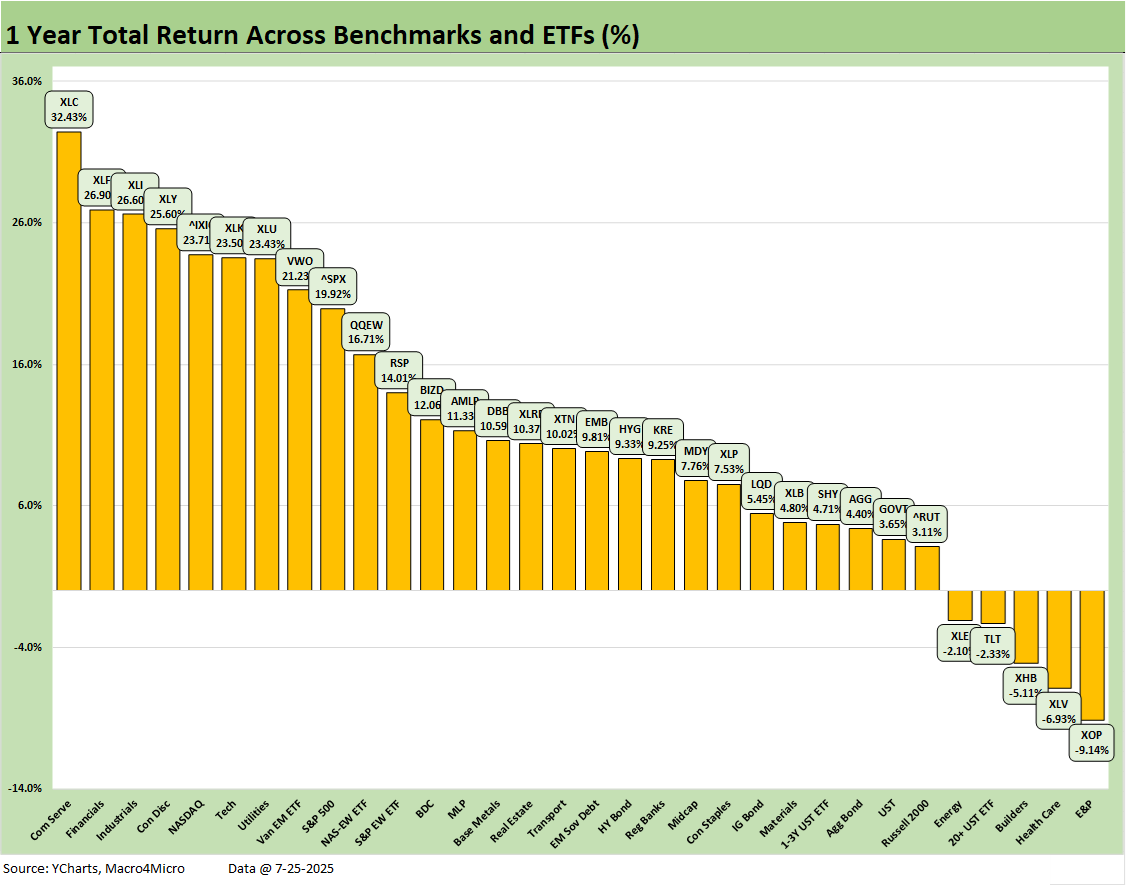
The LTM period posted a score of 27-5. The run rates above include almost 5 months of the 2024 banner year in equities. The year 2024 was Part 2 of the best 2-year run in the S&P 500 since the late 1990s, so that sets a high bar (see Footnotes & Flashbacks: Asset Returns for 2024 1-2-25). The combined 2023-2024 S&P 500 return on the S&P 500 of +45% cumulative for two years and +25% for 2024, respectively, will be very hard to match in 2025-2026.
The performance in 2023-2024 on the way to the LTM 2025 above undermines the weak premise of the Trump rhetoric that the country was “dying” until Trump came along. Asset returns and economic numbers seldom get in the way of his next round of adjectives and superlatives. The advance estimate for 2Q25 GDP will be posted this week for a fresh look at actual line items from the consumer sector (PCE) and then into the Gross Private Domestic Investment and the fixed investment lines.
The1Q25 period was a mixed bag with some good and bad lines under the headline contraction number driven by weak consumer numbers (see 1Q25 GDP: Final Estimate, Consumer Fade 6-26-25). We will also get PCE inflation this week along with Income and Outlays. Those numbers last month also signaled a softer consumer sector. We will see if that turned around in the full 2Q25 period (see PCE May 2025: Personal Income and Outlays 6-27-25).
Markets:
Mini Market Lookback: Mixed Week Behind, Big Week Coming 7-26-25
Durable Goods Jun25: Air Pocket N+1 7-25-25
Taylor Morrison 2Q25: Resilient but Feeling the Same Macro Pressure 7-25-25
New Home Sales June 2025: Mixed Bag 7-24-25
Existing Home Sales June 2025: The Math Still Doesn’t Work 7-23-25
PulteGroup 2Q25: Still-Lofty Margins see a Mild Fade 7-23-25
D.R. Horton 3Q25: Material Slowdown Still Good Enough 7-22-25
Housing Starts June 2025: Single Family Slips, Multifamily Bounces 7-18-25
Footnotes & Flashbacks: State of Yields 7-20-25
Footnotes & Flashbacks: Asset Returns 7-20-25
Mini Market Lookback: Macro Muddle, Political Spin 7-19-25
Housing Starts June 2025: Single Family Slips, Multifamily Bounces 7-18-25
Retail Sales Jun25: Staying Afloat 7-17-25
June 2025 Industrial Production: 2Q25 Growth, June Steady 7-16-25
CPI June 2025: Slow Flowthrough but Starting 7-15-25
Footnotes & Flashbacks: Credit Markets 7-14-25
Mini Market Lookback: Tariffs Run Amok, Part Deux 7-12-25
Mini Market Lookback: Bracing for Tariff Impact 7-5-25
Payrolls June 2025: Into the Weeds 7-3-25
Employment June 2025: A State and Local World 7-3-25
Asset Return Quilts for 2H24/1H25 7-1-25
JOLTS May 2025: Job Openings vs. Filling Openings 7-1-25
Midyear Excess Returns: Too little or just not losing? 7-1-25
Recent Tariff commentary:
US-Italy Trade: Top 15 Deficit, Smaller Stakes 7-18-25
US-France Trade: Tariff Trigger Points 7-17-25
Germany: Class of its own in EU Trade 7-16-24
US-Canada Trade: 35% Tariff Warning 7-11-25
India Tariffs: Changing the Music? 7-11-25
Taiwan: Tariffs and “What is an ally?” 7-10-25
US-Trade: The 50% Solution? 7-10-25
Tariff Man Meets Lord Jim 7-8-25
South Korea Tariffs: Just Don’t Hit Back? 7-8-25
Japan: Ally Attack? Risk Free? 7-7-25
US-Vietnam Trade: History has its Moments 7-5-25
US Trade in Goods April 2025: Imports Be Damned 6-5-25
Tariffs: Testing Trade Partner Mettle 6-3-25
US-UK Trade: Small Progress, Big Extrapolation 5-8-25
Tariffs: A Painful Bessent Moment on “Buyer Pays” 5-7-25
Trade: Uphill Battle for Facts and Concepts 5-6-25
Ships, Fees, Freight & Logistics Pain: More Inflation? 4-18-25
Tariffs, Pauses, and Piling On: Helter Skelter 4-11-25
Tariffs: Some Asian Bystanders Hit in the Crossfire 4-8-25
Tariffs: Diminished Capacity…for Trade Volume that is…4-3-25