
FOMC Day: PCE Outlook Negative, GDP Expectations Grim
The FOMC frames a negative outlook for inflation and GDP growth with sub-2% GDP growth for next 3 years.


On the other hand, tariffs can hurt you and especially if you’re a small business.
Unchanged fed funds was no surprise, but the forecast was the main event. The dot plot shows 9 dots sitting above the 2 cut line with 7 of those 9 showing no change. The 10 dots at 2 cuts or more include 8 at two cuts. The takeaway on the vote is that “no change” got 3 more votes this time with 7 vs. 4 in March.
Tariff unknowns (literally unknown for many at this point) and related impacts and now the Middle East wildcard add up to more uncertainty than in the March meeting with Iran the tiebreaker. The tariff X factor and related trade risk are reflected in lower GDP growth rates for 2025 (to 1.4% in June from 1.7% in March and 2.1% in Dec 2024) and higher PCE inflation forecasts for 2025 (to 3.0% in June from 2.7% in March and 2.5% in Dec 2024). The new GDP forecast is in line with very recent OECD and World Bank projections.
The tariffs entail the buyer writing the check to customs, so that creates a credibility problem for those who say otherwise (i.e., White House and GOP Committee leaders). The FOMC certainly knows the difference, and that is the case with any party who does not need to kiss the ring and say “2+2=5.” Tariffs are an expense to the buyer that will elicit a financial reaction (expense, price, etc.).
Trump was busy calling Powell “stupid” today, but he never cites numbers and still misstates the fact of who pays the tariff. Facts matter more than “sticks and stones.”
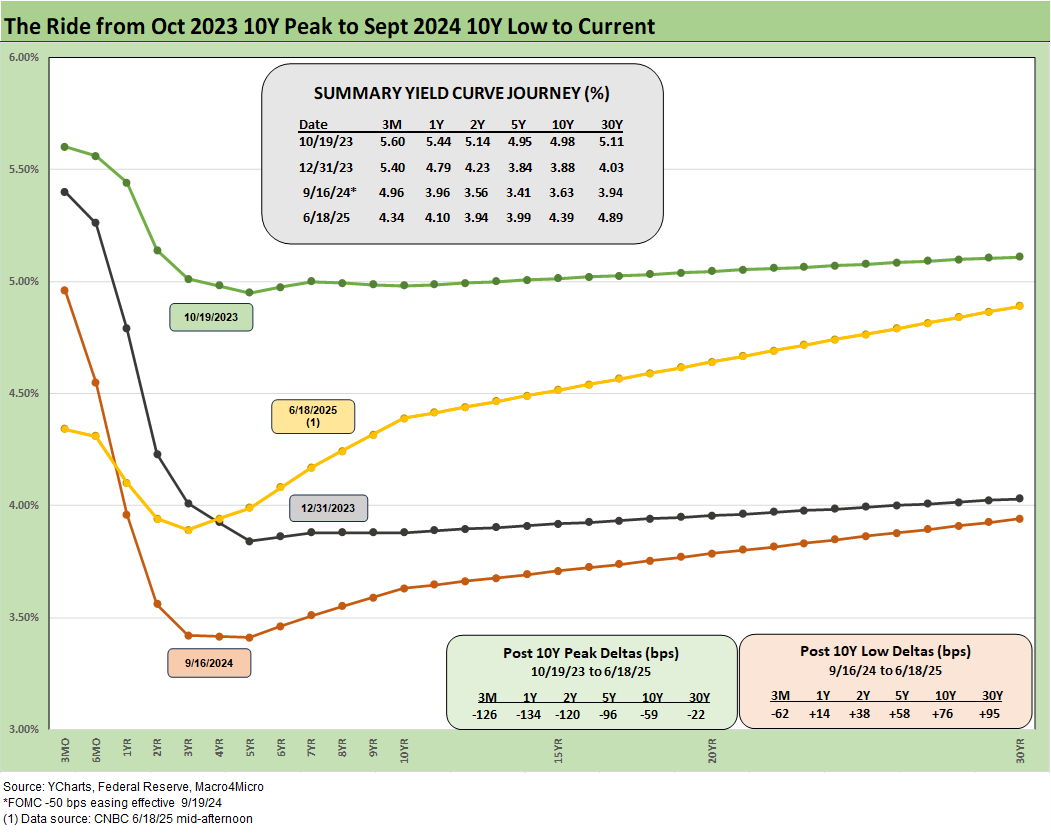
The chart above reminds us that a lot can happen in a hurry in the UST curve whether in absolute rates and/or shapeshifting. While the Fed sets the short end of the curve, the market sets the rest of the curve. The supply of UST is a function of budgets and liability management planning by UST. In other words, it is not the FOMC holding up the party since they have a mandate for price stability and full employment – not making politicians happy. After all, someone has to deal in facts and concepts and consider history.
As we cover in our weekly State of Yields publication (see Footnotes & Flashbacks: State of Yields 6-15-25) , the 3M to 5Y UST inversion sticks out across history with a 3M to 5Y inversion of around -45 bps when the long-term median is +108 bps. While that helps the case for looking to lower fed funds to reshape the curve, the tariff factor is the main barrier. Tariffs are the items that threaten stagflation risk, especially when taken in the context of what are, in effect, attacks on trade partners who can respond in part or in kind. We cover those topics in other commentaries.
That tariff battle will be playing out in 2H25 with the final resolution of reciprocals and some potential visibility with the waves of major Section 232 tariffs in the pipeline (pharma, semis, aircraft/parts, lumber, copper). Those are expected to see the light of day in the coming weeks and potentially show up in the numbers and forecast for 2026. The dot plot and median projections reflect the best estimate (guess?) by the FOMC on what those might mean.
The main forecasts to ponder from the dot plot…
The forecasts in today’s release are not radical by any stretch. We look at a few below. They may end up wrong, and that is not unusual with economic forecasts or financial market price targets.
GDP growth: We find it notable that GDP growth for 2025 went down yet again to 1.4% for 2025 followed by 1.6% for 2026, and 1.8% for 2027. That is sub-2% for 3 years. That is not much of a vote of confidence in the New Golden Age. The 2025 forecast in March was 1.7% and in Dec 2024 was 2.1%. Anyone can look around at forecasts, and the 2025 numbers look a lot like those recently published by OECD and the World Bank. At such low growth rates, a minor move in trade deficits and/or private inventory can generate a material change to a 1% handle headline GDP number, but the main events are always PCE and fixed investment. The headline number is the traditional focal point, and those are grim numbers at a time when tax bill advocates are complaining that the CBO does not use 3.0% or more or its growth forecast.
PCE inflation and Core PCE inflation: The June forecast for headline PCE inflation of 3.0% is up from 2.7% in March after 2.5% in Dec 2024. Core PCE for June was 3.1%, up from 2.8% in March and 2.5% in Dec 2024. That trend is going the wrong way. The good news is that the 2026 and 2027 headline numbers show declines to 2.4% in 2026 and 2.1% in 2027. The March core number showed 2.0% by 2027.
Unemployment rate: The 4.5% estimate for 2025 in the June report is up slightly from the 4.4% forecast in March and 4.3% in Dec 2024. These are narrow differentials and certainly worth framing as being in the area of full employment. The “dual mandate” angle does not help much here at these employment numbers. The FOMC will need PCE inflation to be lower than those expectations.
Fed funds median: The 3.9% median in June for 2025 was unchanged from 3.9% in March and Dec 2024. As cited earlier, the split between the zero or 1 cut group and the 2-3 cut group was 9 vs. 10 but the 9 included 7 with no cuts this time vs. 4 in March. That mix would look very different in the absence of the grand tariff experiment (yes, the one where the sellers pay the tariff to customs even though they really don’t).
Overall, the “hold” today for fed funds was no surprise. The political rhetoric and name calling is “just another day ending in Y.” As we go to print, the odds per the CME is 89% for unchanged fed funds in July and 62% for 1 cut in Sept 2025.