
Footnotes & Flashbacks: Asset Returns 7-20-25
We look at a favorable week for asset returns in equities and bonds with most yields biased lower this week and tighter credit spreads.


Will the rosy policy sales pitch on tariff policies hold up after August ?
The week saw slightly tighter credit spreads and positive returns in 7 of 11 S&P 500 sectors (7 positive, 3 negative, 1 flat) with the S&P 500, NASDAQ, Russell 2000, and Midcaps in the green. The busy economic release week supported the consumer story making a mild comeback with retail sales numbers and sequential improvement in the better-but-still-ugly consumer sentiment index and inflation expectation numbers (see Retail Sales Jun25: Staying Afloat 7-17-25 ).
The bond ETFs in our group of 32 benchmarks and ETFs we track showed 6 of 7 in positive range with only the long duration UST 20+Y ETF (TLT) in the red as the short to intermediate UST yields move lower but 10Y to 30Y steepened slightly on 30Y noise attributed to any mix of Powell attacks, tariff noise, and a mixed CPI report (see Mini Market Lookback: Macro Muddle, Political Spin 7-19-25, CPI June 2025: Slow Flowthrough but Starting 7-15-25).
Single family housing starts were reported in the red last week, and this coming week brings existing home sales and new home sales for a fresh set of housing data in the peak selling/moving season. We also get a Powell speech and the Durable goods preliminary report after a steady Industrial Production release this past week (see June 2025 Industrial Production: 2Q25 Growth, June Steady 7-16-25).
This week brings a deluge of bellwether industry reports and some Mag 7 (Tesla, Alphabet) after last week brought consumer and credit cycle reassurance from the major banks on C&I loan books and consumer credit. GM and Lear should offer some color this week on auto supplier-to-OEM conditions based on auto tariffs and material costs even before that industry faces the threat of Section 232 tariffs on semis (autos are among the largest consumers of semis).
The fate of the small business sector and its financial health trends may well get tied to tariffs and a general lack of flexibility to adapt business lines to Trump’s enforced high-cost sourcing. That reality has been unfavorable in the trade group color with myriad financial stress stories to be found and notably in retail groups and start-up businesses dependent on low cost global sourcing. In many cases, substitute sourcing - even at higher prices – does not even exist given the realities of domestic costs and tooling, capacity, customer priorities of current producers, etc. (see Chamber of Commerce, National Retail Federation, National Association of Manufacturers).
Trade groups are advocates for their members and try to defend them against financially harmful policies. It is good to monitor their views. Even if one views these industry groups as “having an agenda” they at least bring facts and real industry perspective to the discussion as opposed to political punch lines. Political “agendas” prefer people not look at such information. Examples in Autos include Alliance for Automotive Innovation. That is just one well recognized trade group among numerous others covering auto subsectors and related disciplines. They are worth monitoring given the intrinsic economic multiplier effects of what will be unfolding in force from tariffs across 2H25.
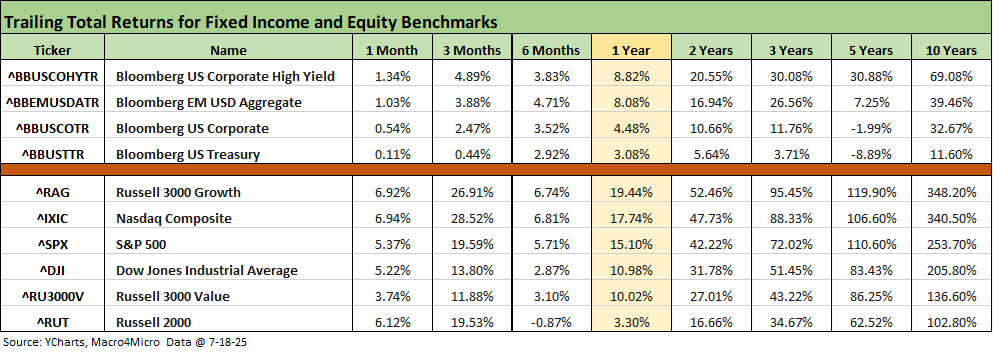
The above table updates the high-level debt and equity benchmarks we monitor each week. The only timeline and asset line in negative range looking back over 1,3, and 6 months is the Russell 2000 small cap index over 6 months. That negative return was less than -1.0% for the Russell 2000, which has been the primary laggard over 1 year and 6 months.
In fixed income, the UST curve has been friendly in the short to intermediate UST segments and credit spreads also have been supportive of returns and especially for HY where the 8.8% 1-year return is slightly below the long-term nominal return on equities. The run rate for HY through the recent 3 months and 6 months has been steady. The trailing 3 months gets caught up in the post-Liberation Day panic, but the 6 months tells a tale of HY resilience.
The rolling return visual
In the next section, we get into the details of the 32 ETFs and benchmarks for a mix of trailing periods. Below we offer a condensed 4-chart view for an easy visual on how the mix of positive vs. negative returns shape up. This is a useful exercise we do each week looking for signals across industry groups and asset classes.
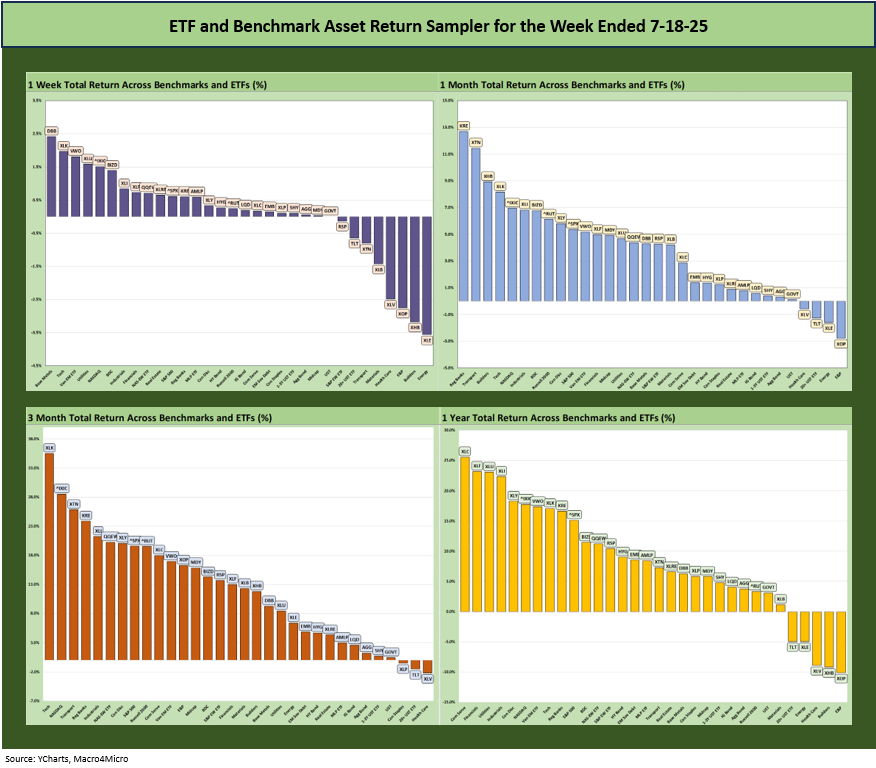
The symmetry of the positive vs. negative returns is clearly quite positive over the rolling time horizons above. We include a YTD chart further below where we break out the details for each time horizon.
The Magnificent 7 heavy ETFs…
Some of the benchmarks and industry ETFs we include have issuer concentration elements that leave them wagged by a few names. When looking across some of the bellwether industry and subsector ETFs in the rankings, it is good to keep in mind which narrow ETFs (vs. broad market benchmarks) get wagged more by the “Magnificent 7” including Consumer Discretionary (XLY) with Amazon and Tesla, Tech (XLK) with Microsoft, Apple, and NVIDIA, and Communications Services (XLC) with Alphabet and Meta.
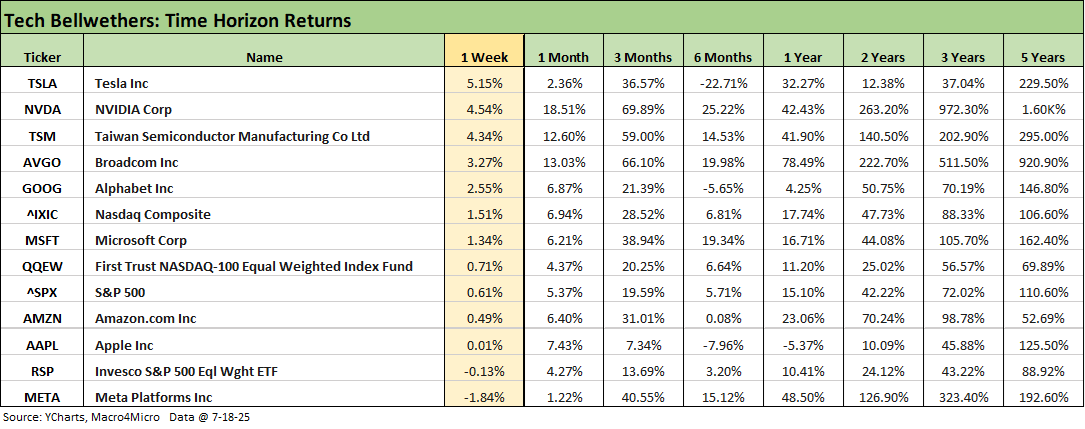
We already looked at the above table in our Mini Market Lookback: Macro Muddle, Political Spin (7-19-25). The dispersion across the Mag 7 performance has been a theme in 2025 and the same is true of the volatility around macro events such as tariffs and those shaping the yield curve. Apple has moved away from the “magnificent” label looking back over 1-year and 2-years and the trade policy threats clearly make that situation worse. Tesla (6 months) and Alphabet (6 months, 1 year) have been volatile across these time horizons with Amazon posting some shaky time horizons also during 2025.
The reasons for this volatility can vary by name and have become more idiosyncratic to the product mix and end markets and politics. There’s a reason the leaders of these companies a been making more than a few shameless pilgrimages to Mecca…we mean the White House.
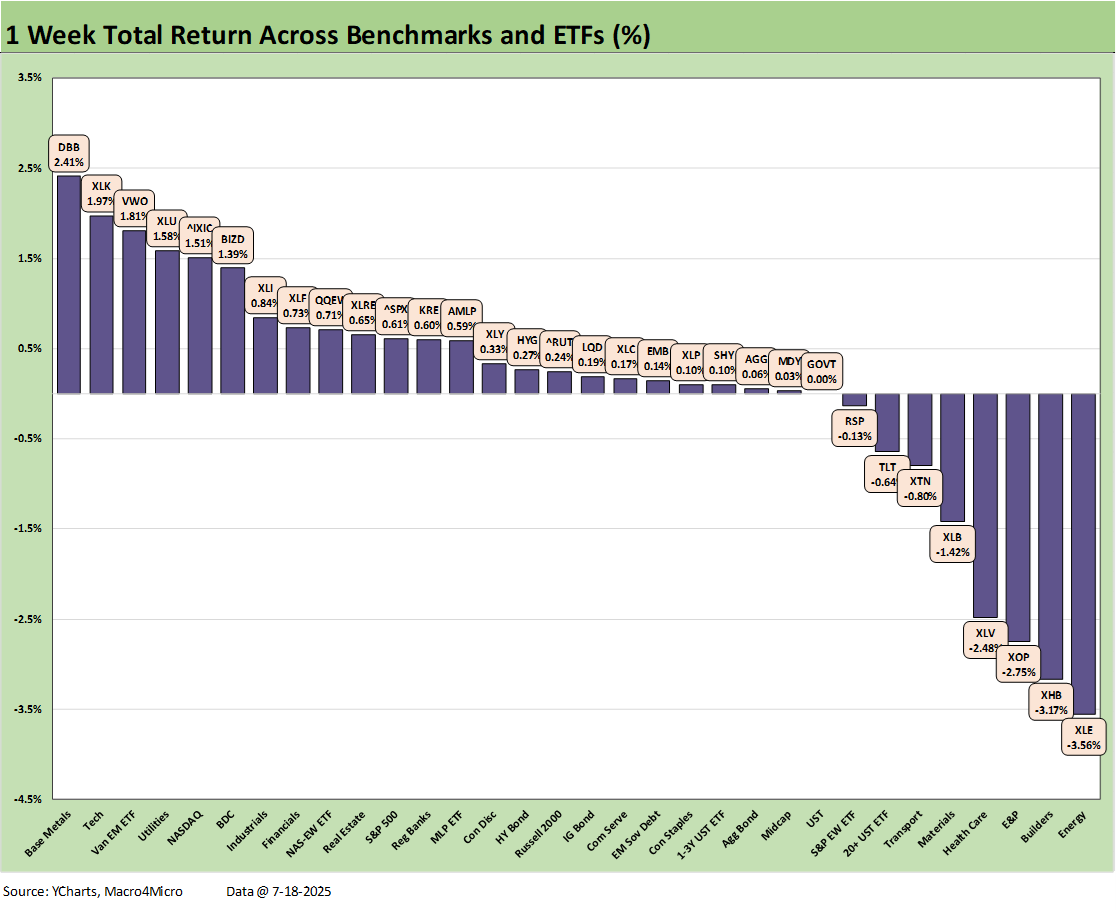
We already looked at the 1-week numbers in our Mini Market Lookback: Macro Muddle, Political Spin (7-19-25). Of the ETFs in negative range, only the equal weight S&P 500 ETF (RSP) is an infrequent bottom dweller with the industry ETFs in the bottom quartile. We see the upstream heavy energy ETFs (XOP, XLE) swing around from the low to high quartile with regularity on oil prices and geopolitical events (Iran).
In contrast, the Homebuilders (XHB), Health Care (XLV) and Transports (XTN) have been regular visitors to the bottom quartile on trends we have covered frequently. Interest rate sensitivity and tariff exposure are the main headwinds for such groups. The Materials ETF (XLB) is highly cyclical with high chemical sector exposure and has important correlation to cyclical markets such as construction and automotive among others as downstream demand drivers. The long duration UST 20+Y ETF (TLT) ends up in the bottom quartile almost every time we see a bear steepener from the long end or a notable move in the 30Y.
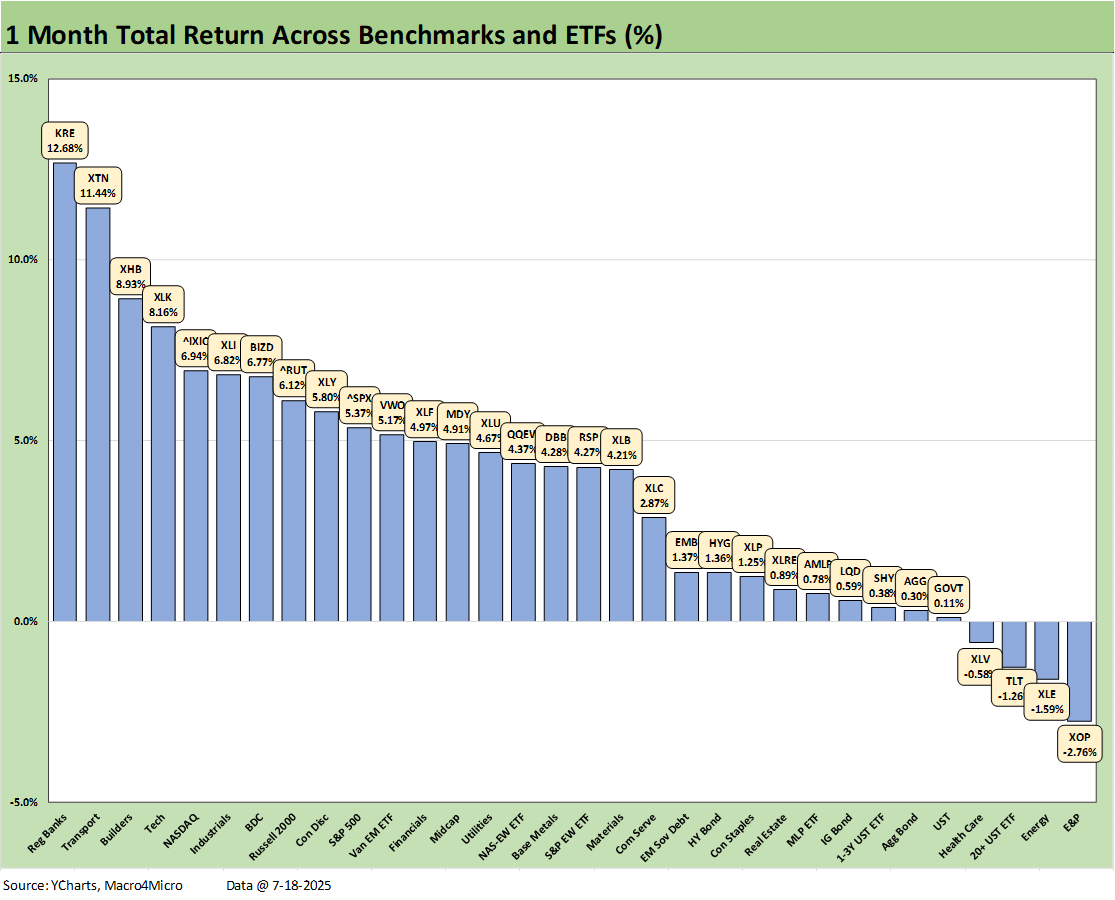
The 1-month rolling returns continue the rally at a score of 28-4 with energy ETFs (XOP, XLE), long duration UST (TLT) and another visit from the Health Care ETF (XLV). The 1-month numbers continue the bounce off the post-Liberation Day beatdown in early April ahead of Trump’s tactical retreat.
The recently reassigned tariff numbers targeting Aug 1 offer little relief to many countries in substance even if some have been trimmed. We also saw an outlier in Brazil which went from a 10% baseline in April to 50% recently on Trump seeking to dictate Brazilian law and their domestic politics (see US-Trade: The 50% Solution? 7-10-25).
In the top quartile, we are seeing Homebuilders (XHB) attempting a comeback from beaten down valuations ahead of a slew of major homebuilder earnings this coming week. XHB is second to last in YTD returns. We see Transport (XTN) also in the top quartile in another revaluation play after an abysmal YTD performance with XTN in third to last YTD.
Energy has had a very tough time YTD with E&P (XOP) in the bottom quartile above and negative YTD. We see XOP again in the last place for the 1-month as Middle East turmoil failed to deliver a supply shock. That said, the recent $67 (WTI) price to end last week is comfortably above the $60 area to end May.
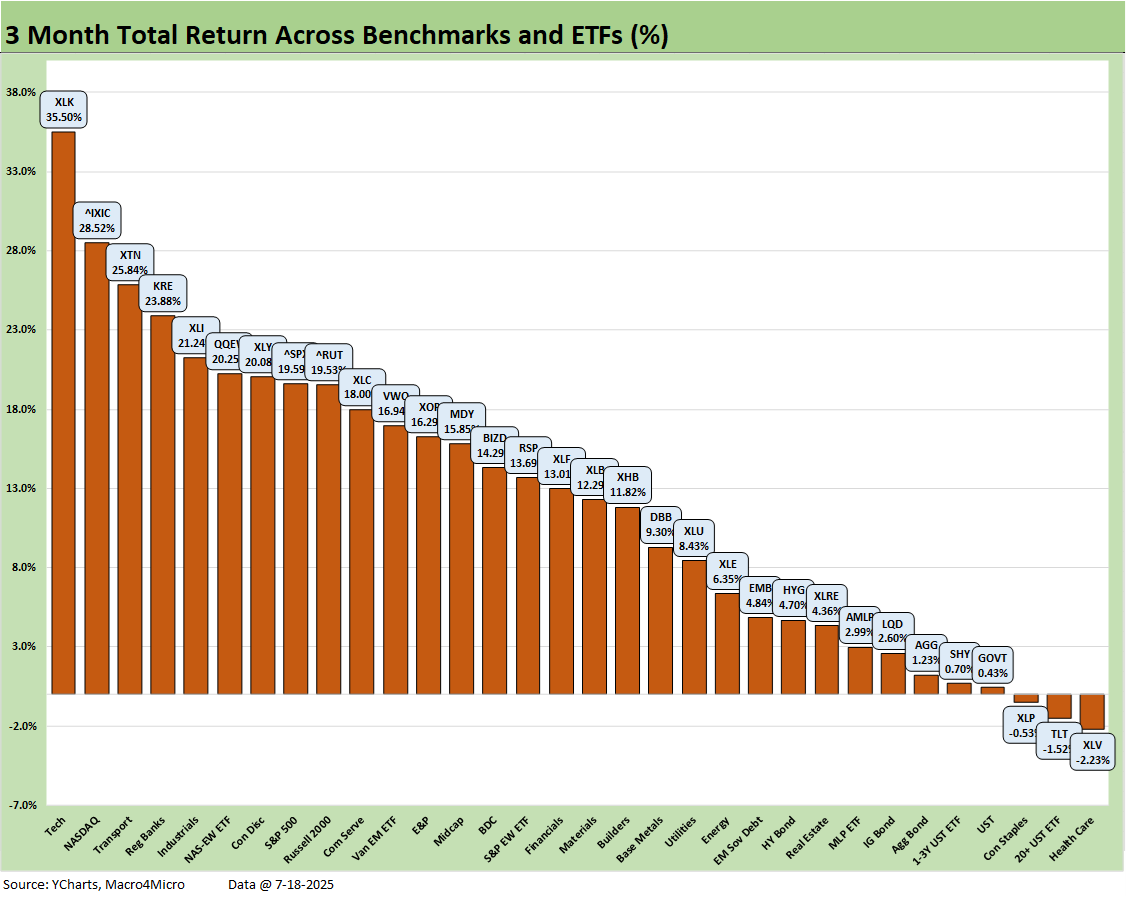
The rolling 3-month score of 29-3 includes the rebound from the Liberation Day shock. We also see Health Care (XLV), long duration UST (TLT) and Consumer Staples (XLP) in the red. The big winners were Tech (XLK) at #1 and NASDAQ at #2 with Transports ( XTN) getting a post-tariff Armageddon bounce and some support from the rebound after recently revised airline guidance that took some heat of the negative revisions earlier in the year.
We see some tech breadth with Equal Weight NASDAQ 100 (QQEW) in the top quartile with Regional Banks (KRE) and Industrials (XLI). On a positive note, seeing the Russell 2000 at the top of the second quartile is a favorable vote on fundamentals from that market segment with the Russell 2000 in the bottom quartile YTD.
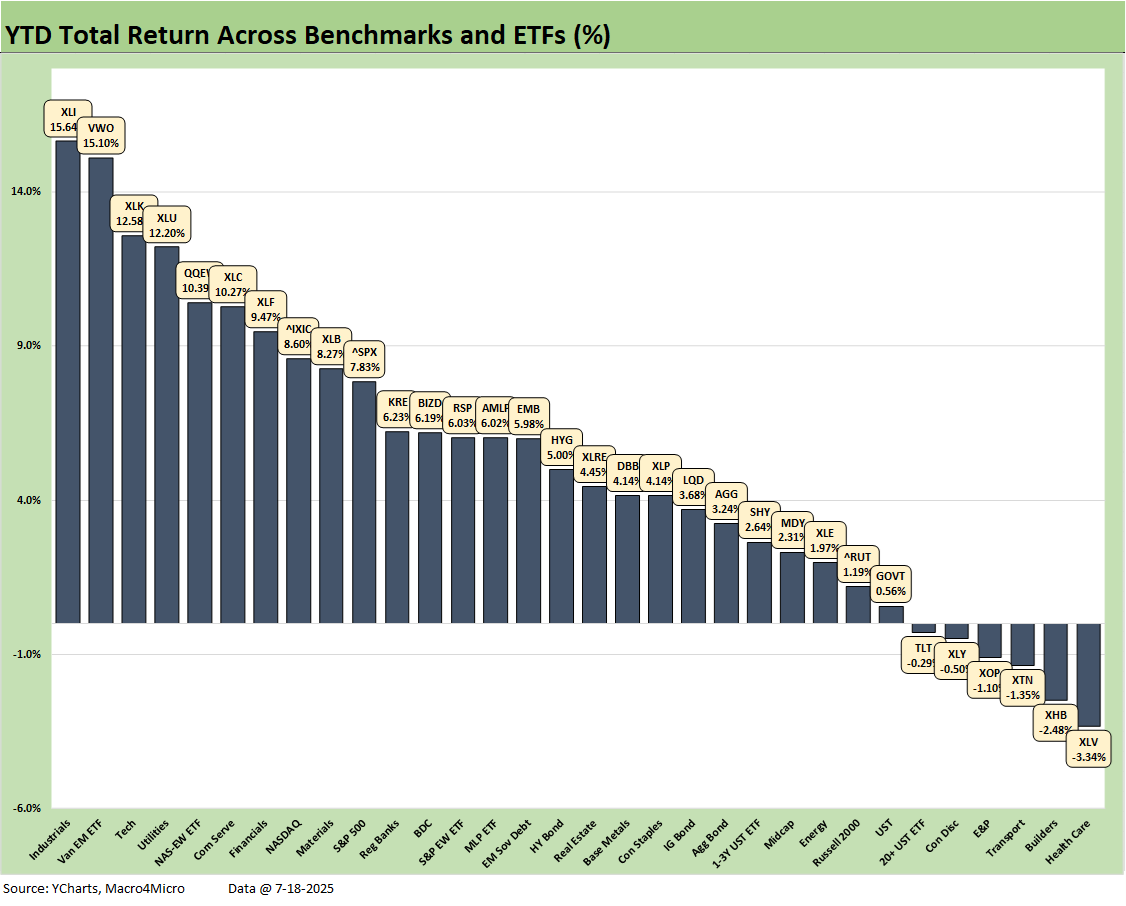
The YTD themes did not change much this week with the June quarter earnings season holding the swing vote with results and any revised guidance or new tariff impact color with the Aug 1 target date now out in the public domain.
We see it as a good sign when Industrials (XLI), Financials (XLF), and Utilities (XLU) are in the top quartile YTD. XLI is #1 YTD. That mix signals positive views around investment potential, credit availability and asset quality. That could of course prove optimistic if the EU or other trade partners fight back. Tech will “do its thing” and stay volatile in general but with its usual “up and to the right” history.
With EM Equities (VWO) in the top quartile YTD, that also makes some constructive statements about perceived global markets risk (notably faith in China) despite Trump’s trade war mongering seeing fresh rounds in Latin America. That trade war risk threat is overdue for a test before the summer is over and notably with the EU, Canada, and Mexico. They might wake up one day and decide a multi-front trade battle (even if not coordinated) might trigger Trump to go back into TACO mode.
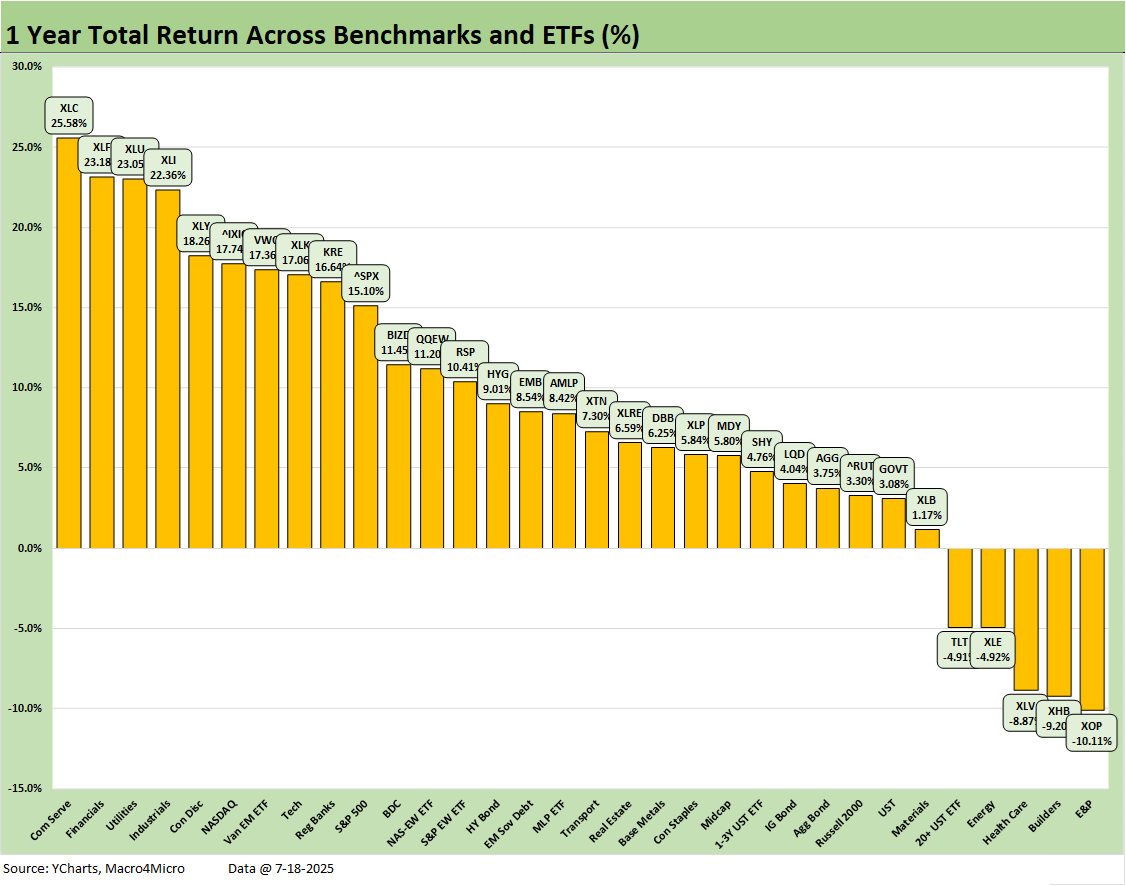
The LTM period saw a score of 27-5 again this week with negative returns on some commodity-exposed ETFs (XOP, XLE) and interest rate sensitive ETFs (TLT, XHB) along with the perpetually struggling Health Care ETF (XLV).
The LTM period above includes almost 5 months of the 2024 banner year in equities that was Part 2 of the best 2-year run in the S&P 500 since the late 1990s (see Footnotes & Flashbacks: Asset Returns for 2024 1-2-25). The combined 2023-2024 S&P 500 return of +45% cumulative for two years and +25% for 2024, respectively, will be very hard to match in 2025-2026.
The performance in 2023-2024 on the way to the LTM 2025 above undermines the weak premise of the Trump rhetoric that the country was “dying” until Trump came along (he was out on the screen with that line again today). He seldom (essentially never) cites facts or numbers/metrics in his diatribes – just SUPERLATIVES in all caps. That is symptomatic of what has been a crusade against facts and concepts as the Castrati Choir of the GOP Senate lets tariff policy run amok dictator style (we tend not to blame the House since they do not know any better).
As we mentioned above in the bullets, tariffs are falling especially hard on small businesses. There is extensive coverage of this issue by at range of small business trade groups. Every election sees a lot of lip service paid to the small business community which dominates the payroll ranks of the US and job creation. Unfortunately, too many in Washington fail to show up on game day. A lot of promises will not be kept since congressional promises have a carve out that does not allow for crossing Trump on tariffs. The economic plight of many small businesses will only get worse into 2H25. It is also worth keeping in mind with booming private credit. Those originating and managing such risk will really need to be on their game.
Markets:
Mini Market Lookback: Macro Muddle, Political Spin 7-19-25
Housing Starts June 2025: Single Family Slips, Multifamily Bounces 7-18-25
Retail Sales Jun25: Staying Afloat 7-17-25
June 2025 Industrial Production: 2Q25 Growth, June Steady 7-16-25
CPI June 2025: Slow Flowthrough but Starting 7-15-25
Footnotes & Flashbacks: Credit Markets 7-14-25
Footnotes & Flashbacks: State of Yields 7-13-25
Footnotes & Flashbacks: Asset Returns 7-12-25
Mini Market Lookback: Tariffs Run Amok, Part Deux 7-12-25
Mini Market Lookback: Bracing for Tariff Impact 7-5-25
Payrolls June 2025: Into the Weeds 7-3-25
Employment June 2025: A State and Local World 7-3-25
Asset Return Quilts for 2H24/1H25 7-1-25
JOLTS May 2025: Job Openings vs. Filling Openings 7-1-25
Midyear Excess Returns: Too little or just not losing? 7-1-25
Recent Tariff commentary:
US-Italy Trade: Top 15 Deficit, Smaller Stakes 7-18-25
US-France Trade: Tariff Trigger Points 7-17-25
Germany: Class of its own in EU Trade 7-16-24
US-Canada Trade: 35% Tariff Warning 7-11-25
India Tariffs: Changing the Music? 7-11-25
Taiwan: Tariffs and “What is an ally?” 7-10-25
US-Trade: The 50% Solution? 7-10-25
Tariff Man Meets Lord Jim 7-8-25
South Korea Tariffs: Just Don’t Hit Back? 7-8-25
Japan: Ally Attack? Risk Free? 7-7-25
US-Vietnam Trade: History has its Moments 7-5-25
US Trade in Goods April 2025: Imports Be Damned 6-5-25
Tariffs: Testing Trade Partner Mettle 6-3-25
US-UK Trade: Small Progress, Big Extrapolation 5-8-25
Tariffs: A Painful Bessent Moment on “Buyer Pays” 5-7-25
Trade: Uphill Battle for Facts and Concepts 5-6-25
Ships, Fees, Freight & Logistics Pain: More Inflation? 4-18-25
Tariffs, Pauses, and Piling On: Helter Skelter 4-11-25
Tariffs: Some Asian Bystanders Hit in the Crossfire 4-8-25
Tariffs: Diminished Capacity…for Trade Volume that is…4-3-25