
CPI June 2025: Slow Flowthrough but Starting
CPI tariff impacts are tied to working capital (inventory costs), post-pause schedules (Aug 1), the coming 232 wave, and the pricing plans of buyers.


Tariff policy dictated by thoughtful analytics.
The monthly CPI exercise is more mired in the weeds for many as the market looks for signals. Our approach is to look at Table 1 and scan all the MoM moves by product groups that will remain in the trade partner crosshairs as the tariff wave keeps coming. We obviously look at YoY CPI for the major categories, but MoM is the leading indicator these days.
The headline YoY numbers were well contained at +2.7% headline and +2.9% Core CPI. Whether this gives the Fed an excuse to move on modest easing is a tough call even if the basic rationale on Trump tariffs is unchanged. Outsized tariffs are certain to impact prices and notably after the Aug 1 start date for many lines and as more Section 232 impacts roll into working capital cycles. We saw early MoM signs in areas such as Apparel, Footwear, Furniture, and Appliances this month, but Durables such as autos remained very low given the strategies and dynamics of the OEMs working with supplier chains upstream and dealer networks downstream.
The special aggregate indexes (Table 3) tell some interesting stories with MoM “All Items less shelter” rising from May 2025 (0.0% to +0.3%) and “All Items less food and shelter rising (-0.1% to +0.4%). “All items less food, shelter, and energy rose MoM to +0.3% from 0.0%.
In the special aggregates table, we saw Durables move to +0.1% from -0.1% MoM and Nondurables to +0.4% from -0.3%. That shows pricing pressure. Total Services (64% of CPI) remains sticky at +3.8% YoY and ticked higher only slightly MoM to +0.3% from +0.2%.
Energy commodities brought inflation benefits from weaker oil and YoY deflation of -8.3% in gasoline, but Energy Services remained ugly with YoY Electricity at +5.8% on a 1.0% MoM move and Utility (piped) gas services at +14.2% (MoM +0.5% in June vs.-1.0% in May).

The above chart is our usual update of headline CPI across the cycles plotted against fed funds. Those of us who came of working age back in the 1970s stagflation years fully appreciate the caution of the FOMC in being worried about tariff effects. The FOMC is aware that the tariff is paid by the buyer and not the selling country even if Trump keeps saying the opposite and the bleating sheep on his trade team will not state that basic fact.
The stagflation years of the early 1970s after the Arab Oil Embargo of Oct 1973 and the 1980-1982 double dip were ugly times for the economy as macro shocks and industry restructurings were exacerbated by a need to adapt strategies and cost structure to rapid deregulation across many sectors.
The chart offers a reminder that current headline CPI is below the long-term median for CPI while fed funds is also lower than the long-term median. Even with all those ZIRP years and the very low UST normalization periods from late 2008 to March 2022, the fed funds rate offers a comfortable incremental cushion above CPI of 1.6 points. Trump has called for 300 bps (!) of easing which would send that differential into the negative zone. How about we start with 25 bps?!
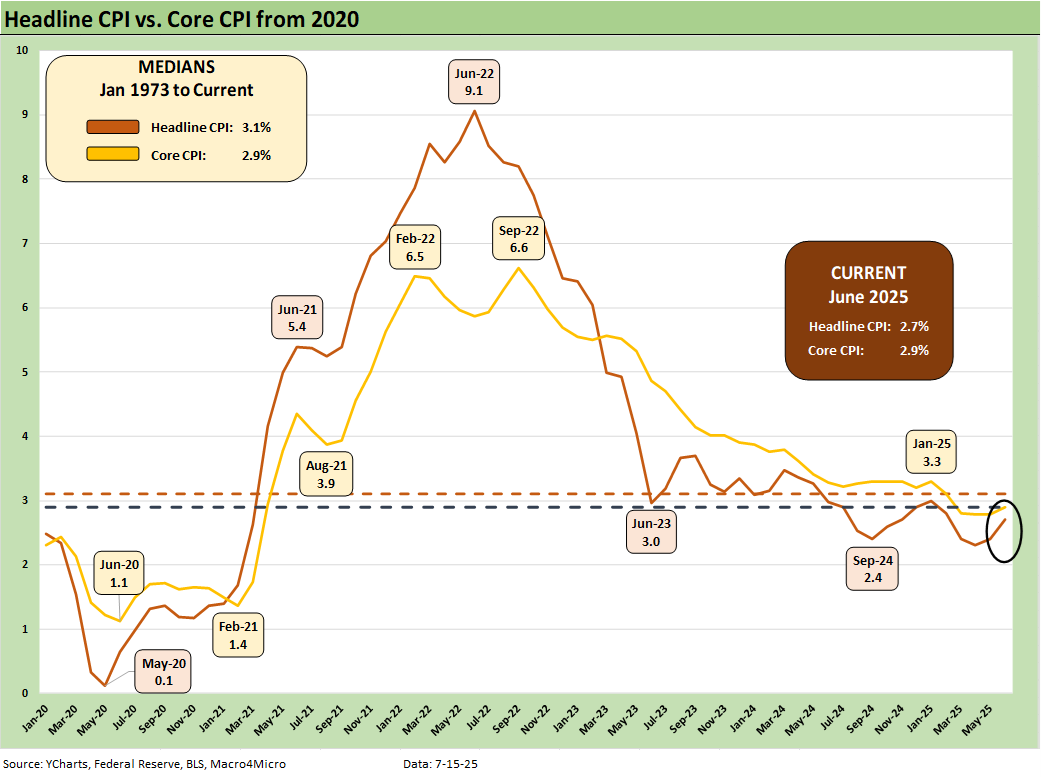
The above chart updates the running Headline CPI vs. Core CPI from 2020 for a frame of reference that is heavily wagged by energy. We frame recent numbers vs. the post-1973 medians in the box in the upper left of the chart. We are below the long-term headline CPI median but the June Core of +2.9%, which ticked up sequentially from +2.8%, is essentially at the long-term median. That partisan statement by Trump that “We have no inflation” should read “We are at median Core CPI inflation.”
The headline inflation including food and energy gets into the wild ride of energy across cycles (see Inflation: The Grocery Price Thing vs. Energy 12-16-24,). In the current release, food has a mixed profile by line item. Beef and Poultry had inflationary MoM trends while Pork had a deflationary month. These are after all commodities, so there is a reason core has been embraced as a favored metric over the years (see Inflation Timelines: Cyclical Histories, Key CPI Buckets11-20-23).
Among the food headliners, eggs get way too much political chatter and are tainted by avian flu factors. In the CPI weighting, eggs as a CPI line (0.18%) is smaller than Meats (0.93%) and slightly bigger than coffee (0.14%). Coffee, which has already been under pressure (+13.4% YoY), will soon take a further beating on the proposed 50% Brazil tariffs. Brazil is the #1 coffee importer into the US. As an aside, Vietnam is also a major exporter of coffee to the US.
Brazil is also a huge import source for beef (21% of US beef imports). The beef and veal CPI line is +10.6% YoY with a CPI weighting 2.5x eggs. In Trump world, the selling country (Brazil) pays the tariff on the Brazilian beef and coffee. On planet earth and at the border, customs charges the tariff to the US importer/buyer. There are other reasons why beef is higher (droughts, herd size, etc.), but tariffs will not help. Meat products ranked #5 on the Brazil import list (see US-Trade: The 50% Solution? 7-10-25).
The heavy mix of Services in the economy and potential for material upward pressure on Goods tied to tariffs makes the 2% PCE target by the Fed (or any 2.0% target for CPI) a tough home stretch. As we note in the charts below, Services at 3.8% makes it tough to move the needle without sustained Goods deflation – and it’s going the other way. Goods are the main targets for tariffs, so that is challenging math as we push beyond the effective dates of the tariffs and inventory gets stocked.

The above table updates the YoY unadjusted CPI rates for a range of special CPI aggregate indexes we like to monitor. We highlight that these are YoY unadjusted numbers that tend to be the main metric in the headlines. However, with the tariffs ramping up and soon to reach an unprecedented scale, the MoM sequential SAAR numbers are likely to get the most scrutiny as we cite in the bullets above.
Both “All Items less shelter” (+2.0% YoY, +0.3% MoM) and “All items less food, shelter and energy” (+2.2% YoY, +0.3% MoM) remain in the low 2% range for YoY, but both (plus some other special aggregates) show clear sequential MoM upticks. That MoM trend will need to be closely monitored as import tariffs weigh in as detailed in our tariff commentaries (see links below).
Tariffs at the national level will hit Food on border taxes but Section 232 primarily targets a wide range of manufactured goods and supplier chain inputs. The material costs used in manufacturing goods in the US (notably steel, aluminum, copper and soon Section 232 on lumber) will be rolling into CPI and PPI numbers, so the exercise will get more demanding in the summer and fall months.
While goods will be the focal point for CPI deltas and are often buried in the fine print of Tables 1, 2, and 3 of the CPI release, Services remains the main CPI glacier line at 3.8% and almost 64% of CPI. We see Durables and Nondurables moving higher MoM as noted in the bullets, but the YoY CPI remains below 1%.

The above table breaks out the Big 5 CPI buckets. As we note each month, we crafted our own CPI mix for automotive given its extraordinary role in the typical US household budget in what is a “driving country” (see Automotive Inflation: More than Meets the Eye10-17-22).
We summarize a few key highlights below:
Food:
We see “Food all” ticked higher YoY to 3.0% with Food at Home higher YoY sequentially to +2.4% from +2.2% but was flat MoM at +0.3%. “Food away” from home has been stubborn at 3.8%.
As noted above, we are seeing some major YoY changes in select meat lines with “Meat, Poultry, and Fish” at +4.1% and an increase MoM from -0.1% to +0.8% (1.45% weighting in the CPI index). Eggs are “only” +27.3% YoY, but we see -7.2% MoM. Eggs are just 0.18% of the CPI index, so that line gets cited too often and extrapolated in a “less than conceptual way” as a reflection of food prices. Coffee is +13.4% YoY and is likely to head higher on tariffs (Brazil plus other importers). Fruits and Vegetables were only +0.7% YoY but tripled MoM to +0.9%. Food at home will take some sorting out ahead on high Mexican tariffs, and labor factors such as deportation (or hiding) and how that flows into farmer costs.
Automotive:
The overall tariffs threat in autos is arguably less about inflation in 2025 pricing and more about planning for the devastating expense impact on the supplier chain, the coming upheaval in product line and capacity planning (e.g. GM in Mexico) and who bears the expenses from sellers to buyers (finished vehicle imports/transplants vs. suppliers).
We have looked at the dealer views in our single name work, and they are fairly constructive given the needs of the OEMs to keep customers happy and moving inventory. Light vehicle transaction prices have soared in the post-COVID cycle but should remain in check at least for 2025.
The 2Q25 earnings season will bring a lot more disclosure, guidance on margins and tariff costs, and likely more than a little topic evasion and political caution. We expect many companies will be hesitant to quantify the impact with the OEMs really the epicenter for getting the industry through this next stage. The painful tariffs on South Korea and Japan imports and high value components set the table for trade tension and also material adjustments in inventory into the fall.
The OEMs are ground zero for stabilization of the tariff impact through incentives, cost mitigation actions, and more likely than not overhauling global supplier chain strategies. The scale of tariffs on materials – notably in steel, aluminum and copper – and components will flow into payrolls and financial stress in the supplier base. The recurring attacks by the White House on EV incentives will directly impact project planning.
Medical care:
Medical costs for consumers (including coverage at all) are in store for dramatic change ahead with the Medicaid worries as well as the tariffs on health care supplies of all types across countries (notably the EU and China). There is also the looming threat to pharma from Trump of “very, very high tariffs” as he plans to force relocation to the US.
That risk around pharma could make it the ground zero of an EU-US trade war as we cover in other commentaries. Labor costs, legislation, and tariffs are all part of what will be damaging to industry subsectors and will further strain household budgets. Pharma is at the top of the inflation list for health care, and Medicaid uncertainty is next in framing household damage via prices or in the form of coverage. The retrenchment in health care grants to higher education and research will have to flow into private sector costs or simply disappear. Health care is around 18% of GDP.
Energy:
Trump has many friends in the upstream energy sector, but he also has some believing he wants oil to collapse to $50 even while they see him as their policy friend. Gasoline deflation is always popular in peak driving season, but energy has a rich history of volatility that becomes a mug’s game to predict. The role of Russian supply and Iranian supply are the two biggest moving parts for the remainder of 2025. A sub-$60 WTI price raises questions on US drilling economics.
The inflation pressures in Energy services has been a big story in the numbers as electricity and power shortages become a dominant topic on demand growth. The potential for the shortages to get worse in the data center and AI boom mean higher prices. Energy services have also seen high inflation as noted above with YoY Electricity at +5.8% on a 1.0% MoM move and Utility (piped) gas services at +14.2% (MoM +0.5% in June vs.-1.0% in May.
Shelter:
The stubbornly high inflation in shelter services and the accounting quirks of “Owners Equivalent Rent (OER)” is a topic we have covered too many times in the past with shelter CPI dominated by theoretically derived and rent-imputed cost of shelter. The price in home sales and funding costs via mortgages are not in the CPI equation.
Away from the CPI measurement issues for CPI, the average selling prices of homes (not reflected in CPI metrics) are feeling some pressure as we cover in our single name research on builders and housing sector macro work. Since the change in the analytical framework for shelter CPI back in the early 1980s by the BLS, transacted home prices and financing costs are not the housing CPI drivers. We refer you to our housing research.
The reality is that shelter CPI at 3.8% and 35% weighting in the CPI index is why we like using the special aggregate CPI index ex-shelter. That is only 2.0% for June. That is a nice low starting point to wade into the chaos of the Trump tariff program.

The above table updates some of the “near and dear” products and services lines. These are YoY numbers, but the real action will be in the MoM trend as very high tariffs roll into place for the “labor arb” countries in Asia (notably China, Vietnam, and Indonesia among others) as detailed in the links below. The same is true in Mexico.
Apparel and footwear especially are items that will rattle households as the impact rolls into transaction flow in the holiday season and some in the back-to-school period. Toys (0.29% CPI weighting) were +0.3% MoM into April, +1.3% MoM into May, and +1.8% MoM into June. That will matter to many, even if they don’t admit it.
Other Inflation Related:
PCE May 2025: Personal Income and Outlays 6-27-25
CPI May 2025: The Slow Tariff Policy Grind 6-11-25
Employment Cost Index 1Q25: Labor is Not the Main Worry 5-1-25
Inflation: The Grocery Price Thing vs. Energy 12-16-24
Inflation Timelines: Cyclical Histories, Key CPI Buckets11-20-23
Fed Funds – Inflation Differentials: Strange History 7-1-23
Fed Funds, CPI, and the Stairway to Where? 10-20-22
Automotive Inflation: More than Meets the Eye10-17-22
Inflation: Events ‘R’ Us Timeline 10-6-22
Markets:
Footnotes & Flashbacks: Credit Markets 7-14-25
Footnotes & Flashbacks: State of Yields 7-13-25
Footnotes & Flashbacks: Asset Returns 7-12-25
Mini Market Lookback: Tariffs Run Amok, Part Deux 7-12-25
Mini Market Lookback: Bracing for Tariff Impact 7-5-25
Payrolls June 2025: Into the Weeds 7-3-25
Employment June 2025: A State and Local World 7-3-25
Asset Return Quilts for 2H24/1H25 7-1-25
JOLTS May 2025: Job Openings vs. Filling Openings 7-1-25
Midyear Excess Returns: Too little or just not losing? 7-1-25
Recent Tariff commentary:
US-Canada Trade: 35% Tariff Warning 7-11-25
India Tariffs: Changing the Music? 7-11-25
Taiwan: Tariffs and “What is an ally?” 7-10-25
US-Trade: The 50% Solution? 7-10-25
Tariff Man Meets Lord Jim 7-8-25
South Korea Tariffs: Just Don’t Hit Back? 7-8-25
Japan: Ally Attack? Risk Free? 7-7-25
US-Vietnam Trade: History has its Moments 7-5-25
US Trade in Goods April 2025: Imports Be Damned 6-5-25
Tariffs: Testing Trade Partner Mettle 6-3-25
US-UK Trade: Small Progress, Big Extrapolation 5-8-25
Tariffs: A Painful Bessent Moment on “Buyer Pays” 5-7-25
Trade: Uphill Battle for Facts and Concepts 5-6-25
Ships, Fees, Freight & Logistics Pain: More Inflation? 4-18-25
Tariffs, Pauses, and Piling On: Helter Skelter 4-11-25
Tariffs: Some Asian Bystanders Hit in the Crossfire 4-8-25
Tariffs: Diminished Capacity…for Trade Volume that is…4-3-25Reciprocal Tariff Math:
Hocus Pocus 4-3-25