
US-Vietnam Trade: History has its Moments
We update US-Vietnam import/export volumes and product mix as a 20% deal is struck. Vietnam offers food for thought.


Escalate on all tariff fronts. They will back down. We are all powerful. What can possibly go wrong?
We could not resist the above Vietnam lookback visual and raise the question of overconfidence that all opponents (“enemies”?) will defer to American might and simply negotiate terms of surrender in tariffs. Vietnam did, but there are some big numbers coming with many trade partners.
Pushing too many trade partners too hard on all fronts raises some material risk questions on the demand and supply side but also with respect to the transaction chain (inventory, cost of sales) and how that all flows into the economy, impacts prices (pass-through of tariff costs to protect margins), or generates expense mitigation actions (layoffs or retrenchment that affect other revenue lines). Multiplier effects matter.
The latest tariff deal sets the stage for a wave of activity this coming week if the deadline holds or at least starts the process of the “letters” being sent out the trade partners. As a reminder, these “reciprocals” are not literally “reciprocal.” In contrast, they are about limiting trade deficits.
We update Vietnam trade history and import/export product mix and look at a range of trade metrics from this past week’s updated data.
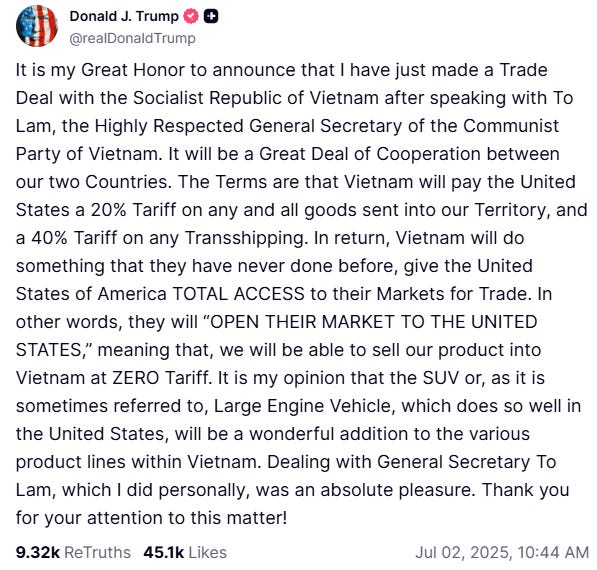
The visual above is from a Truth Social by Trump this past week. It makes a statement (as in a false one). Read the part where it says the following:
“Vietnam will pay the United States a 20% tariff…”
The motives for the continued falsehoods around “who writes the check to customs” are clear enough as Trump continues to maintain consistency with his misrepresentations to his base that he collected “hundreds of billions” from selling countries in Trump 1.0.
When we hear the recurring comparison to inflation metrics in Trump 1.0, we highlight that there is minimal comparison in the scale of Trump 2.0 tariffs to what was in place in Trump 1.0. On side note, the 2018 asset return story was grim (see Histories: Asset Return Journey from 2016 to 2023 1-21-24). The ugly asset returns of 2018 even as Trump hit his peak annual GDP growth year in 2018 at +3.0%. This week he continues to frame Trump 1.0 as the greatest economy in history as he sells his legislative plans. That is about as accurate as Vietnam paying the tariff. (see Trump's “Greatest Economy in History”: Not Even Close 3-5-25).
Tariff “truth” has very high stakes for the economy…
The magnitude of tariffs in place now and soon to be rolling in with the end of the pause on the (misnamed) “reciprocal tariffs” also comes with the growing queue of high-volume Section 232 tariffs in process (most notably pharma, semis, aircraft/parts, lumber, copper) that take tariff exposure to a record higher by multiple.
There is of course an economics debate around how this cost gets shared from sellers to importers and along supplier chain to finished goods and customers, but the “Truth” as posted on “Truth Social” is a pure lie in no small irony to the brand name. It is aimed at the most gullible and blind faith believers or aimed at the least informed. The leaders of Congress and the media who seek them as guests had very little to say. We still recall the head of the House Ways and Means Committee (R-MO) stating in direct response to a question on CNBC: “Seller pays” he said. Sign of the times.
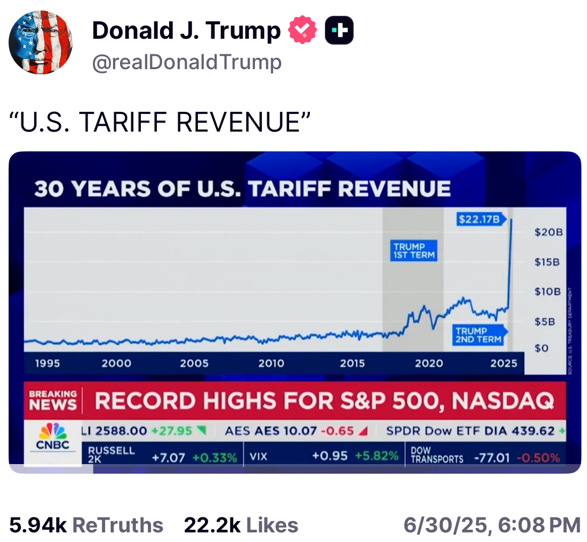
The chart above is another “Truth” posted by Trump. We would argue it is mislabeled. It could easily say “cash payments made by importers/buyers that end up the US Treasury.” Another version is “trend line in regressive taxes paid by US-based businesses and consumers.” The spike seen on the right side of this time series will go much higher.
Vietnam-US trade and the import/export product mix
Below we recap the most recent data in imports from Vietnam to the US. Imports soared as US buyers sought alternatives to China and China set up operations in Vietnam. Below that import table, we also detail exports, which are minimal in the overall trade picture.
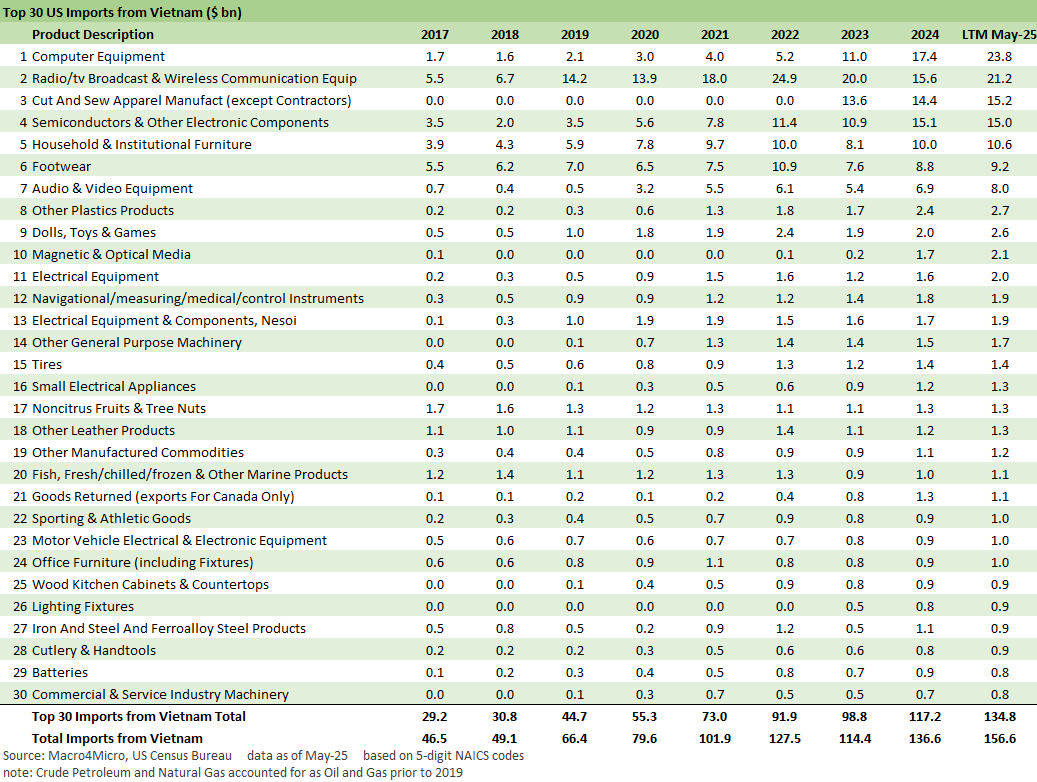
The above chart highlights the scale and range of import volumes from Vietnam into the US and how they have grown even just since 2017. The flavor incudes many tech-based and electronics products where the labor arb is a material advantage and market detour from China sourcing. We also see low-cost electronics and toys among others.
Back when NATFA was set up long ago (effective 1993) and other tax advantaged areas were set up along the border, the wave of computer and PC assembly to South of the border into Mexico was one of the early waves of import sourcing. The assembly cost saving and labor arb was critical.
At a 20% tariff, Vietnam will still be lower cost than Mexico and China when the smoke clears. Cheap labor for such operations will not be available in the US, so these tariffs will have an easy time flowing into prices as buyers move to recover the cost of the tariff.
We also see a heavy base of “Cut and Sew Apparel” and Footwear” in the Top 10 imports from Vietnam. As an aside, Vietnam was the largest supplier to Nike as we looked at this past week (see Mini Market Lookback: Eye of the Beholder 6-28-25). The main issue on Apparel and Footwear tariffs is those items certainly show up in household budgets. That makes it a regressive tax.
As we covered after the first wave of “reciprocals” (and we use the misnomer loosely), low-cost Asian suppliers of apparel/footwear were in the crosshairs including the #1 and #2 imports from Indonesia (see Tariffs: Some Asian Bystanders Hit in the Crossfire 4-8-25). In these categories, we have a hard time seeing how prices do not rise in Apparel to offset the costs (see CPI May 2025: The Slow Tariff Policy Grind 6-11-25). The US cost base will not undercut them to the extent any exist in the future.
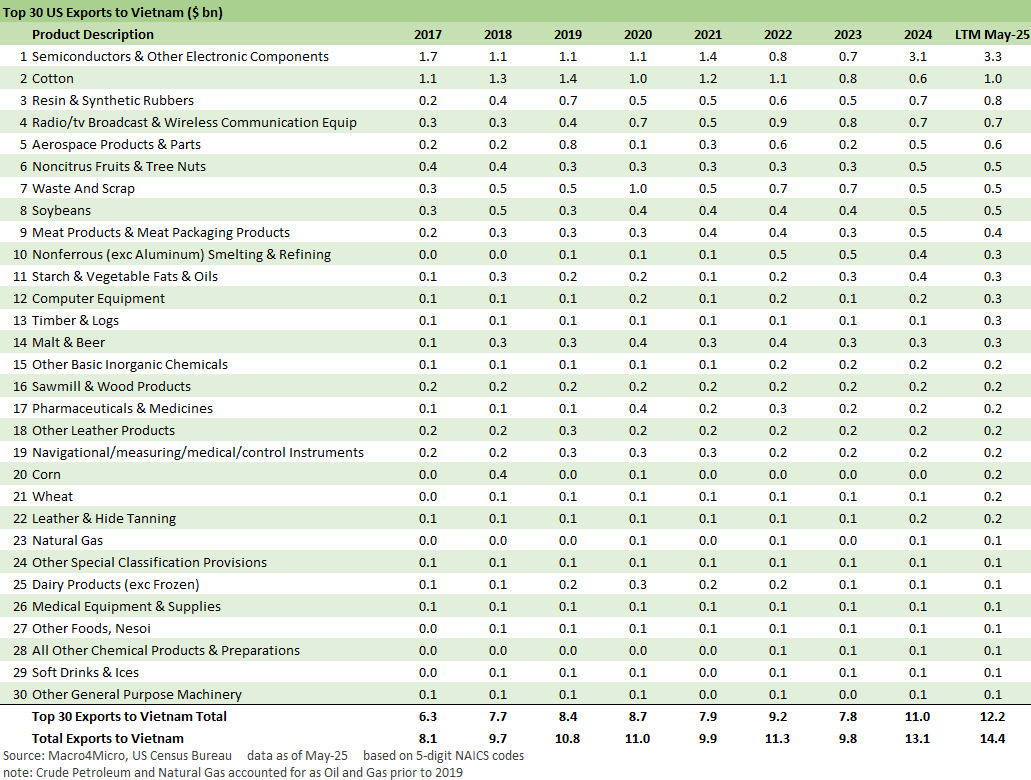
The above chart underscores the export volume to Vietnam is minimal, and thus the massive trade deficit. Trump highlighted the potential for SUVs and trucks at 0% tariffs, but there is a lot of low-cost production of such items in Asia.
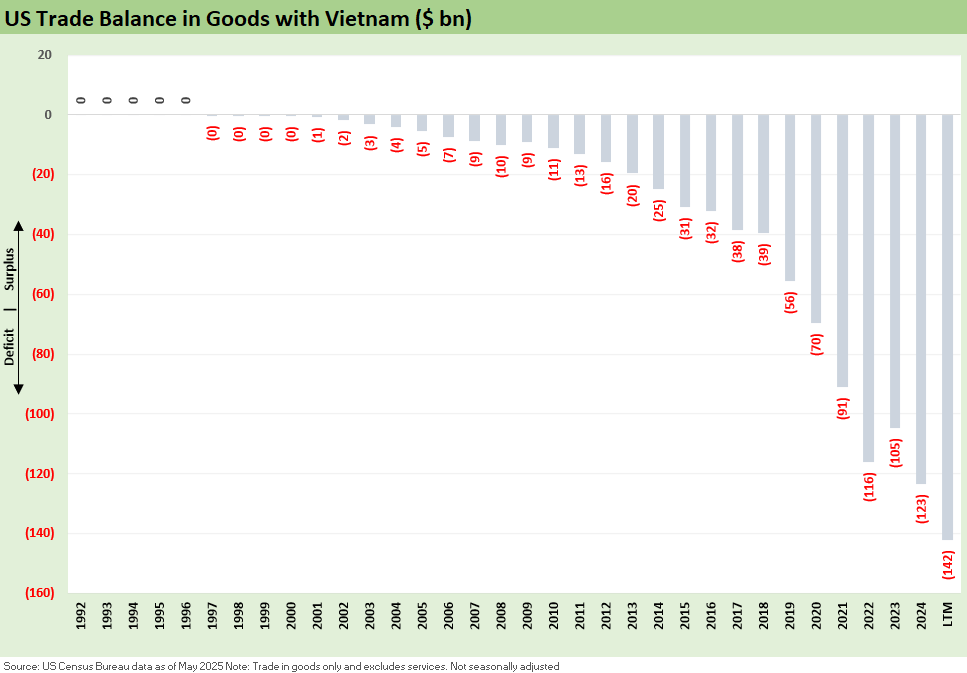
The above chart plots the time series for US-Vietnam trade deficits. There is little mystery to the trend. Trump calls such trade deficits “subsidies” and massive payments to Vietnam. In economic terms and substance, however, the Vietnam trade deficit is a case of arm’s length transaction with customers who chose to buy from Vietnam.
The deficit is a function of low-cost sourcing to support profit margins, employ people in the US across a range of businesses, to increase profits to expand in the US and globally, and to reward shareholders. That is without factoring in all the multiplier effects that come with global trade and freight and logistics and real estate etc. (see The Trade Picture: Facts to Respect, Topics to Ponder 2-6-25, Tariffs: Questions to Ponder, Part 1 2-2-25). For a recent example, there are Nike locations in malls and towns all over (and a massive one on 5th Avenue). The range of brands and retail operations stack up from there.
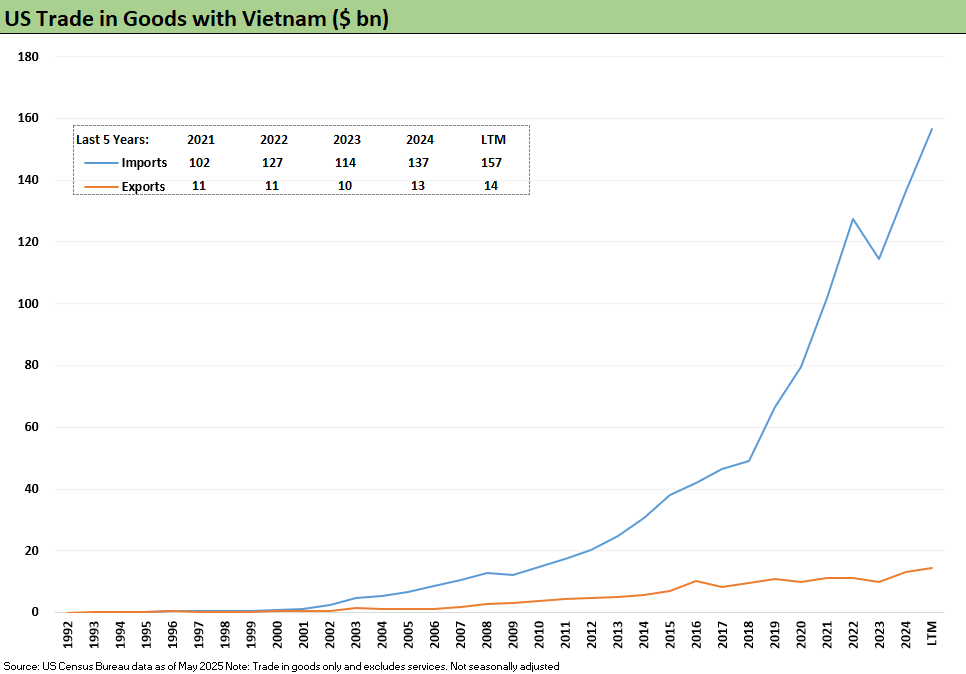
The above chart offers another angle on the rise of Vietnam imports and badly lagging exports. Once again, the trend is obvious.
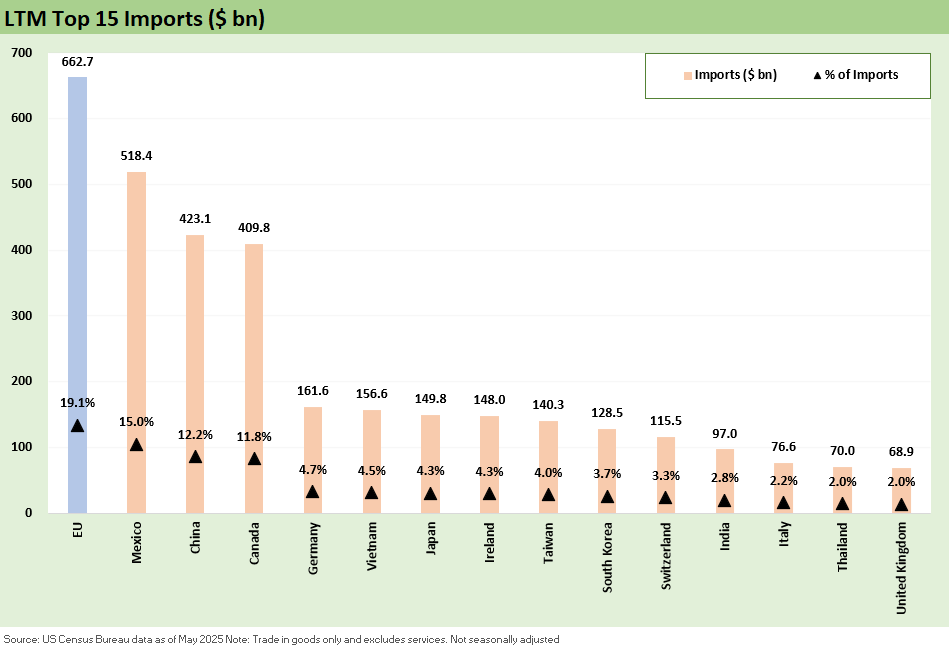
The above chart updates the Top 15 importers into the US on an LTM basis. We list the EU as a single trade partner and separately list individual EU countries. We see Vietnam at #6 (#5 by nation).
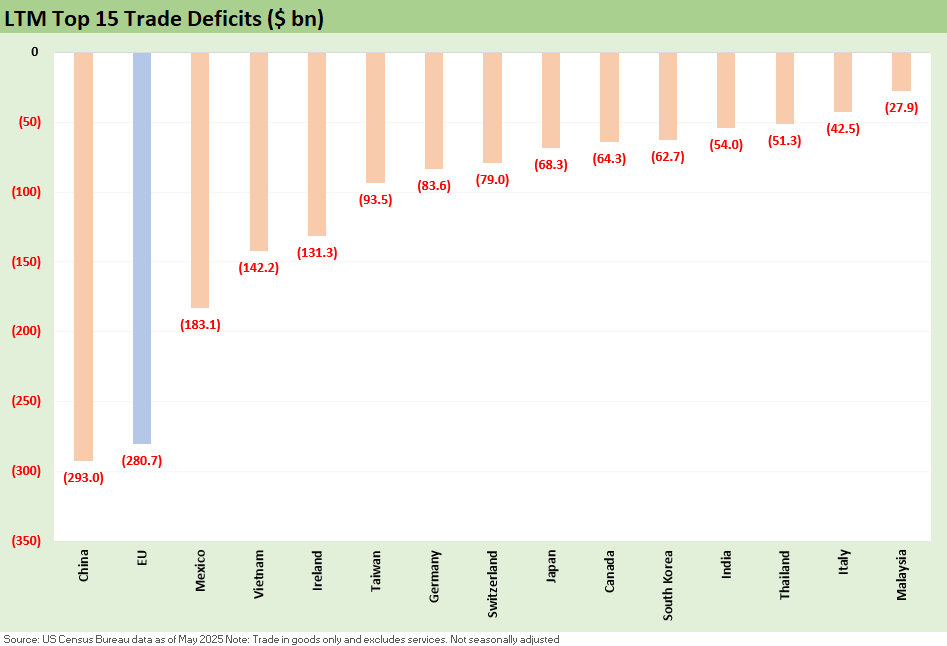
The above chart updates the Top 15 trade deficits. We see Vietnam at #4 (#3 by nation). Ireland is also in the Trump crosshairs as a small nation dominated by imports (pharma).
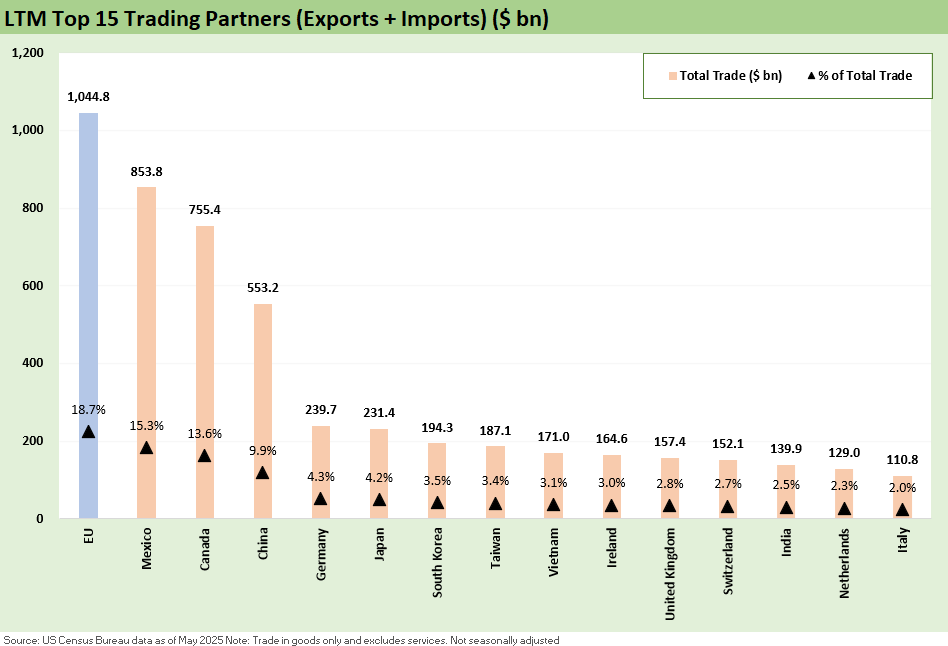
The above chart details the Top 15 trade partners based on “Imports + Exports.” Vietnam made the Top 10 at #9 (#8 by nation).
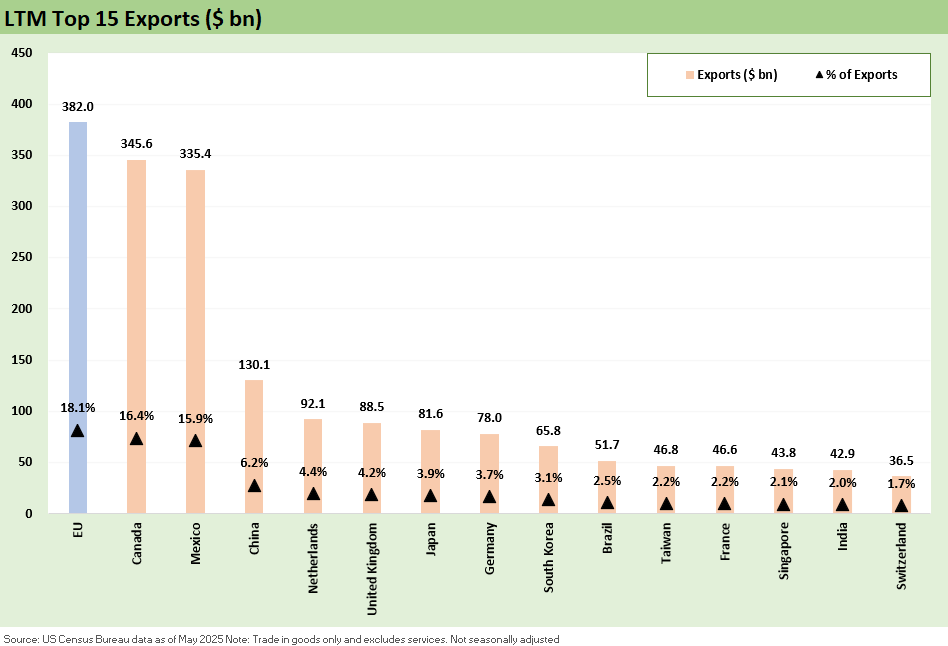
The above chart updates the Top 15 exports. Vietnam does not make the list. It is worth remembering as we head into the home stretch on “reciprocals” and new Section 232 tariffs that the Top 3 export markets (EU, Canada, Mexico) comprise over half (52.2%) of US exports. As Trump makes noise about the US “holding all the cards” we should remind him we must be exporting a lot of those card decks.
Those same 3 countries comprise just under half of total trade (exports + imports). Those 3 trade partners are not set on trade terms yet. It a safe assumption that the USMCA is in harm’s way into 2026 – if not sooner.
Tariff related:
US Trade in Goods April 2025: Imports Be Damned 6-5-25
Tariffs: Testing Trade Partner Mettle 6-3-25
US-UK Trade: Small Progress, Big Extrapolation 5-8-25
Tariffs: A Painful Bessent Moment on “Buyer Pays” 5-7-25
Trade: Uphill Battle for Facts and Concepts 5-6-25
Tariffs: Amazon and Canada Add to the Drama 4-29-25
Ships, Fees, Freight & Logistics Pain: More Inflation? 4-18-25
Tariffs, Pauses, and Piling On: Helter Skelter 4-11-25
Tariffs: Some Asian Bystanders Hit in the Crossfire 4-8-25
Tariffs: Diminished Capacity…for Trade Volume that is... 4-3-25
Reciprocal Tariff Math: Hocus Pocus 4-3-25
Reciprocal Tariffs: Weird Science Blows up the Lab 4-2-25
See also:
Payrolls June 2025: Into the Weeds 7-3-25
Employment June 2025: A State and Local World 7-3-25
Asset Return Quilts for 2H24/1H25 7-1-25
JOLTS May 2025: Job Openings vs. Filling Openings 7-1-25
Midyear Excess Returns: Too little or just not losing? 7-1-25
Footnotes & Flashbacks: Credit Markets 6-30-25
Footnotes & Flashbacks: State of Yields 6-29-2025
Footnotes & Flashbacks: Asset Returns 6-29-2025
Mini Market Lookback: Eye of the Beholder 6-28-25
PCE May 2025: Personal Income and Outlays 6-27-25
Durable Goods May25: Aircraft Surge, Core Orders Modest Positive 6-26-25
1Q25 GDP: Final Estimate, Consumer Fade 6-26-25
New Home Sales May 2025: Slip and Slide 6-25-25
KB Home 2Q25: Negative Industry Trends Keep Coming 6-25-25
Existing Homes Sales May 2025: Sequential Stronger, YoY Weaker 6-23-25
Mini Market Lookback: FOMC Spoke Clearly, Iran and Trump up next 6-21-25
Lennar 2Q25: Bellwether Blues 6-20-25
FOMC Day: PCE Outlook Negative, GDP Expectations Grim 6-18-25
Home Starts May 2025: The Fade Continues 6-18-25
May 2025 Industrial Production: Motor Vehicle Cushion? 6-17-25
Retail Sales May 25: Demand Sugar Crash 6-17-25
Mini Market Lookback: Deus Vult or Deus Nobis Auxilium 6-14-25
Credit Snapshot: Hertz Global Holdings 6-12-23
CPI May 2025: The Slow Tariff Policy Grind 6-11-25
Mini Market Lookback: Clash of the Titans 6-7-25
Past-Prologue Perspective for 2025: Memory Lane 2018 6-5-25